I-SEM Daily Briefing — 19 May 2026
Table of Contents
Market Snapshot
| Metric | Value |
|---|---|
| Mean DAM Price | €120.05/MWh |
| Median Price | €118.04/MWh |
| Std Dev | €22.14/MWh |
| Peak Price | €161.09/MWh (21:00) |
| Min Price | €90.63/MWh (14:00) |
| Price Range | €70.46/MWh |
| Periods above €150 | 8 of 48 (17%) |
| Periods above €200 | 0 of 48 (0%) |
| Peak Avg (07–22) | €123.92/MWh |
| Off-peak Avg (22–07) | €113.61/MWh |
| Peak/Off-Peak Spread | €10.31/MWh |
| Wind % of Demand | 45.4% |
| Wind Range | 36.6%–52.1% |
| Mean Demand | 4028 MW |
Price Profile #
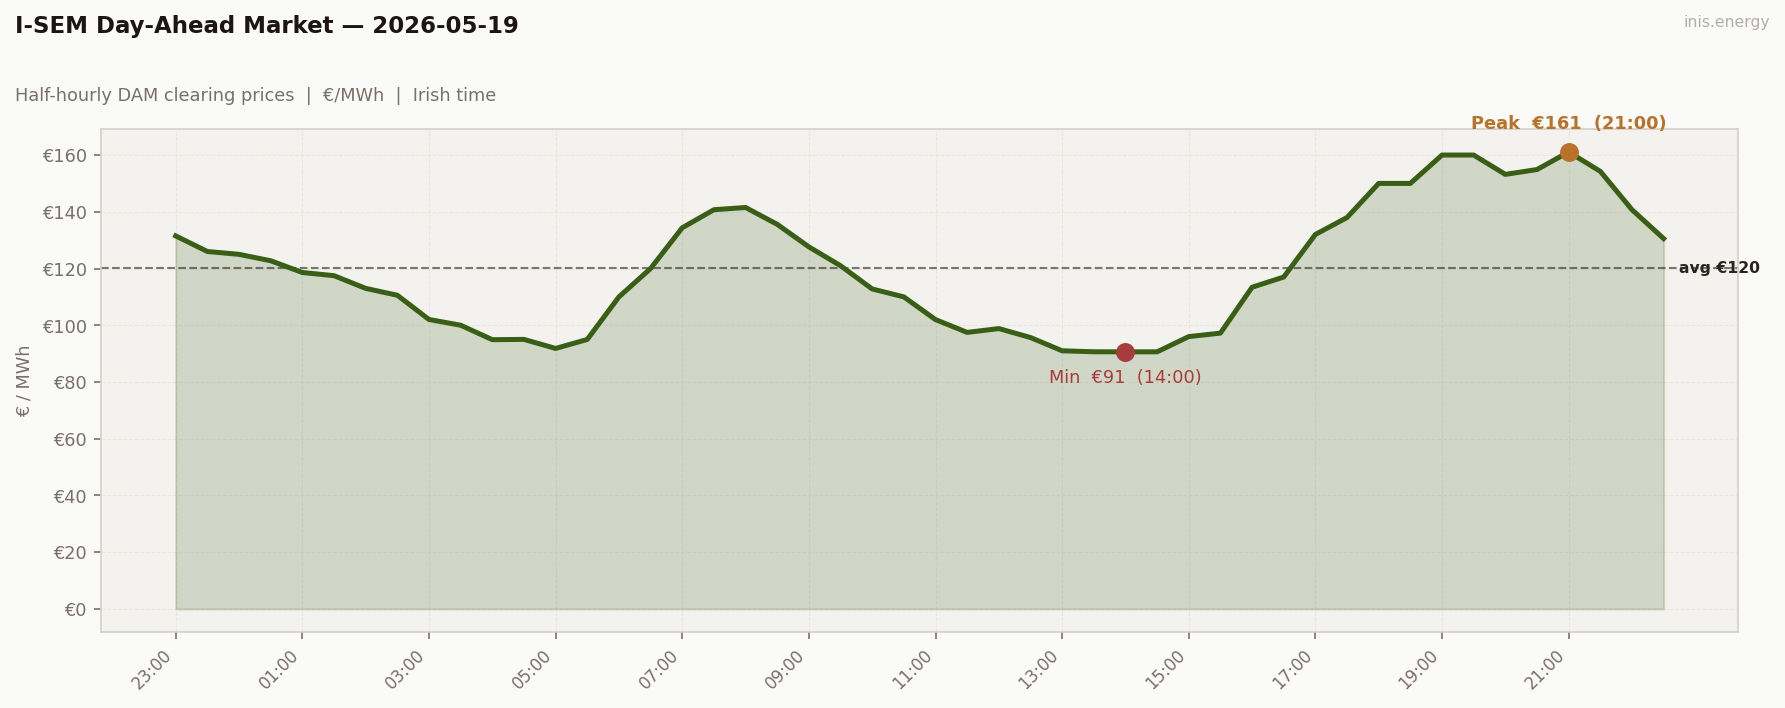
Std dev €22.14/MWh · Median €118.04/MWh · Periods above €150: 8 of 48 (17%)
The wind-rich working-day archetype, restored. Soft overnight floor, contained morning ramp, wide and deep midday trough, conventional evening peak. The whole day below €165.
Soft overnight (23:00 → 05:30): €92–132. Wind held 45–52% across the entire overnight window. The period minimum (€91.82 at 05:00, wind 52%) is the lowest early-morning price of the working-day run. With renewables providing nearly half of a modest overnight load, the marginal plant moved down toward CCGT-at-low-load.
Contained morning ramp (06:00 → 08:00): €110 → €120 → €134 → €141 → €142. €32 added in two hours, capping at €142 — €113 below yesterday’s €255 at 07:30. Wind held 38–50% through the ramp window. With wind providing 40%+ during a 4,028 MW morning, the merit order found mid-merit gas throughout and never approached peakers.
Wide and deep midday belly (10:00 → 16:00): €113 → €110 → €102 → €97 → €98 → €96 → €91 → €91 → €91 → €91 → €96 → €97. Six consecutive half-hours below €100 from 12:30 to 15:00, wind holding 49–52%. Floor at €90.63 at 14:00 — the lowest working-day price of the entire run. Wind surplus into a wind-saturated marginal plant at its daily demand low.
Conventional evening peak (16:00 → 21:30): €113 → €132 → €150 → €160 → €161 → €154 → €161 → €154 → €141. Cap at €161 at 21:00. Wind eased from 45% at 16:00 to 39% at 19:00, then climbed back to 47% by 22:00. Wind held through enough of the evening to prevent any scarcity; the whole peak block cleared below €165.
Price vs Wind #
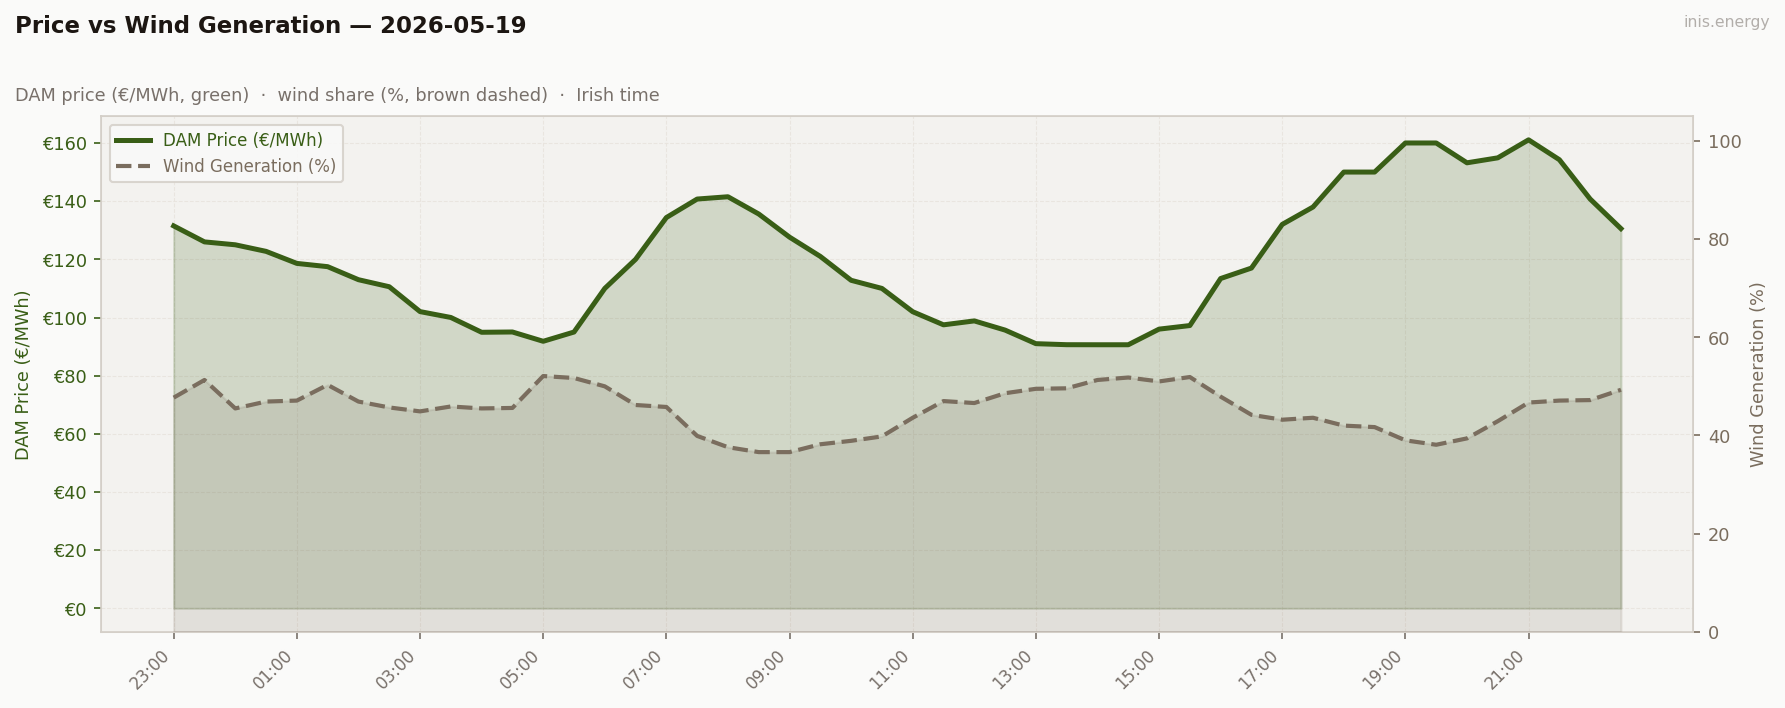
Mean wind: 45.4% · Range: 36.6%–52.1%
Wind 36.6%–52.1%, mean 45.4%. A 16-point range — the narrowest of the 17-day run. No significant intra-day decay or surge; wind was essentially flat from start to finish.
Wind’s capture price today sits close to the daily mean. With no extreme low-wind periods to miss and no high-wind surplus to cannibalise, the intra-day spread is small. This is the structural baseline: wind generating in rough proportion to its daily average across all 48 periods.
Worth the observation: today’s wind profile is what an annual capacity factor calculation assumes is the norm. It isn’t. Most days in this run had wind range 30+ percentage points; the 16-point band here is anomalously stable. The May 5 and May 18 scarcity events and the May 13 surplus day are all products of intra-day variability that an annual-mean model cannot see.
Week in Context #
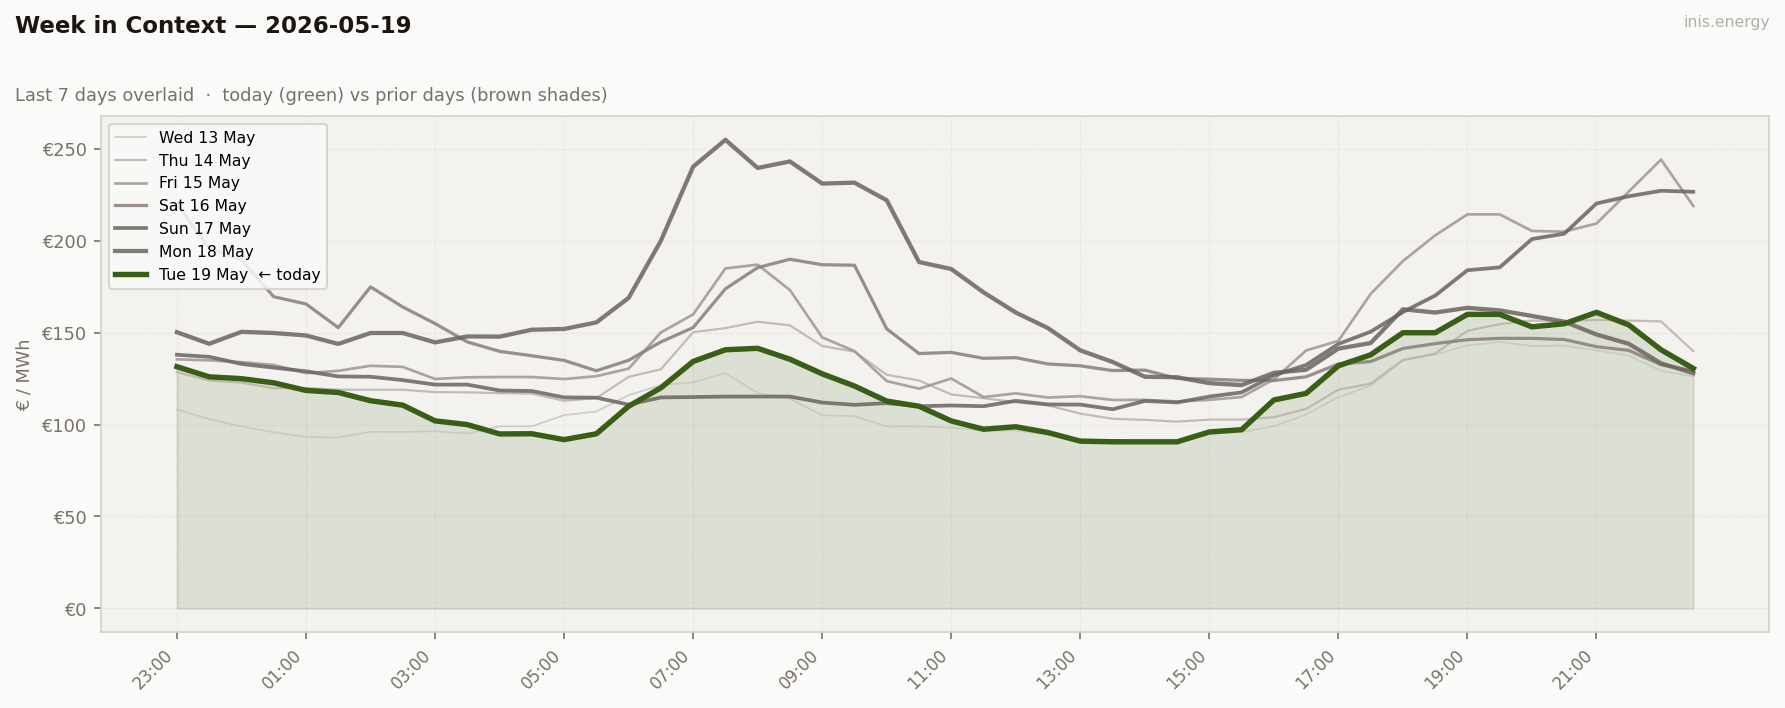
The Monday-to-Tuesday swing is the cleanest wind sensitivity reading of the week. Demand: Monday 4,036 MW → Tuesday 4,028 MW (flat). Wind mean: 25.0% → 45.4%. Price mean: €162.73 → €120.05. The €43 swing is entirely wind.
For scale: May 5 (Tuesday) ran 8.5% mean wind at 3,940 MW demand for €174 mean. Today ran 45.4% mean wind at 4,028 MW for €120 mean. Similar demand, 37 percentage points more wind, €54 cheaper. Pin the Mon-Tue swing (20pp wind gain, €43/MWh removed) against the May 5–May 19 comparison (37pp wind, €54/MWh removed) and the curve flattens as you move up the wind distribution — diminishing merit-order returns above 40% penetration. The incremental value of each additional percentage point of wind keeps declining the more you already have.
Price Duration Curve #
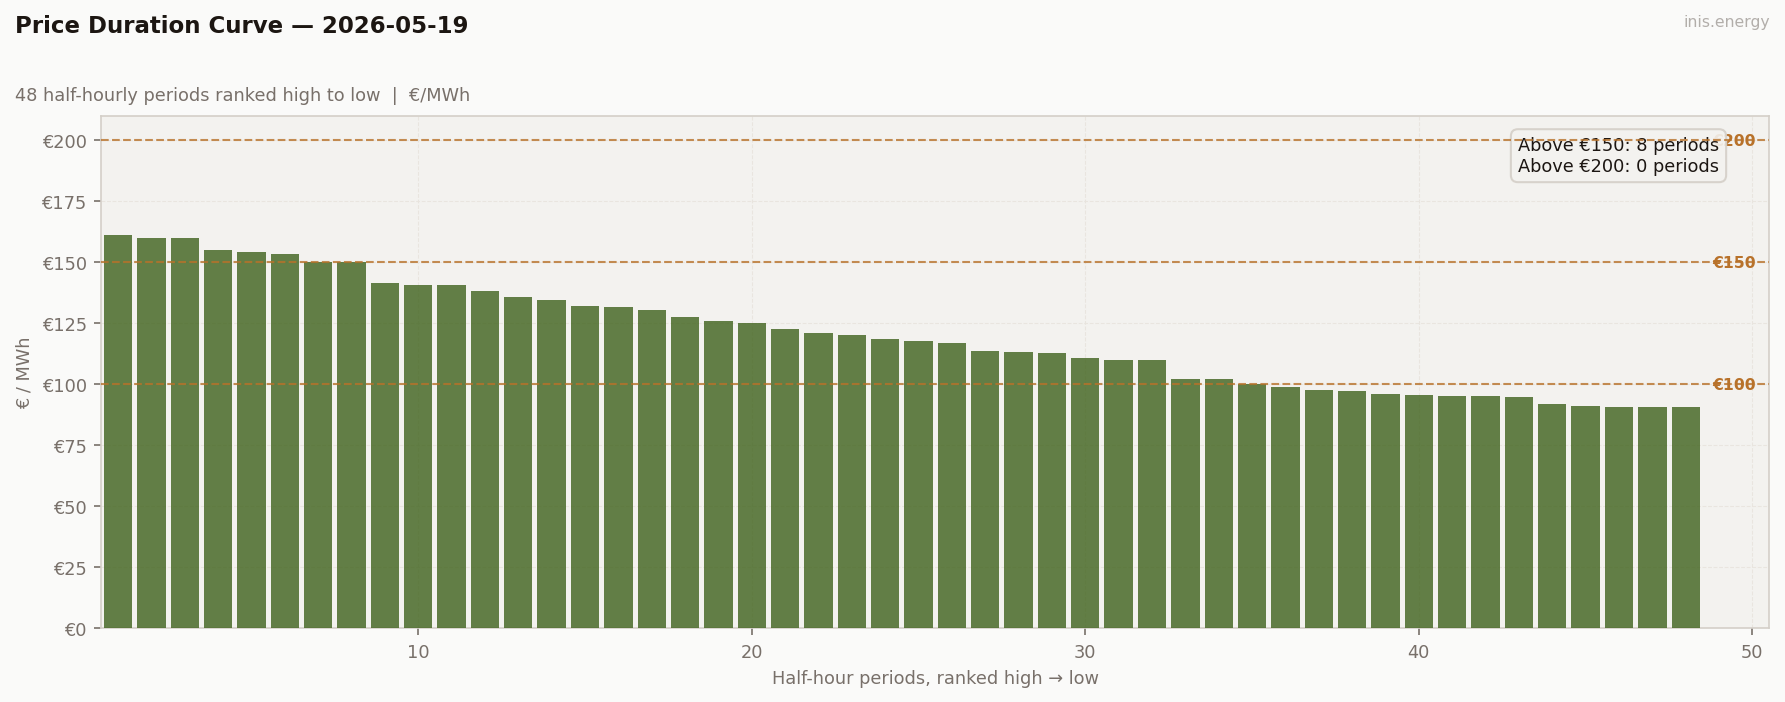
Periods above €150: 8 (17% of day) · Above €200: 0 (0% of day)
8 above €150, 0 above €200. A modest top shoulder (the evening peak block, 8 periods €150–161), a long broad middle (roughly 25 periods between €110–140), and a substantial cheap tail (15 periods between €91–110).
Visually close to May 13’s flat-and-low curve, but lifted ~€10/MWh across the board and with a more pronounced top shoulder. Today had enough demand-vs-wind tension in the evening to produce a real peak structure; May 13’s 60% wind suppressed even that. The “BESS-friendly modest day” shape: a wide trough-to-peak spread (€71), no scarcity, a clean conventional capture opportunity.
Peak / Off-Peak Spread #
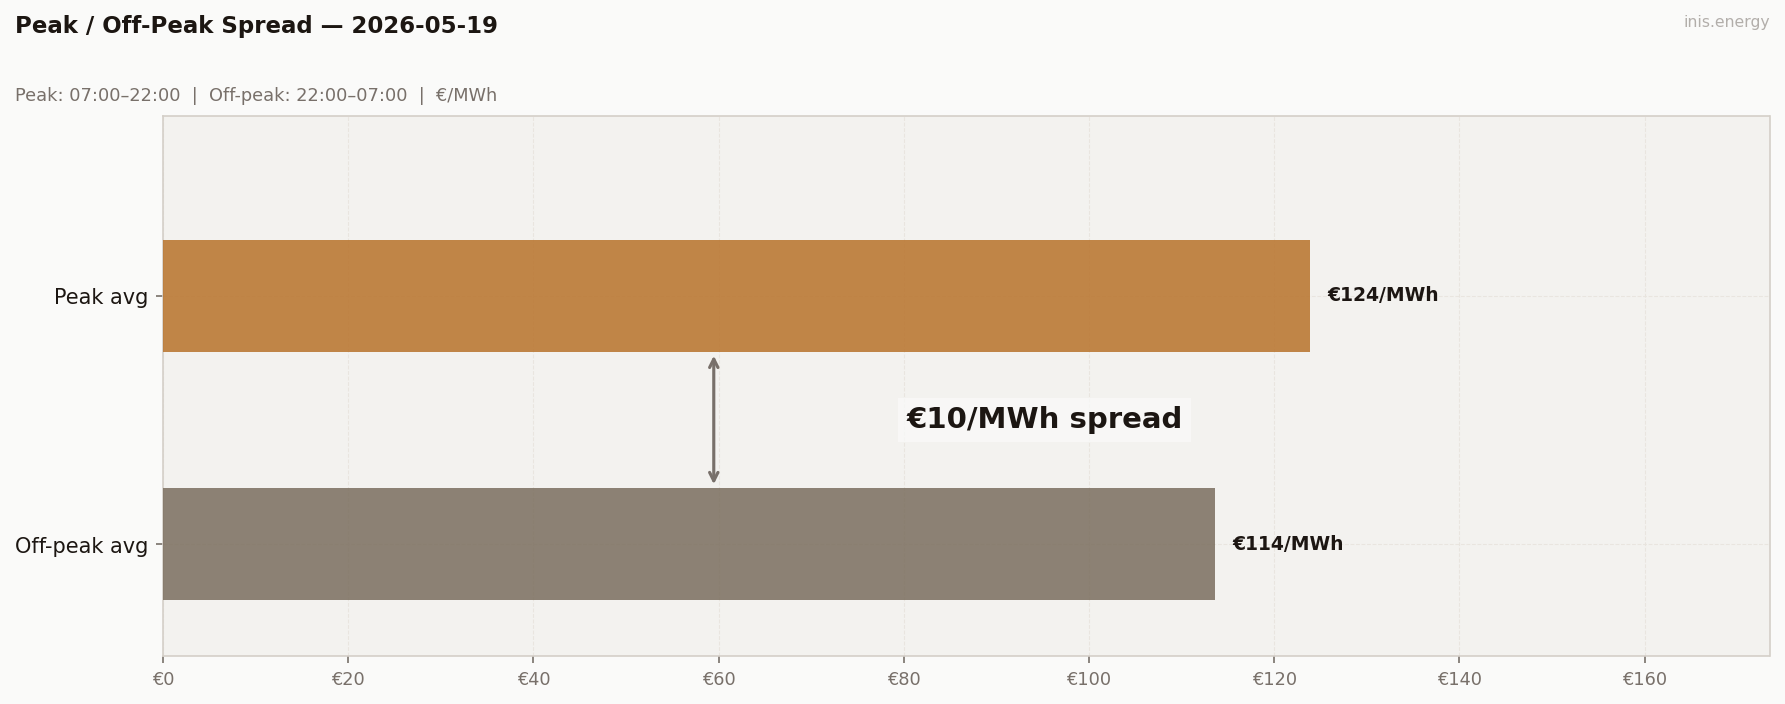
Peak avg (07:00–22:00): €123.92/MWh · Off-peak avg: €113.61/MWh · Spread: €10.31/MWh
+€10.31. Back to a small, functioning positive spread after Monday’s €18.85.
Both windows are cheaper: the peak window no longer contains morning scarcity, and the off-peak window has fallen back to a normal wind-rich overnight floor. The spread of €10.31 sits below round-trip efficiency break-even for a theoretical peak/off-peak trade — but the actual captured spread (€67) is six times the peak/off-peak metric. The metric is a coarse instrument and understates the dispatch opportunity whenever the day has a genuine intra-day shape, which today did.
BESS Dispatch Signal #
| Price | Time | Energy | Value | |
|---|---|---|---|---|
| Charge | €91/MWh | 13:00 | 2 MWh | −€181 |
| Discharge | €157/MWh | 19:30 | 1.7 MWh (85% RTE) | +€267 |
| Gross profit | €86 | |||
| Price spread | €67/MWh | ROI: 47.4% |
Simulated 1MW/2MWh battery, one optimal DAM cycle. Gross before network charges and capacity costs.
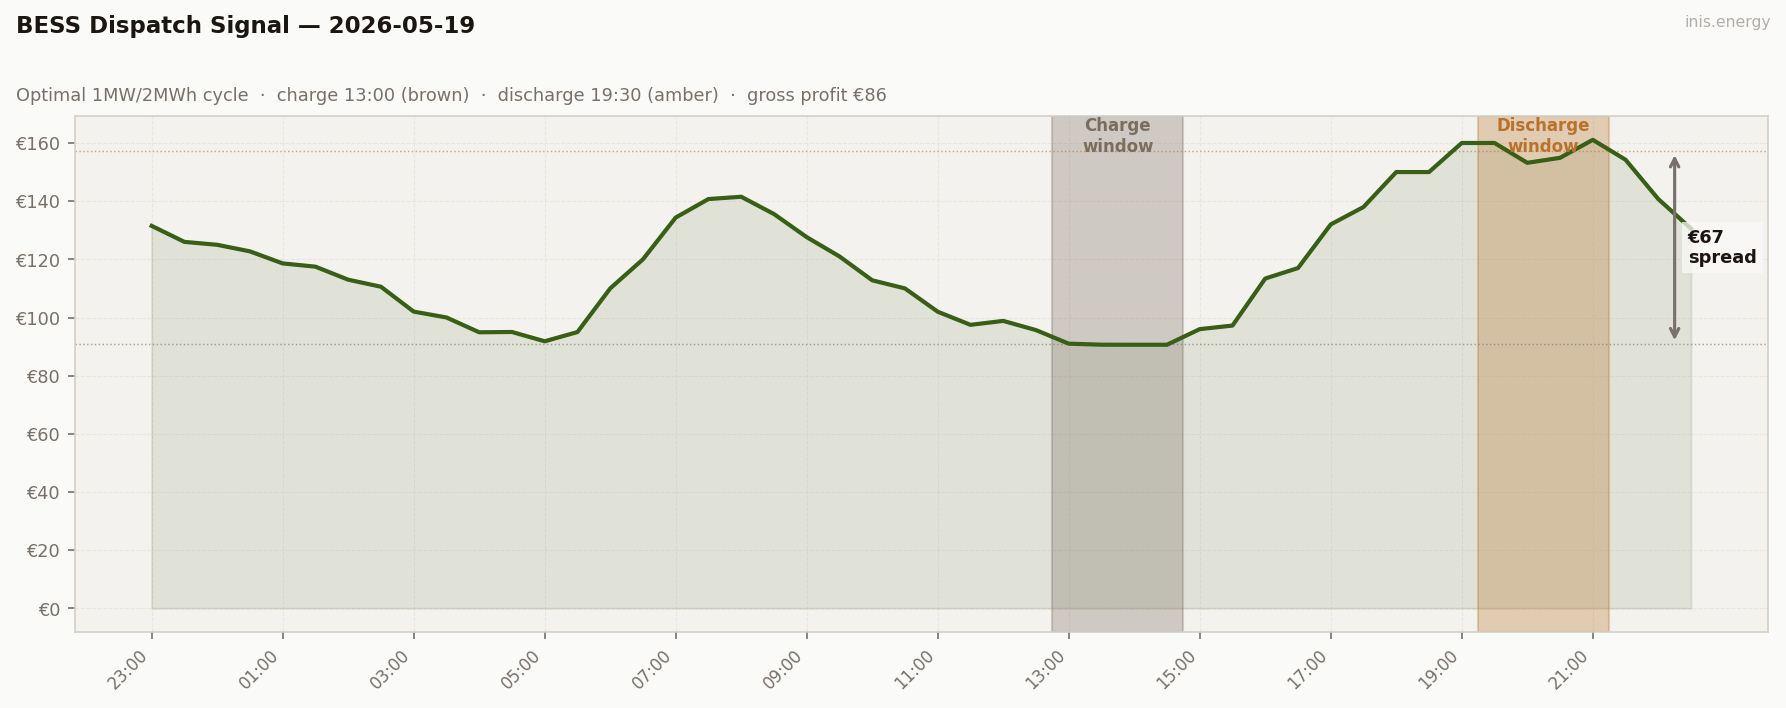
€86 gross — back to the wind-rich-working-day range. Charged at 13:00 (€91, the deep midday belly), discharged at 19:30 (€157, the evening peak). Captured spread €67, ROI 47.4%. The conventional dispatch pattern fully restored: midday charge, evening discharge, standard working-day shape.
The May 11–14 wind-rich working week produced €107, €77, €61, €61. Today’s €86 lands in the middle of that range — the wind regime has reset and the BESS pattern resets with it.
Commentary #
Wind returned. Tuesday’s mean of €120.05/MWh is €43 below Monday’s €162.73 — almost exactly back to the wind-rich working-day level of last week. Demand was essentially unchanged (4,028 vs 4,036 MW), so the entire €43 swing is wind: 20 additional percentage points of capacity removed €43/MWh from the clearing price. The convex curve is symmetric. On the way down from May 14 to May 15, losing 37 percentage points added €23/MWh. On the way back up from May 18 to May 19, gaining 20 percentage points removed €43/MWh. Wind sensitivity is non-linear, and Tuesday gave the cleanest within-week reading of the slope at this part of the curve.
The day’s structure is the wind-rich working-day archetype in clean form: a soft overnight floor (€92–132, wind holding 45–52%), a contained morning ramp capping at €142 (€113 below yesterday’s €255), a wide and deep midday belly with six consecutive periods below €100 and a €90.63 floor at 14:00 (the lowest working-day price of the entire run), a conventional evening peak capping at €161. Every structural feature of a weekday market is visible, but each is dialled back — the merit order finds mid-merit gas comfortably across all 48 half-hours. Worth flagging: today’s wind profile, with its 16-point range, is what an annual capacity factor calculation assumes is the norm. It is not the norm. Most days in this run had wind range 30+ percentage points. Annual planning that models from mean wind profiles understates exposure to both the May 15/18 scarcity days and the May 13 surplus days simultaneously.
For storage, €86 gross — firmly in the wind-rich-working-day range. Charged in the midday belly (€91 at 13:00), discharged into the 19:30 evening peak (€157). Whatever a real operator pays for forecast skill on the days that matter, it’s worth more than perfect dispatch on all the calm ones combined.
Half-hourly data — 2026-05-19
| Period | Time | Price (€/MWh) | Wind % |
|---|---|---|---|
| 1 | 23:00 | 131.50 | 47.7% |
| 2 | 23:30 | 126.00 | 51.3% |
| 3 | 00:00 | 125.00 | 45.5% |
| 4 | 00:30 | 122.74 | 46.9% |
| 5 | 01:00 | 118.60 | 47.1% |
| 6 | 01:30 | 117.48 | 50.3% |
| 7 | 02:00 | 113.00 | 46.9% |
| 8 | 02:30 | 110.58 | 45.7% |
| 9 | 03:00 | 102.03 | 44.9% |
| 10 | 03:30 | 100.01 | 45.9% |
| 11 | 04:00 | 94.92 | 45.5% |
| 12 | 04:30 | 95.02 | 45.6% |
| 13 | 05:00 | 91.82 | 52.1% |
| 14 | 05:30 | 95.00 | 51.7% |
| 15 | 06:00 | 110.00 | 50.0% |
| 16 | 06:30 | 120.00 | 46.2% |
| 17 | 07:00 | 134.37 | 45.8% |
| 18 | 07:30 | 140.73 | 39.9% |
| 19 | 08:00 | 141.52 | 37.6% |
| 20 | 08:30 | 135.58 | 36.6% |
| 21 | 09:00 | 127.63 | 36.6% |
| 22 | 09:30 | 121.00 | 38.2% |
| 23 | 10:00 | 112.79 | 38.9% |
| 24 | 10:30 | 110.00 | 39.8% |
| 25 | 11:00 | 101.99 | 43.6% |
| 26 | 11:30 | 97.48 | 47.0% |
| 27 | 12:00 | 98.83 | 46.6% |
| 28 | 12:30 | 95.67 | 48.6% |
| 29 | 13:00 | 91.00 | 49.5% |
| 30 | 13:30 | 90.65 | 49.6% |
| 31 | 14:00 | 90.63 | 51.3% |
| 32 | 14:30 | 90.63 | 51.8% |
| 33 | 15:00 | 96.00 | 51.0% |
| 34 | 15:30 | 97.23 | 51.9% |
| 35 | 16:00 | 113.40 | 47.9% |
| 36 | 16:30 | 117.00 | 44.2% |
| 37 | 17:00 | 132.01 | 43.2% |
| 38 | 17:30 | 137.99 | 43.6% |
| 39 | 18:00 | 150.01 | 42.0% |
| 40 | 18:30 | 150.01 | 41.7% |
| 41 | 19:00 | 160.01 | 39.0% |
| 42 | 19:30 | 160.01 | 38.1% |
| 43 | 20:00 | 153.19 | 39.4% |
| 44 | 20:30 | 154.90 | 42.9% |
| 45 | 21:00 | 161.09 | 46.7% |
| 46 | 21:30 | 154.26 | 47.1% |
| 47 | 22:00 | 140.74 | 47.2% |
| 48 | 22:30 | 130.56 | 49.3% |
Compare your business electricity and gas rates in minutes with INIS Energy Brokers.
Compare rates