I-SEM Daily Briefing — 20 May 2026
Table of Contents
Market Snapshot
| Metric | Value |
|---|---|
| Mean DAM Price | €127.94/MWh |
| Median Price | €115.46/MWh |
| Std Dev | €26.71/MWh |
| Peak Price | €184.52/MWh (21:00) |
| Min Price | €100.0/MWh (13:30) |
| Price Range | €84.52/MWh |
| Periods above €150 | 11 of 48 (23%) |
| Periods above €200 | 0 of 48 (0%) |
| Peak Avg (07–22) | €135.04/MWh |
| Off-peak Avg (22–07) | €116.1/MWh |
| Peak/Off-Peak Spread | €18.94/MWh |
| Wind % of Demand | 42.2% |
| Wind Range | 27.0%–61.7% |
| Mean Demand | 3985 MW |
Price Profile #
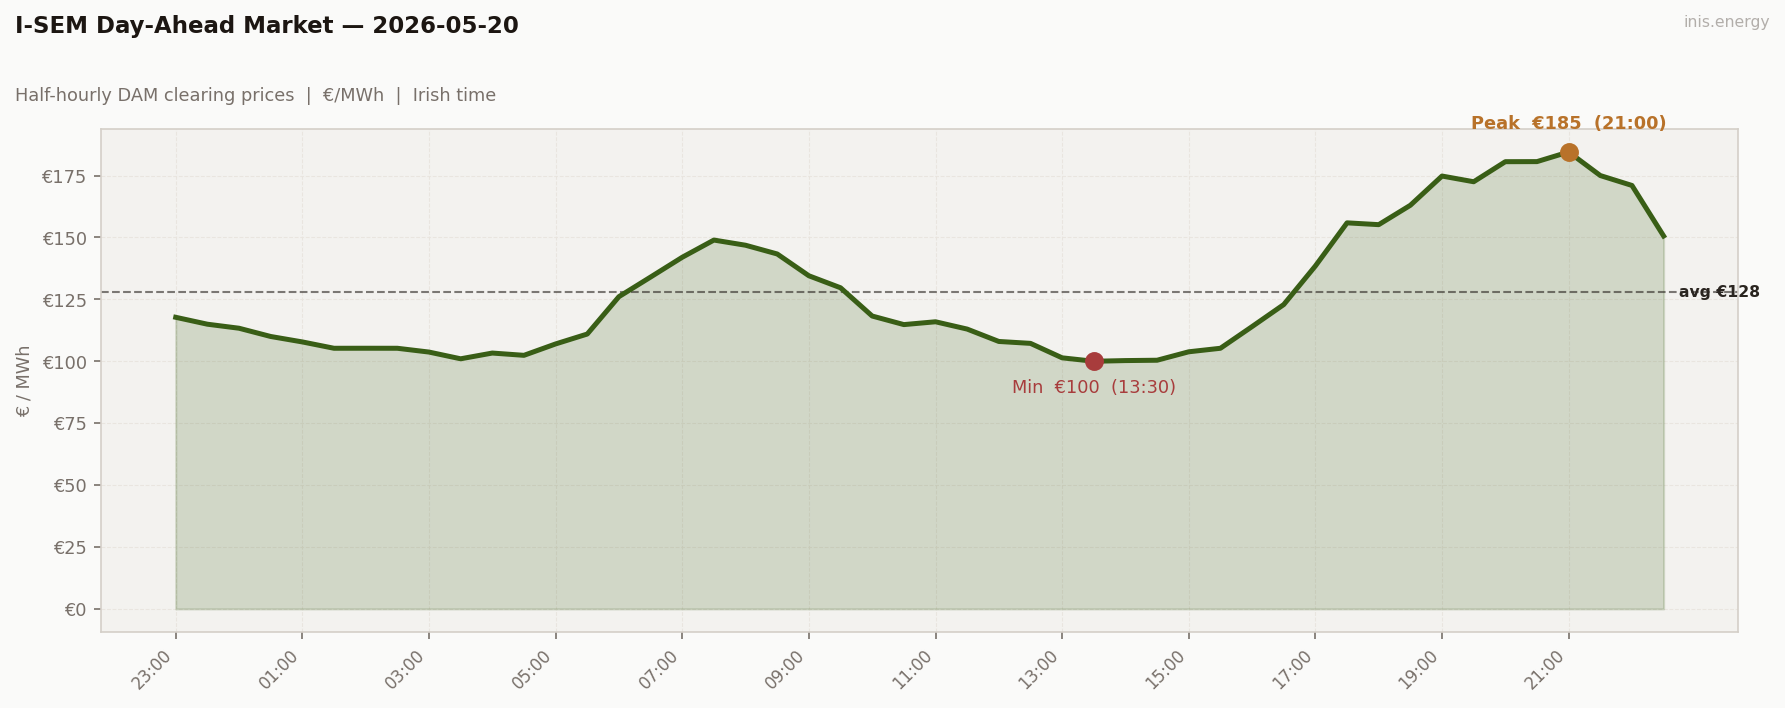
Std dev €26.71/MWh · Median €115.46/MWh · Periods above €150: 11 of 48 (23%)
A proper wind day finally lands. Mean €127.94, down €9 from May 19, and the day delivers the deepest midday trough of the run so far at €100.00 at 13:30.
The shape is the classic working-day W of overnight floor → morning ramp → midday belly → evening peak. Overnight ran €100–118 with wind at 55–62%. The morning ramp climbs from 06:00 (€126) → 07:30 (€149): +€23 in 90 minutes — gentle by recent standards, because wind was still 51% at the ramp start. The midday belly settled €100–115 from 10:30 to 15:30, and that trough is the structural feature of the day: 8 consecutive periods under €110, all of them during high-30s wind.
Then the second leg, and this is the day’s real story: the climb from €114 at 16:00 to €184.52 at 21:00. That’s +€70 in 2.5 hours, every half-hour tracking the wind decline (36% → 27%). The peak finally sat at €184.52 — meaningful but contained, no scarcity prints.
11 of 48 periods cleared above €150; zero above €200.
Price vs Wind #
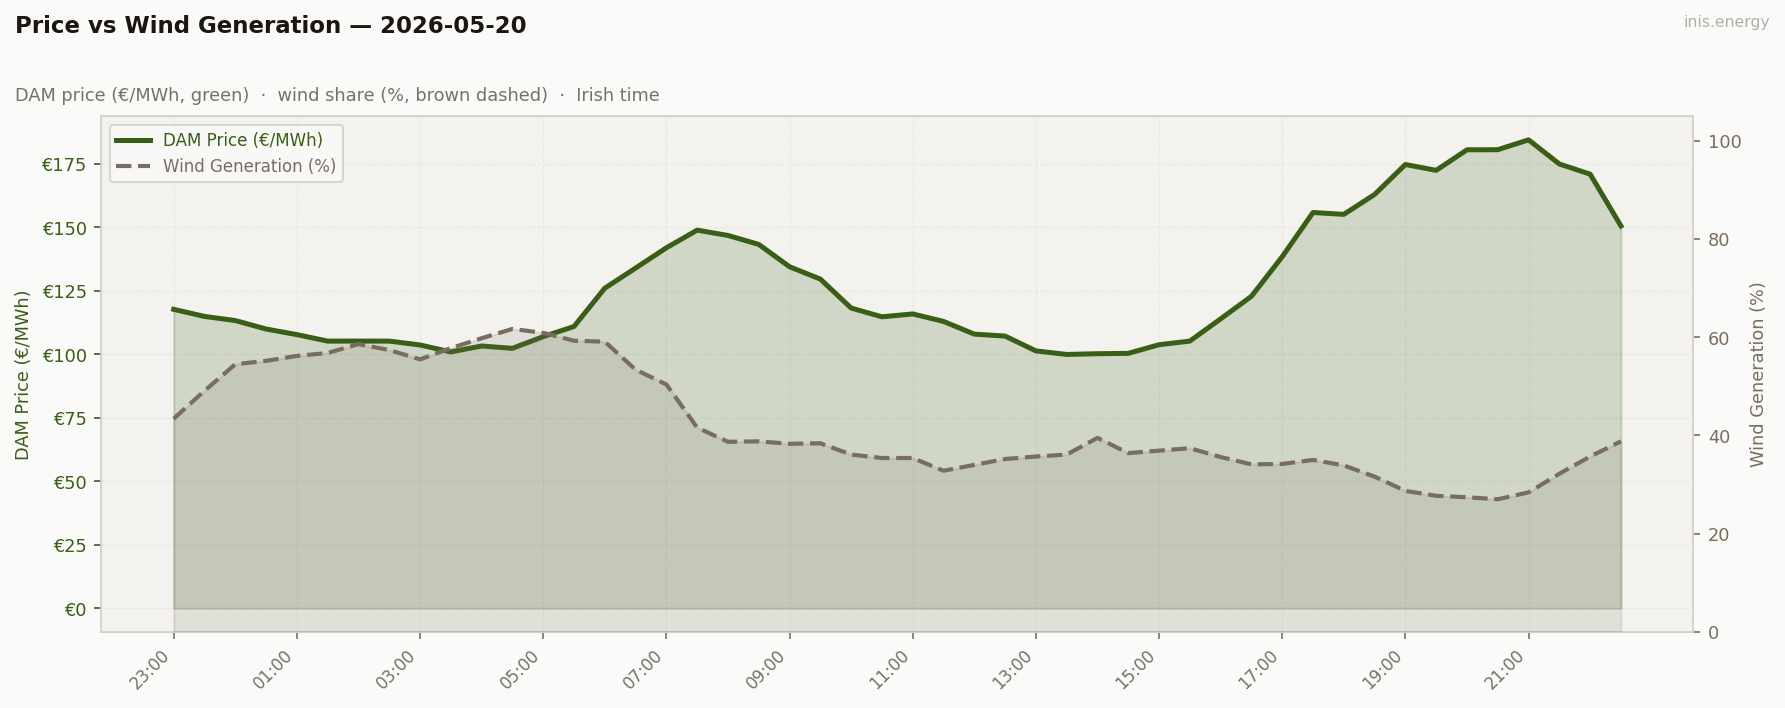
Mean wind: 42.2% · Range: 27.0%–61.7%
A textbook wind shortfall day for renewables — and we should define that.
A wind shortfall is the structural cousin of cannibalisation. Cannibalisation is when wind generates too much during low-demand hours and crushes its own price. A shortfall is when wind generates too little during high-demand hours and lets gas set the clearing price. Both are timing problems. Cannibalisation is wind being early; shortfall is wind being late.
Today’s wind shape was a textbook shortfall. Wind peaked at 61.7% at 04:30 — overnight, when demand was at its lowest and there was nothing to do with it. It then drained steadily through the morning and afternoon, bottoming at 27.0% at 20:30 — exactly when the evening peak hit. The 25-percentage-point wind decline from midday to the peak is what produced the €70 evening climb.
For wind generators, the capture price today probably ran below the daily mean — wind sold most of its MWh into the cheap overnight hours and almost none into the dear evening ones. The cannibalisation problem in its standard direction, after May 5’s reversal. Two faces of the same timing coin.
Week in Context #
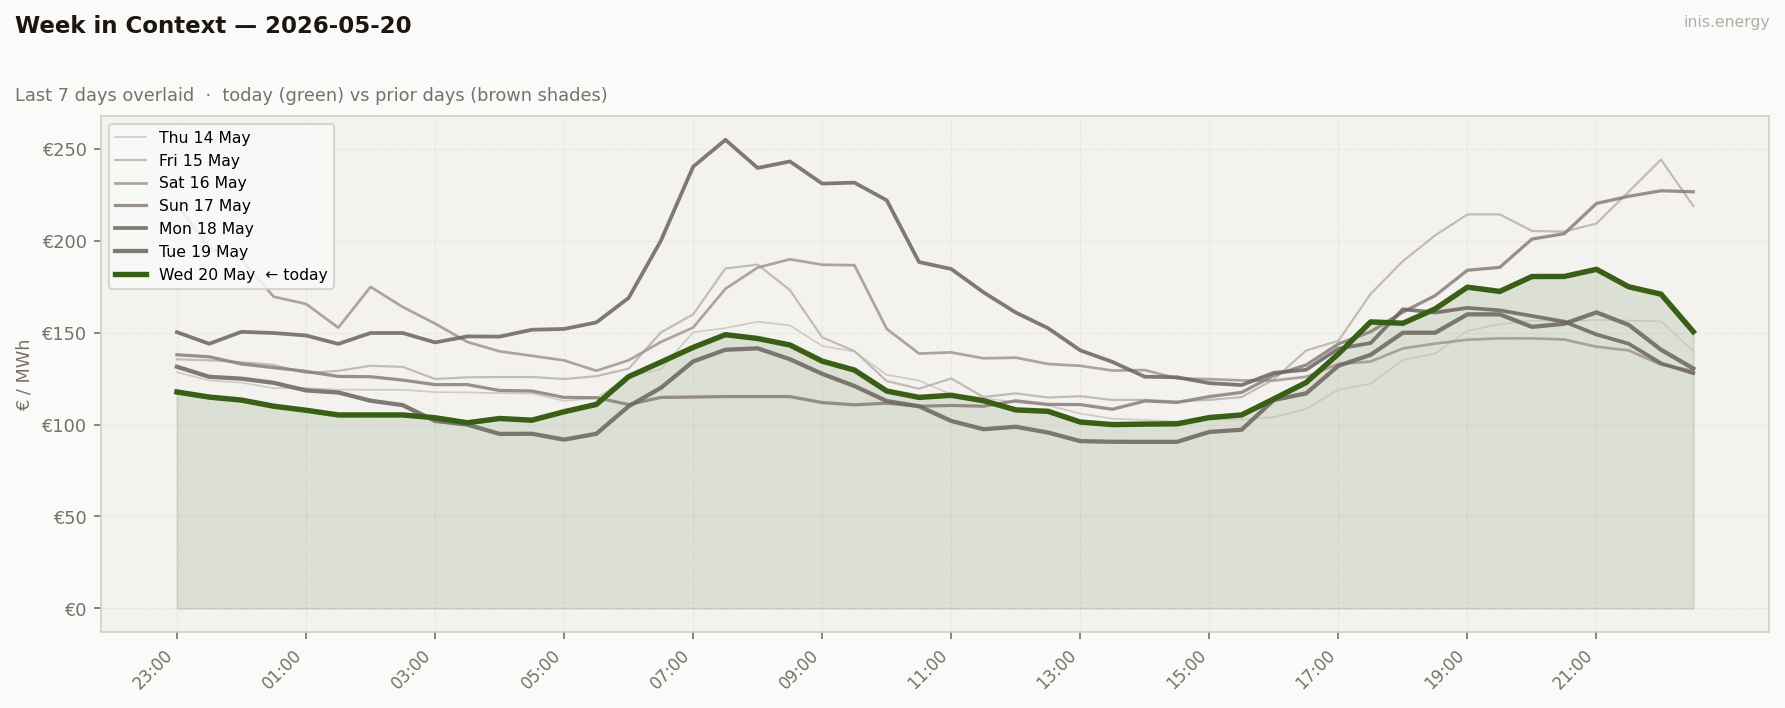
Today’s structural cousin in the recent run is May 11 — also a working day with mean €120–130, also a deep midday trough, also a contained evening peak. The W-shape is the wind-rich working-day archetype, and the week is settling back into it after the May 17/18 scarcity cluster.
Price Duration Curve #
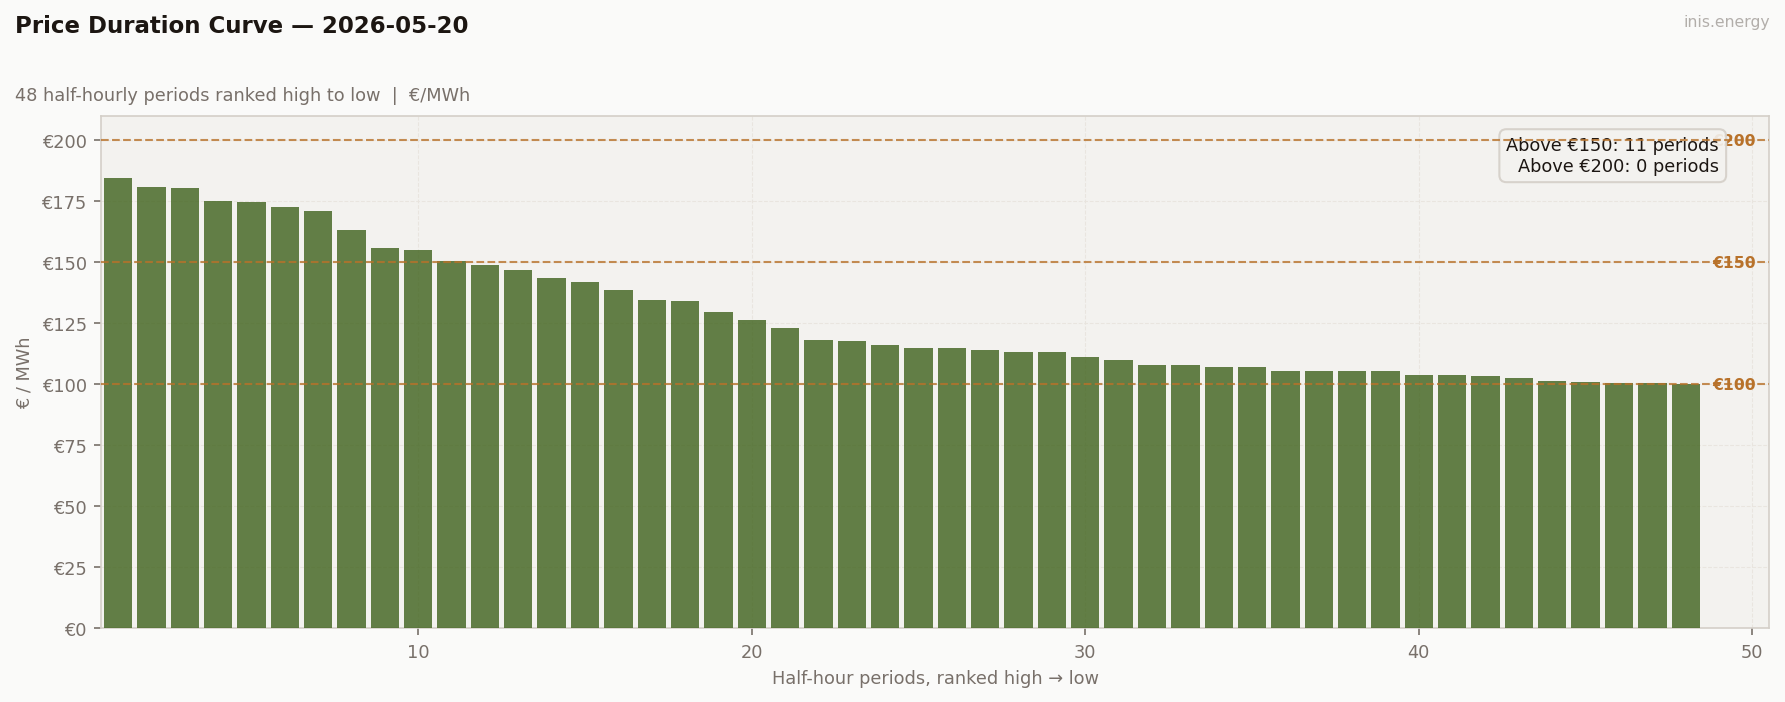
Periods above €150: 11 (23% of day) · Above €200: 0 (0% of day)
This is the “BESS-friendly modest day” archetype again — not the explosive scarcity of May 17/18 (where the curve had a sharp top plateau), and not the flat-and-low of May 13 (where there was nothing to arbitrage against). Today’s PDC has a real top shoulder and a real cheap trough: the top 4 periods average €178, the bottom 4 average €101. A €78 gap visible directly on the curve.
The shape that pays a battery is the steep one, and today’s is mid-steep — enough to support a clean cycle, not enough to deliver a top-decile day.
Peak / Off-Peak Spread #
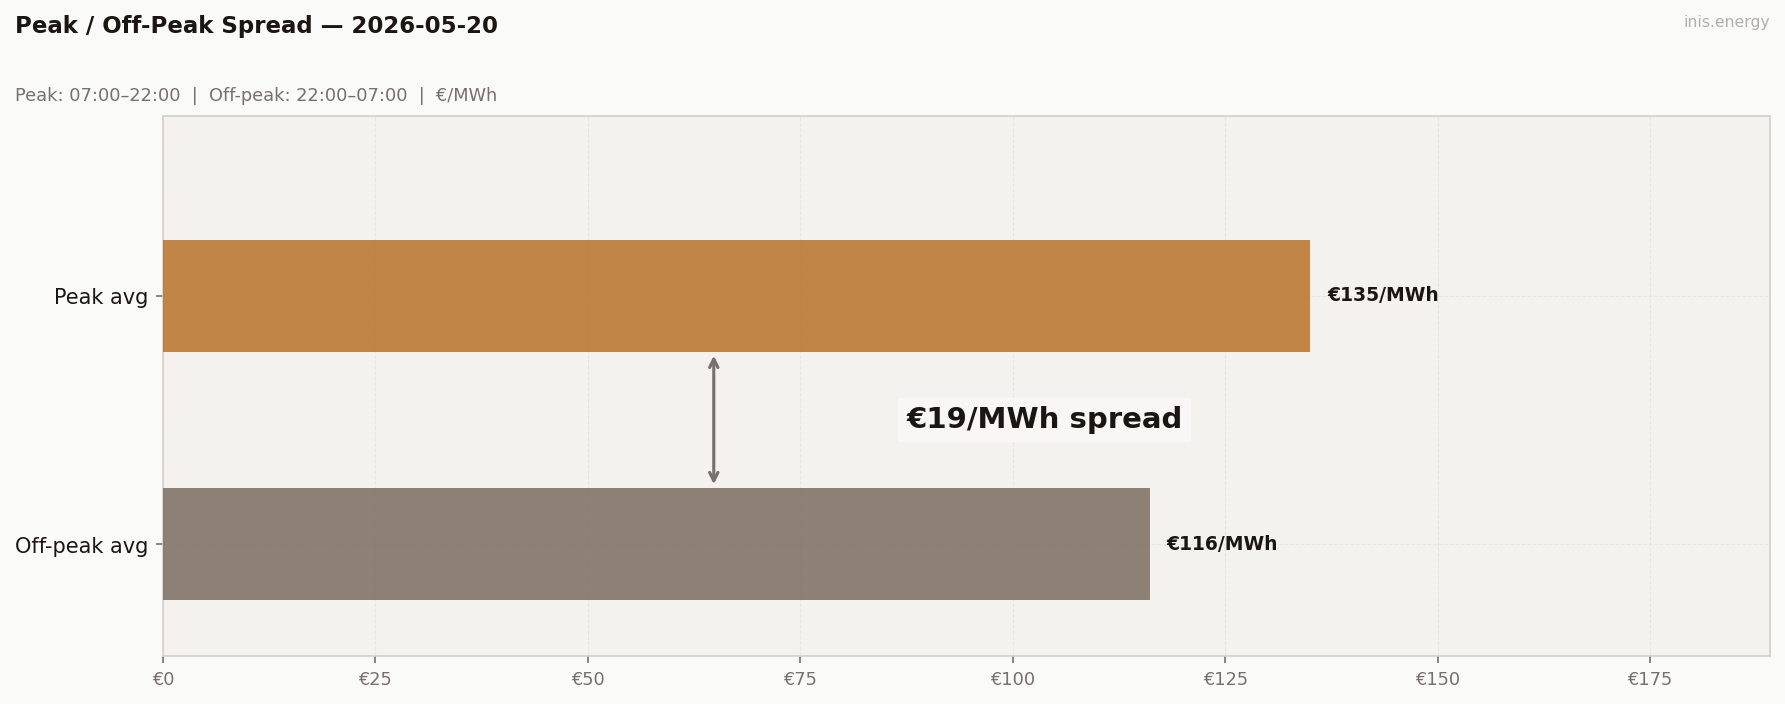
Peak avg (07:00–22:00): €135.04/MWh · Off-peak avg: €116.1/MWh · Spread: €18.94/MWh
Spread €18.94 — modest in absolute terms, but with a structurally different shape than the recent compressed-spread days.
The May 5 spread of €20.93 had a high floor (€161 off-peak avg) and brief peaks. Today’s €18.94 sits on top of a low floor (€116 off-peak avg) and a moderate peak (€135). Same headline number, opposite anatomy. Today, finally, there’s a cheap off-peak window to charge against — the prerequisite for any flexibility arbitrage.
The headline spread is €84.52 (peak minus min). The peak/off-peak average spread is €18.94. The captured spread the BESS actually earned on is €80. Three numbers, three meanings — and today they finally align in the right order. The headline and the captured spread move together because the day has a real shape rather than a sustained plateau.
BESS Dispatch Signal #
| Price | Time | Energy | Value | |
|---|---|---|---|---|
| Charge | €101/MWh | 13:00 | 2 MWh | −€201 |
| Discharge | €180/MWh | 20:00 | 1.7 MWh (85% RTE) | +€306 |
| Gross profit | €105 | |||
| Price spread | €80/MWh | ROI: 52.4% |
Simulated 1MW/2MWh battery, one optimal DAM cycle. Gross before network charges and capacity costs.
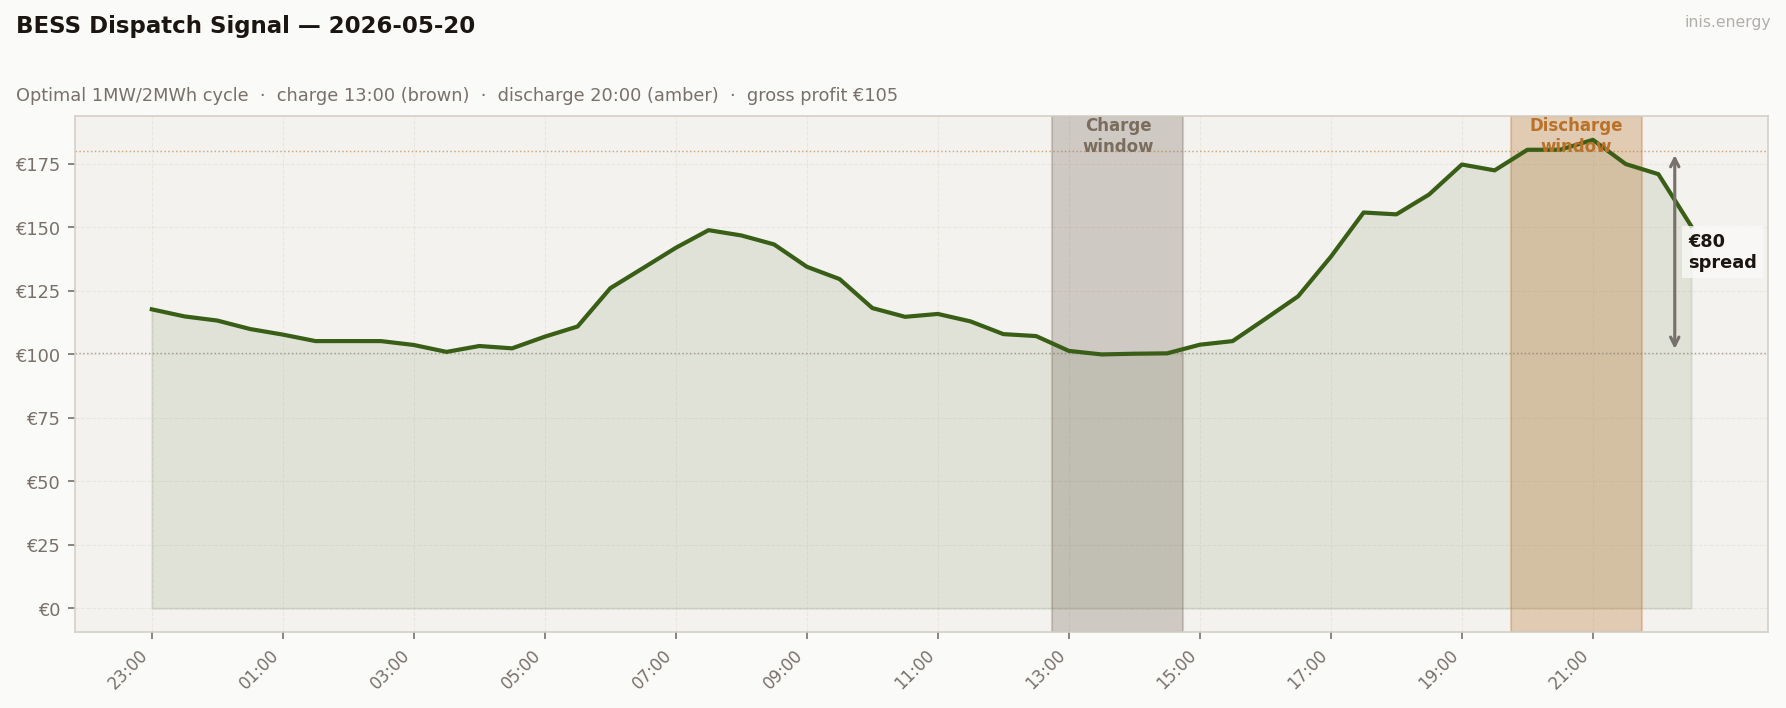
€105 gross — the best non-scarcity working-day BESS result of the run.
The dispatch logic chose midday charge (13:00–14:30 at €101 avg) for the third consecutive day. The wind-rich regime has made afternoon charging the default — back when wind ran 8–13%, the optimiser picked overnight charge windows; with wind comfortably above 35% mid-day, the cheapest 4 consecutive half-hours now reliably sit in the early afternoon. The charge-window choice is a wind-regime classifier, and it’s settled in the afternoon for several days now.
The discharge sits in the 20:00–21:30 evening block at €180 avg — the conventional evening pattern restored after May 18’s morning-discharge anomaly.
Captured spread €80, gross €105, ROI 52.4% on the €201 charge cost.
Commentary #
A real wind day with a real evening shortfall. Mean €127.94 dropped €9 from yesterday, and the floor reached €100.00 — the lowest working-day trough of the 17-day run. Wind held 55–62% overnight, drained steadily through the day, and bottomed at 27% during the evening peak. The result was the cleanest wind-shortfall shape of the working week so far: a soft floor, a deep midday belly, a sustained climb to €184 at 21:00.
For wind generators, a poor day in the conventional sense — most of the MWh sold into the cheap overnight hours, almost none into the dear evening peak. Capture price will sit below the daily mean. The classic cannibalisation problem, in its standard direction after May 5’s reversal.
For storage, the payday. A simulated 1MW/2MWh battery captured €80 of spread (€101 charge, €180 discharge), gross €105. The structural read: the mid-range BESS day — a 40%+ wind day with a real evening wind shortfall — is a reliable €100-day workhorse. The €150+ days come from scarcity events; the €100 days come from days like this. Both matter.
Half-hourly data — 2026-05-20
| Period | Time | Price (€/MWh) | Wind % |
|---|---|---|---|
| 1 | 23:00 | 117.76 | 43.4% |
| 2 | 23:30 | 114.97 | 49.1% |
| 3 | 00:00 | 113.34 | 54.5% |
| 4 | 00:30 | 110.01 | 55.2% |
| 5 | 01:00 | 107.81 | 56.2% |
| 6 | 01:30 | 105.25 | 56.8% |
| 7 | 02:00 | 105.26 | 58.6% |
| 8 | 02:30 | 105.25 | 57.4% |
| 9 | 03:00 | 103.72 | 55.5% |
| 10 | 03:30 | 101.00 | 57.8% |
| 11 | 04:00 | 103.32 | 59.8% |
| 12 | 04:30 | 102.40 | 61.7% |
| 13 | 05:00 | 107.00 | 60.9% |
| 14 | 05:30 | 111.00 | 59.3% |
| 15 | 06:00 | 126.09 | 59.1% |
| 16 | 06:30 | 134.01 | 53.4% |
| 17 | 07:00 | 142.00 | 50.4% |
| 18 | 07:30 | 148.95 | 41.6% |
| 19 | 08:00 | 146.86 | 38.7% |
| 20 | 08:30 | 143.33 | 38.8% |
| 21 | 09:00 | 134.53 | 38.3% |
| 22 | 09:30 | 129.68 | 38.4% |
| 23 | 10:00 | 118.27 | 36.1% |
| 24 | 10:30 | 114.81 | 35.4% |
| 25 | 11:00 | 115.95 | 35.4% |
| 26 | 11:30 | 113.00 | 32.8% |
| 27 | 12:00 | 108.00 | 34.0% |
| 28 | 12:30 | 107.23 | 35.2% |
| 29 | 13:00 | 101.39 | 35.7% |
| 30 | 13:30 | 100.00 | 36.1% |
| 31 | 14:00 | 100.28 | 39.5% |
| 32 | 14:30 | 100.42 | 36.4% |
| 33 | 15:00 | 103.83 | 36.9% |
| 34 | 15:30 | 105.25 | 37.4% |
| 35 | 16:00 | 114.01 | 35.6% |
| 36 | 16:30 | 122.90 | 34.1% |
| 37 | 17:00 | 138.49 | 34.2% |
| 38 | 17:30 | 155.90 | 35.0% |
| 39 | 18:00 | 155.17 | 33.9% |
| 40 | 18:30 | 163.00 | 31.6% |
| 41 | 19:00 | 174.80 | 28.7% |
| 42 | 19:30 | 172.50 | 27.7% |
| 43 | 20:00 | 180.60 | 27.4% |
| 44 | 20:30 | 180.63 | 27.0% |
| 45 | 21:00 | 184.52 | 28.4% |
| 46 | 21:30 | 175.00 | 32.2% |
| 47 | 22:00 | 171.00 | 35.7% |
| 48 | 22:30 | 150.60 | 38.8% |
Compare your business electricity and gas rates in minutes with INIS Energy Brokers.
Compare rates