I-SEM Daily Briefing — 21 May 2026
Table of Contents
Market Snapshot
| Metric | Value |
|---|---|
| Mean DAM Price | €136.98/MWh |
| Median Price | €132.96/MWh |
| Std Dev | €14.76/MWh |
| Peak Price | €165.75/MWh (20:00) |
| Min Price | €119.0/MWh (15:00) |
| Price Range | €46.75/MWh |
| Periods above €150 | 12 of 48 (25%) |
| Periods above €200 | 0 of 48 (0%) |
| Peak Avg (07–22) | €140.69/MWh |
| Off-peak Avg (22–07) | €130.8/MWh |
| Peak/Off-Peak Spread | €9.89/MWh |
| Wind % of Demand | 46.3% |
| Wind Range | 32.2%–61.7% |
| Mean Demand | 3981 MW |
Price Profile #
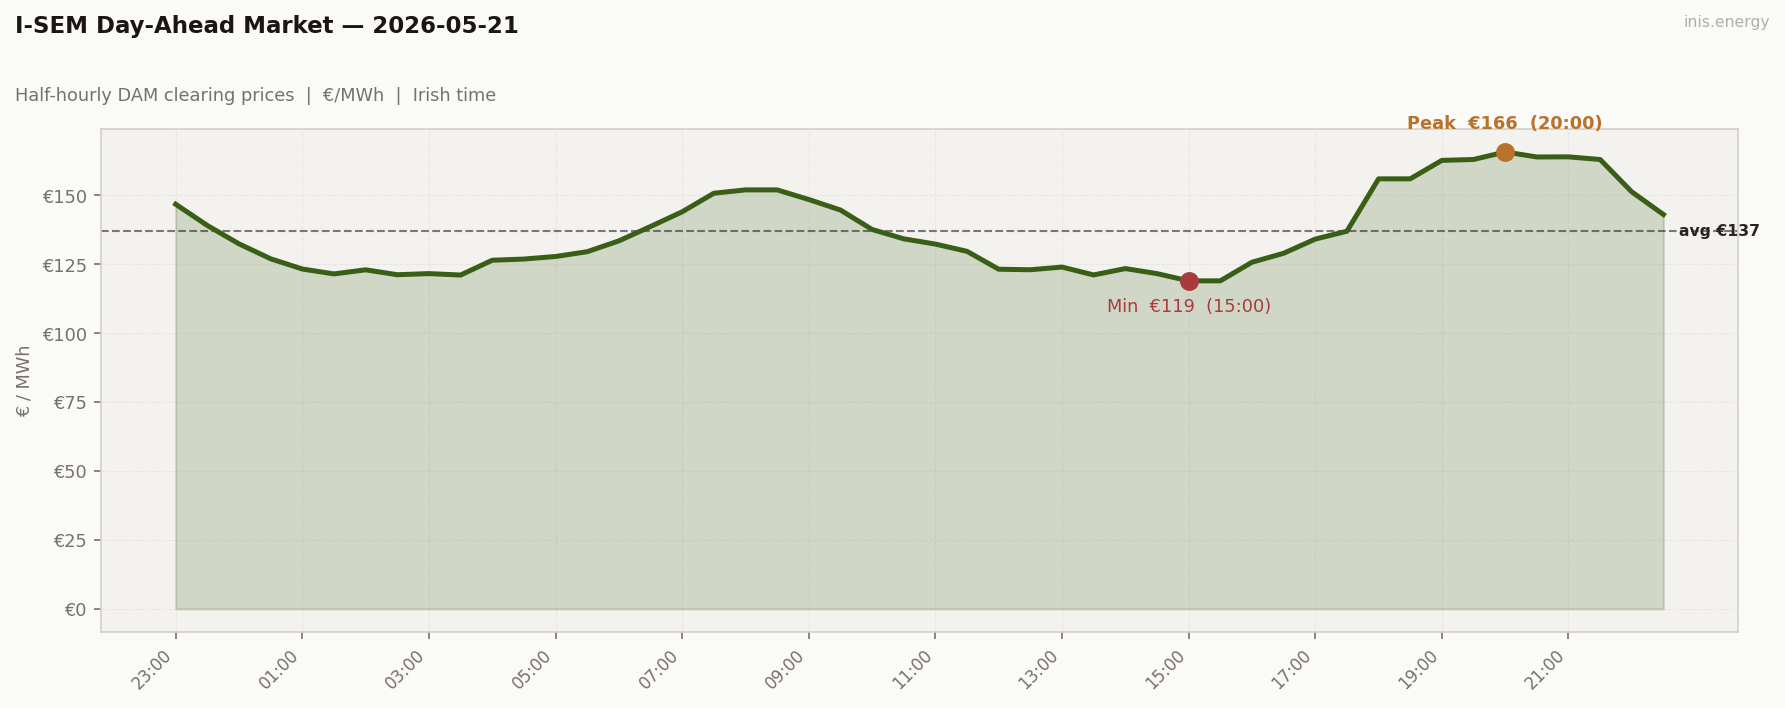
Std dev €14.76/MWh · Median €132.96/MWh · Periods above €150: 12 of 48 (25%)
A flat day. The flattest of the 19-day run, in fact.
Mean €136.98 is mid-range, but the volatility metrics all touched new lows: std dev €14.76, range €46.75, peak/off-peak spread €9.89. Every period sat between €119 and €166. No scarcity, no real trough.
The shape carries shape’s outline but none of its drama. Overnight ran €121–147 with wind at 52–62%. Morning ramp climbed €127 → €152 between 05:30 and 07:30 — present but modest. Midday belly held €119–148 from 09:00 to 15:30, with the floor at €119 at 15:00. Evening climb built from €126 at 16:00 to €166 at 20:00, then held — €163–166 across four consecutive hours from 19:00 to 21:30 before fading.
What’s notable is that plateau. Most evening peaks have a clear single-period top (May 20’s €184 at 21:00 was alone). Today’s evening peak runs at the same €165 level for eight half-hours. The merit order found its marginal plant for evening conditions and stayed there — no escalation, no scarcity, no peaker bids.
Price vs Wind #
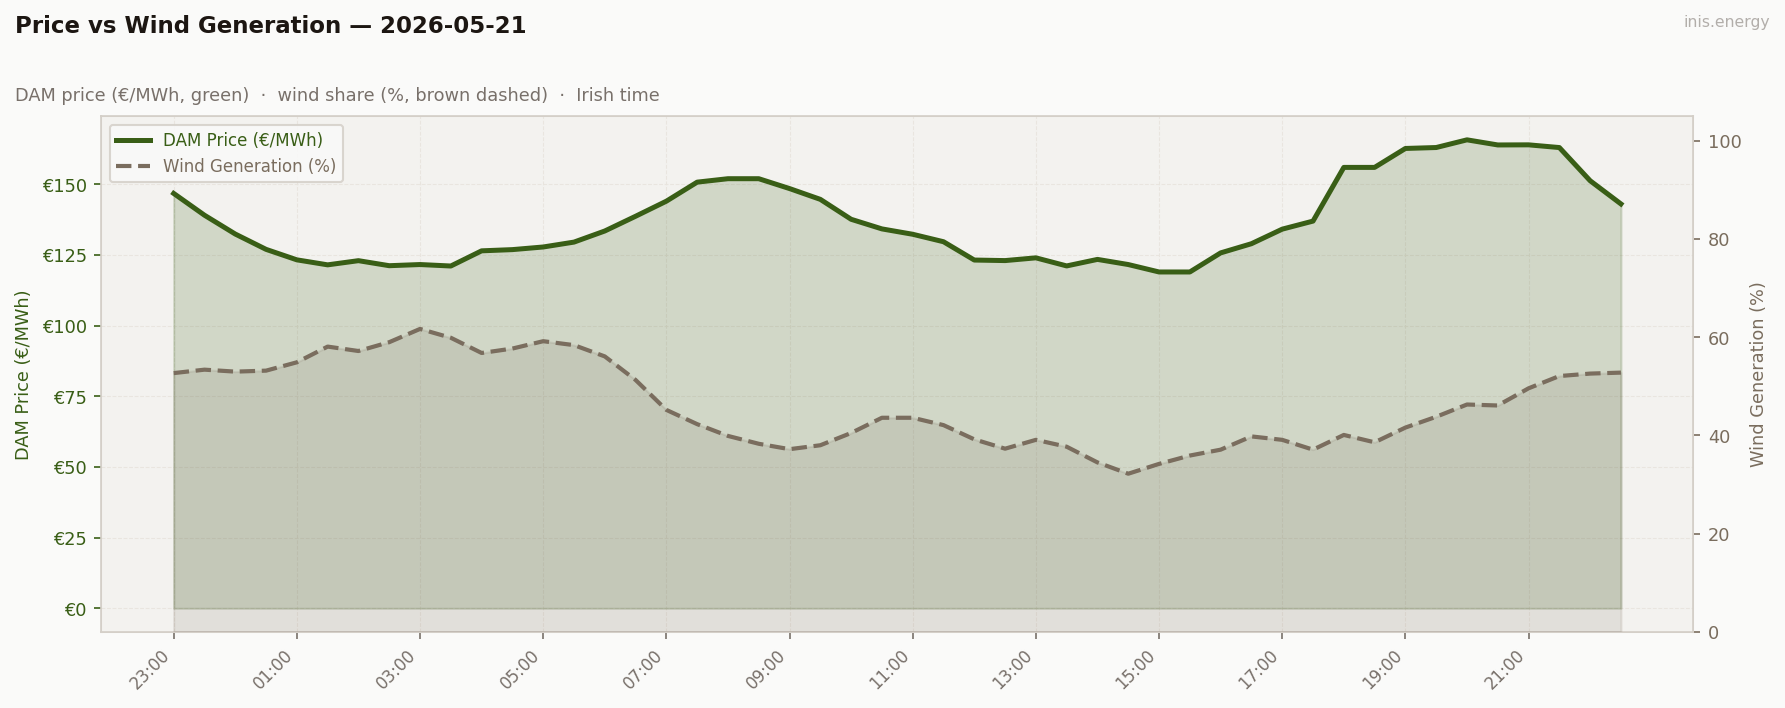
Mean wind: 46.3% · Range: 32.2%–61.7%
Wind shape was the inverse of yesterday’s, and that single difference is the structural point of the day.
May 20: wind peaked overnight (62%), drained through the day, bottomed at 27% during the evening peak. Wind shortfall into the peak — produced a €184 high.
May 21: wind peaked overnight (62%), drained to its low (32%) in the afternoon (14:30), and then recovered through the evening — back to 46% by 20:00, 52% by 21:30. Wind refill into the peak — capped the high at €166.
Same demand (3,981 MW vs 3,985 MW yesterday), same mean wind level (46% vs 42%), opposite wind shapes, €19/MWh of peak difference. The takeaway is that wind level isn’t enough — the timing within the day is the bigger lever.
The teaching line: a 50%-wind day with the right shape clears at €165. A 50%-wind day with the wrong shape clears at €220+. The two days look identical in any daily summary statistic; they don’t look identical to a battery, a peaker, or a renewable generator.
Week in Context #
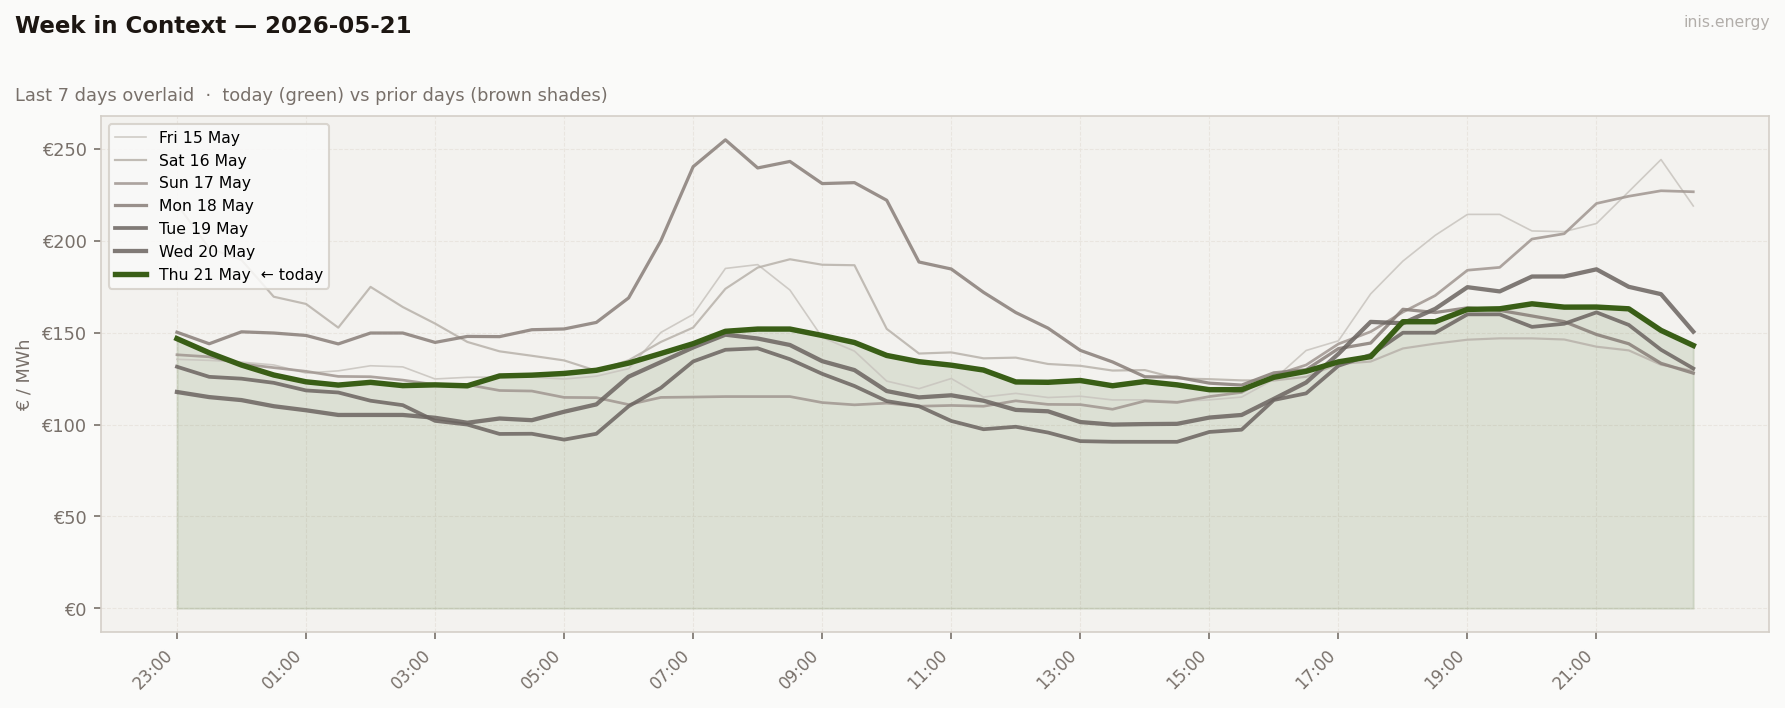
The wind-rich-working-day cluster continues to define the regime: May 11 (€120), May 13 (€110), May 14 (€127), May 19 (€120), May 20 (€128), May 21 (€137). Six days in the €110–137 band on similar wind/demand fundamentals, with the spread reflecting nothing but the intra-day wind shape.
Price Duration Curve #
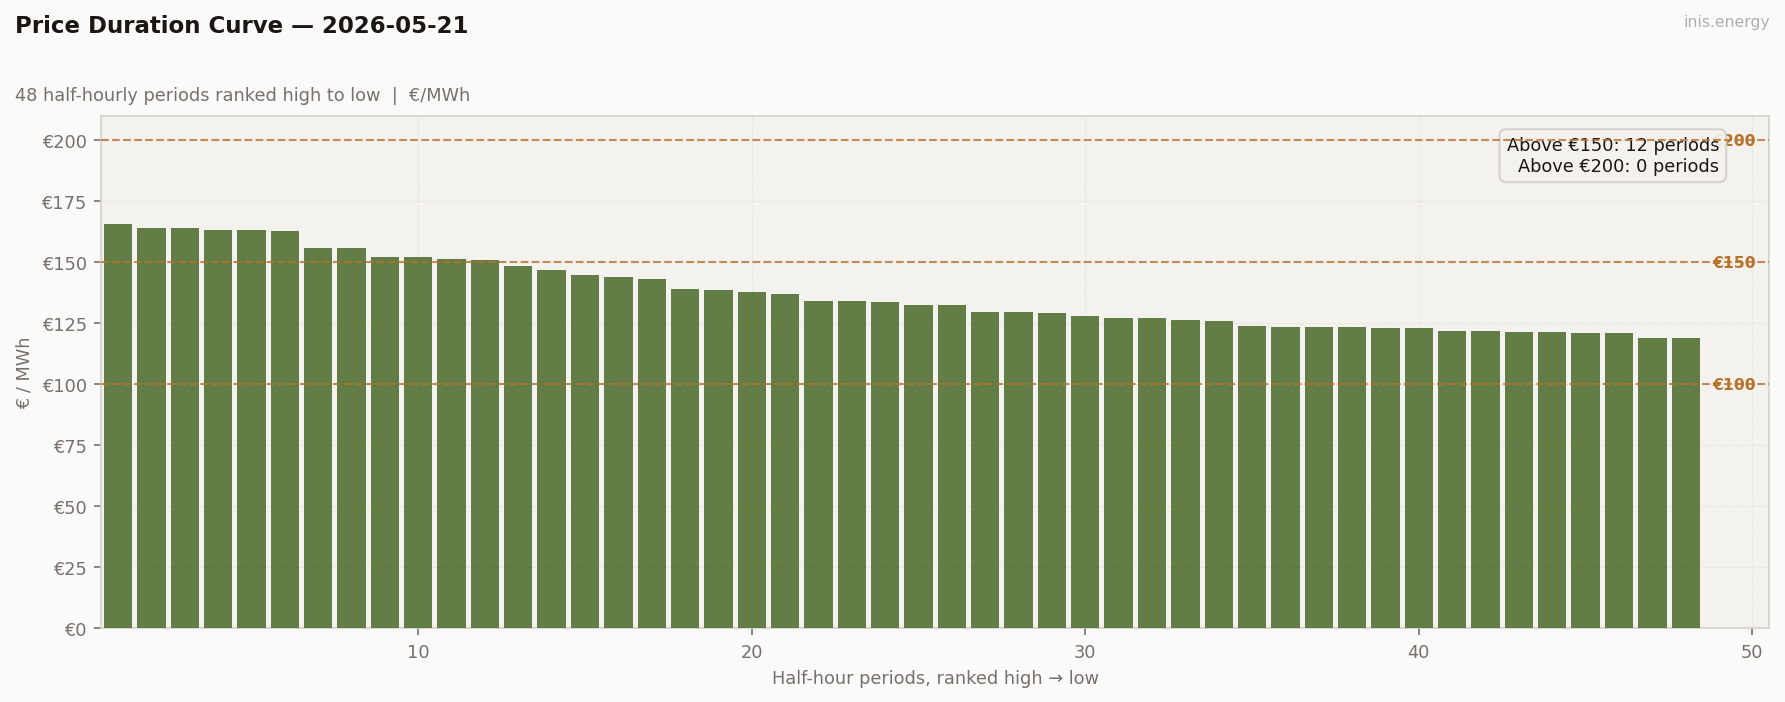
Periods above €150: 12 (25% of day) · Above €200: 0 (0% of day)
12 above €150, 0 above €200 — same headline counts as yesterday. But the shape of the curve is different. Yesterday’s PDC had a clear top shoulder around €178–184 and a clear cheap trough at €100–110. Today’s PDC is a smooth, gentle slope from €166 at the top to €119 at the bottom, with no steps and no plateau. The flattest PDC of the run.
This is the “low-and-flat” archetype, minus the low. Wind has saturated the merit order enough that the marginal plant stays inside mid-merit gas across every demand condition the day produces — no excursion into peakers at the top, no surplus pushing the floor below gas-marginal at the bottom. A consumer’s PDC: predictable, uniform, dull.
Peak / Off-Peak Spread #
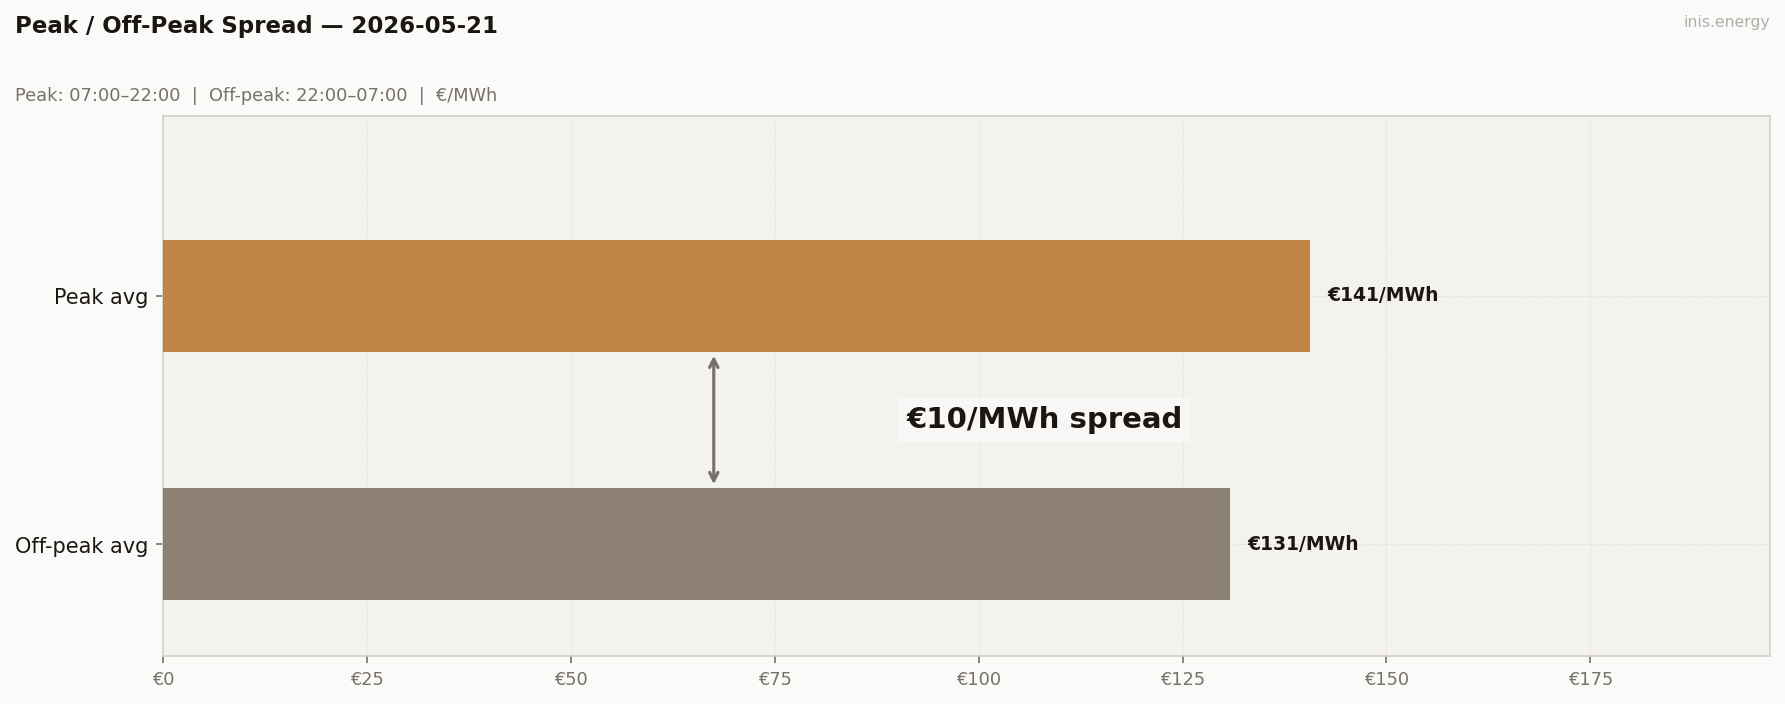
Peak avg (07:00–22:00): €140.69/MWh · Off-peak avg: €130.8/MWh · Spread: €9.89/MWh
Spread €9.89 — a new low for the run.
Peak avg €140.69, off-peak avg €130.80. The peak and off-peak windows averaged within €10/MWh of each other. There was effectively no time-of-use signal in the market today — the same plant set the price in the overnight hours as set it in the evening peak, just at slightly different load points.
A €9.89 spread sits below the round-trip efficiency threshold for storage (a 1MW/2MWh BESS needs ~€18 of spread to break even on a single cycle after 85% RTE), so on this metric alone the day is sub-marginal. The captured spread the optimiser actually found is wider (€43), because peak/off-peak averaging blurs the day’s real shape — but it’s still the worst captured spread of the run.
BESS Dispatch Signal #
| Price | Time | Energy | Value | |
|---|---|---|---|---|
| Charge | €121/MWh | 14:00 | 2 MWh | −€242 |
| Discharge | €164/MWh | 19:30 | 1.7 MWh (85% RTE) | +€279 |
| Gross profit | €38 | |||
| Price spread | €43/MWh | ROI: 15.6% |
Simulated 1MW/2MWh battery, one optimal DAM cycle. Gross before network charges and capacity costs.
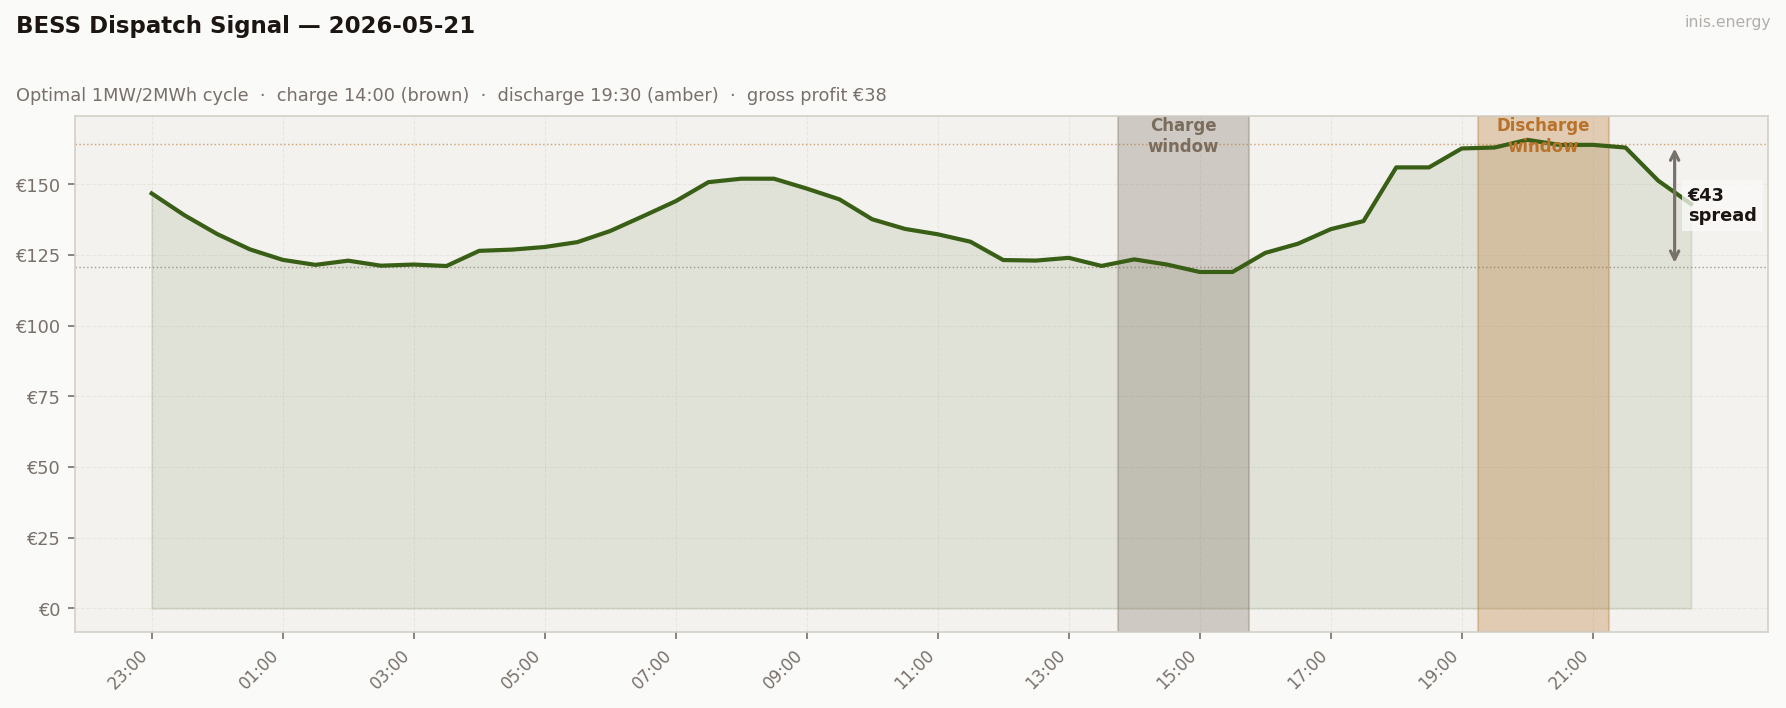
€38 gross — the worst day of the 18-day run, by €18.
Charge €121 in the afternoon trough (14:00–15:30 at €121 avg), discharge €164 in the evening plateau (19:30–21:00 at €164 avg). Captured spread €43, gross €38 after 85% RTE eats into the discharge revenue. ROI 15.6% on the €242 charge cost.
A real BESS operator running RTE-aware optimisation would have a question to ask today: is the captured spread wide enough to justify the cycle at all? €43 of spread minus 15% of round-trip losses leaves perhaps €25/MWh of net spread before any wear-and-tear or opportunity cost. A discretionary operator might reasonably skip the day entirely — and that decision, applied across enough days, is what separates a model BESS portfolio from a real one.
Commentary #
The flattest day of the 19-day run. Mean €136.98 is mid-pack, but every volatility metric (range, std dev, peak/off-peak spread) touched a new structural low. Every period sat €119–166. There was no scarcity tail and no cheap trough — just a uniformly priced day that the merit order solved at gas-marginal across all demand conditions.
The structural story is the wind shape. May 20 saw wind drain into the evening peak (62% → 27%) and produced a €184 high. May 21 saw wind recover into the evening peak (62% overnight → 32% afternoon → 52% by 21:30) and produced a €166 high. Same mean demand, similar mean wind, opposite intra-day wind timing — and €19/MWh of evening peak difference attributable to the timing alone. The bigger lever on price isn’t wind level; it’s wind shape. Today’s V-out-of-peak shape capped the merit order short of any escalation event.
For storage, a thin day. €38 gross, captured spread €43, ROI 15.6%. After 85% round-trip efficiency, the day barely justifies cycling. Give us a wind shortfall tomorrow.
Half-hourly data — 2026-05-21
| Period | Time | Price (€/MWh) | Wind % |
|---|---|---|---|
| 1 | 23:00 | 146.79 | 52.7% |
| 2 | 23:30 | 139.08 | 53.4% |
| 3 | 00:00 | 132.42 | 53.0% |
| 4 | 00:30 | 127.00 | 53.2% |
| 5 | 01:00 | 123.29 | 54.9% |
| 6 | 01:30 | 121.52 | 58.1% |
| 7 | 02:00 | 123.00 | 57.2% |
| 8 | 02:30 | 121.22 | 59.0% |
| 9 | 03:00 | 121.63 | 61.7% |
| 10 | 03:30 | 121.11 | 59.9% |
| 11 | 04:00 | 126.48 | 56.8% |
| 12 | 04:30 | 126.91 | 57.7% |
| 13 | 05:00 | 127.84 | 59.2% |
| 14 | 05:30 | 129.57 | 58.4% |
| 15 | 06:00 | 133.50 | 56.1% |
| 16 | 06:30 | 138.71 | 51.3% |
| 17 | 07:00 | 144.05 | 45.2% |
| 18 | 07:30 | 150.78 | 42.3% |
| 19 | 08:00 | 152.00 | 39.9% |
| 20 | 08:30 | 152.00 | 38.3% |
| 21 | 09:00 | 148.51 | 37.2% |
| 22 | 09:30 | 144.69 | 38.0% |
| 23 | 10:00 | 137.64 | 40.5% |
| 24 | 10:30 | 134.24 | 43.6% |
| 25 | 11:00 | 132.34 | 43.6% |
| 26 | 11:30 | 129.70 | 42.1% |
| 27 | 12:00 | 123.22 | 39.2% |
| 28 | 12:30 | 123.03 | 37.3% |
| 29 | 13:00 | 124.00 | 39.1% |
| 30 | 13:30 | 121.14 | 37.7% |
| 31 | 14:00 | 123.45 | 34.5% |
| 32 | 14:30 | 121.63 | 32.2% |
| 33 | 15:00 | 119.00 | 34.2% |
| 34 | 15:30 | 119.00 | 35.9% |
| 35 | 16:00 | 125.75 | 37.1% |
| 36 | 16:30 | 129.00 | 39.8% |
| 37 | 17:00 | 134.15 | 39.1% |
| 38 | 17:30 | 137.00 | 37.1% |
| 39 | 18:00 | 156.00 | 40.1% |
| 40 | 18:30 | 156.00 | 38.6% |
| 41 | 19:00 | 162.70 | 41.6% |
| 42 | 19:30 | 163.03 | 43.8% |
| 43 | 20:00 | 165.75 | 46.3% |
| 44 | 20:30 | 163.94 | 46.1% |
| 45 | 21:00 | 163.98 | 49.6% |
| 46 | 21:30 | 163.02 | 52.1% |
| 47 | 22:00 | 151.28 | 52.6% |
| 48 | 22:30 | 143.07 | 52.8% |
Compare your business electricity and gas rates in minutes with INIS Energy Brokers.
Compare rates