I-SEM Daily Briefing — 22 May 2026
Table of Contents
Market Snapshot
| Metric | Value |
|---|---|
| Mean DAM Price | €134.81/MWh |
| Median Price | €128.0/MWh |
| Std Dev | €17.6/MWh |
| Peak Price | €167.9/MWh (20:00) |
| Min Price | €110.13/MWh (13:30) |
| Price Range | €57.77/MWh |
| Periods above €150 | 12 of 48 (25%) |
| Periods above €200 | 0 of 48 (0%) |
| Peak Avg (07–22) | €136.69/MWh |
| Off-peak Avg (22–07) | €131.66/MWh |
| Peak/Off-Peak Spread | €5.03/MWh |
| Wind % of Demand | 36.9% |
| Wind Range | 25.9%–54.2% |
| Mean Demand | 3890 MW |
Price Profile #
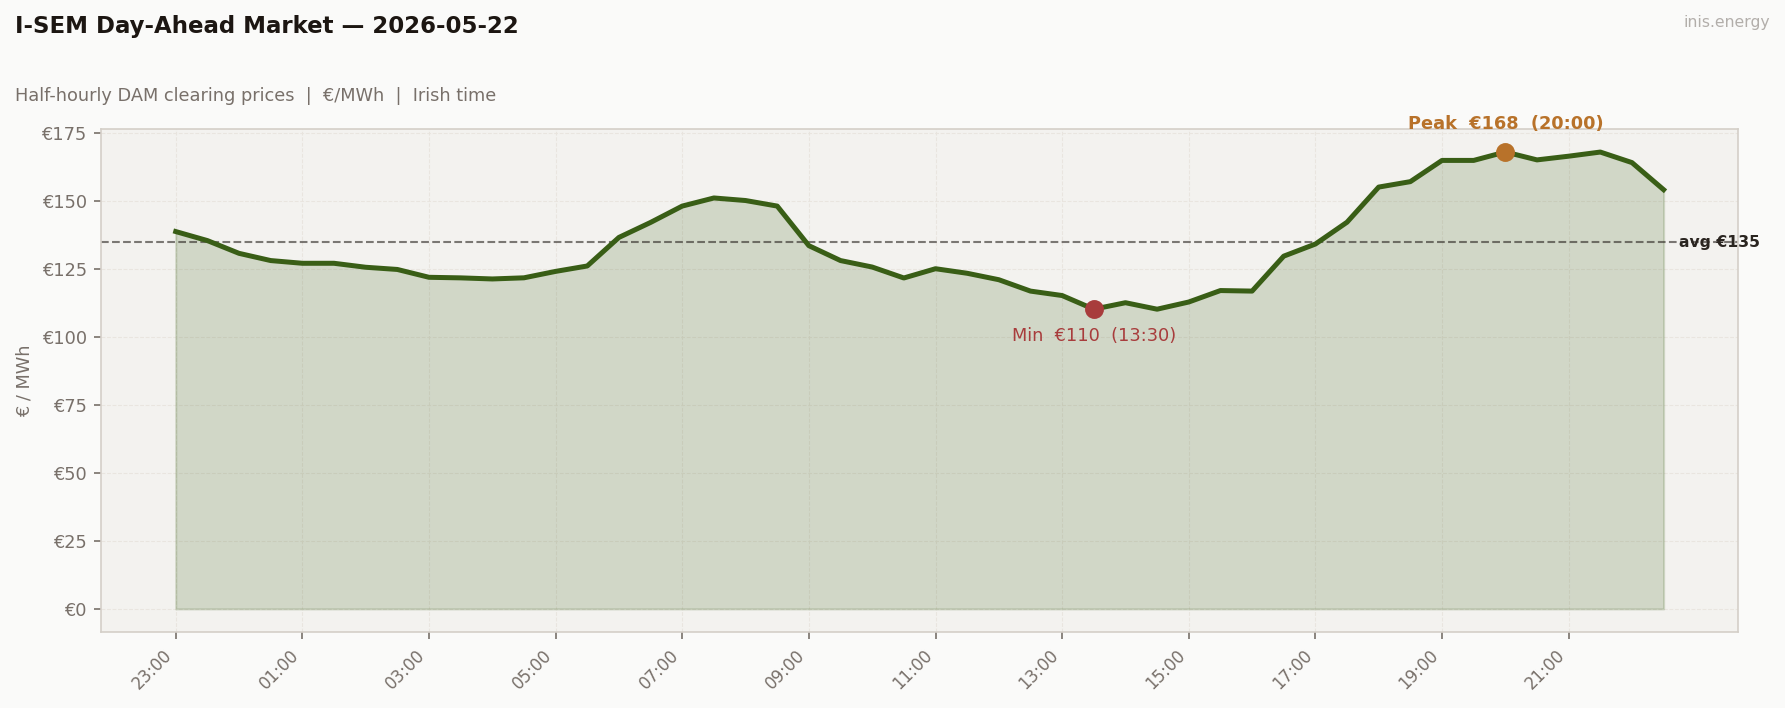
Std dev €17.6/MWh · Median €128.0/MWh · Periods above €150: 12 of 48 (25%)
A return of shape — but in a pattern we haven’t seen yet. The W-day.
Mean €134.81 is essentially May 21’s €136.98 again. But the day clears with std dev €17.60 and range €57.77 — both wider than yesterday’s. Same level, more volatility. The reason is structure: today the price climbed twice and fell twice, instead of climbing once and holding.
Overnight ran €121–147 with wind 43–54%. The morning ramp climbed €124 → €151 between 06:00 and 07:30, peaked there, and then fell back — €151 → €122 from 08:30 to 10:30 as demand softened. The midday trough bottomed at €110.13 at 13:30/14:30 — the deepest working-day floor of the 19-day run. The evening then built a second climb: €117 → €168 from 16:00 to 20:00, holding €164–168 across four consecutive hours from 19:00 to 21:30.
Two pricing events in one day — a contained morning ramp and a sustained evening peak — separated by a deep midday belly. 12 of 48 periods cleared above €150; zero above €200.
Price vs Wind #
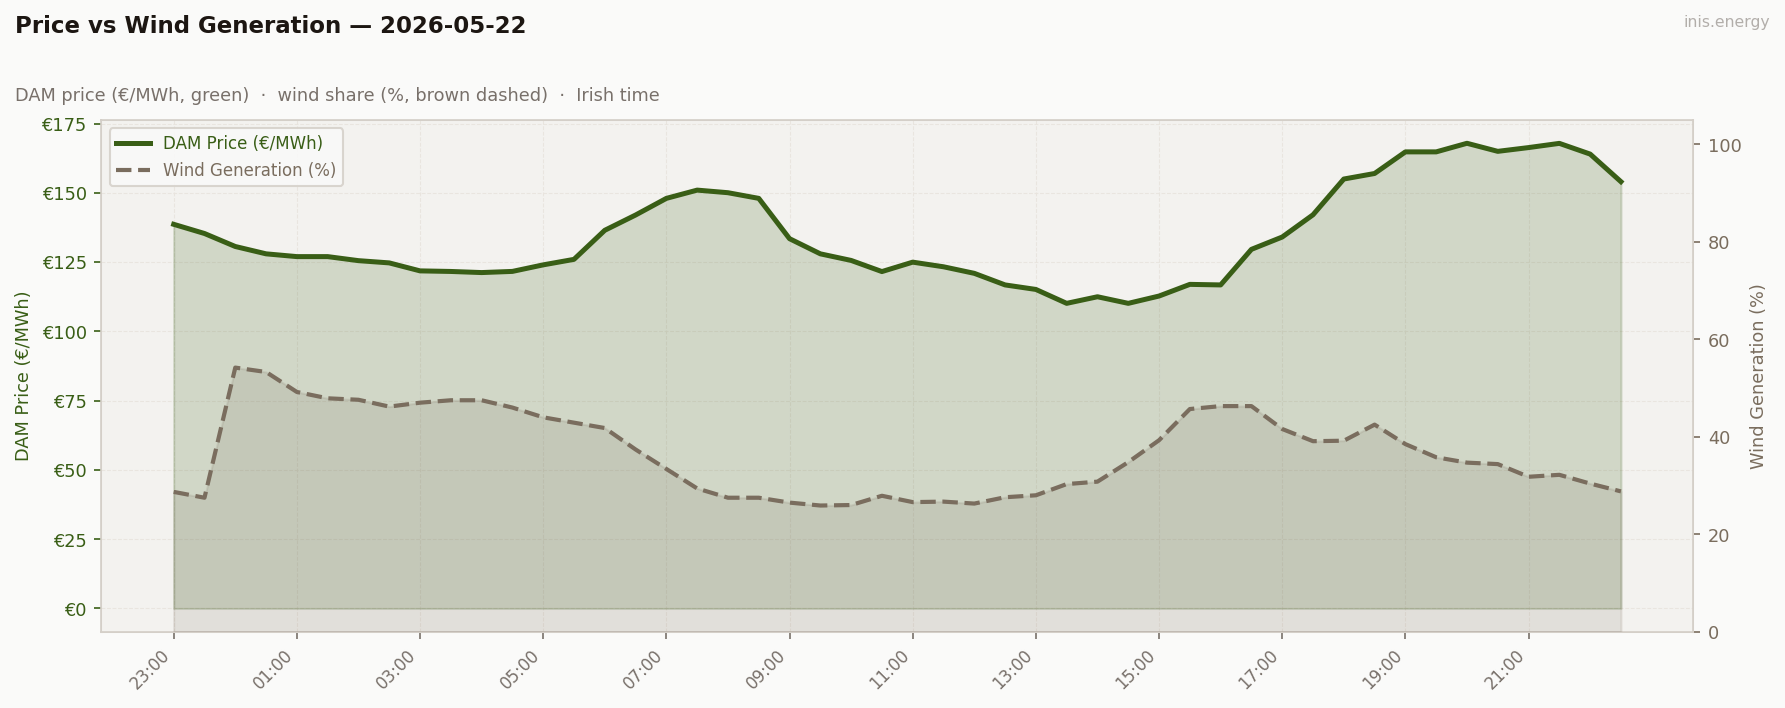
Mean wind: 36.9% · Range: 25.9%–54.2%
Wind today carried a two-decline shape — and a new structural pattern enters the catalogue.
Wind held 47–54% overnight, then drained sharply through the morning to bottom at 25.9% at 09:30 (the morning ramp’s wind shortfall). It then recovered through the afternoon, climbing back to 46.3% by 16:30 (the midday wind refill). Then drained a second time, falling from 46% at 16:30 to 28% by 22:00 (the evening shortfall).
Two declines, two pricing events, two ramps. Wind shape determines price shape in working-day conditions, and today’s W-pattern wind shape produced a W-pattern day.
| Wind shape | Evening peak | BESS | |
|---|---|---|---|
| May 20 | V into peak | €184 | €105 |
| May 21 | V out of peak | €165 | €38 |
| May 22 | W (two declines) | €168 | €61 |
This is the analytical takeaway for the week. Wind level isn’t the relevant variable for daily market behaviour. Wind shape is. Today’s mean wind (37%) is the lowest of the three days; yesterday’s mean wind (46%) was the highest. They had near-identical clearing prices. The difference between today and yesterday isn’t how much wind there was — it’s when the wind was there.
Week in Context #
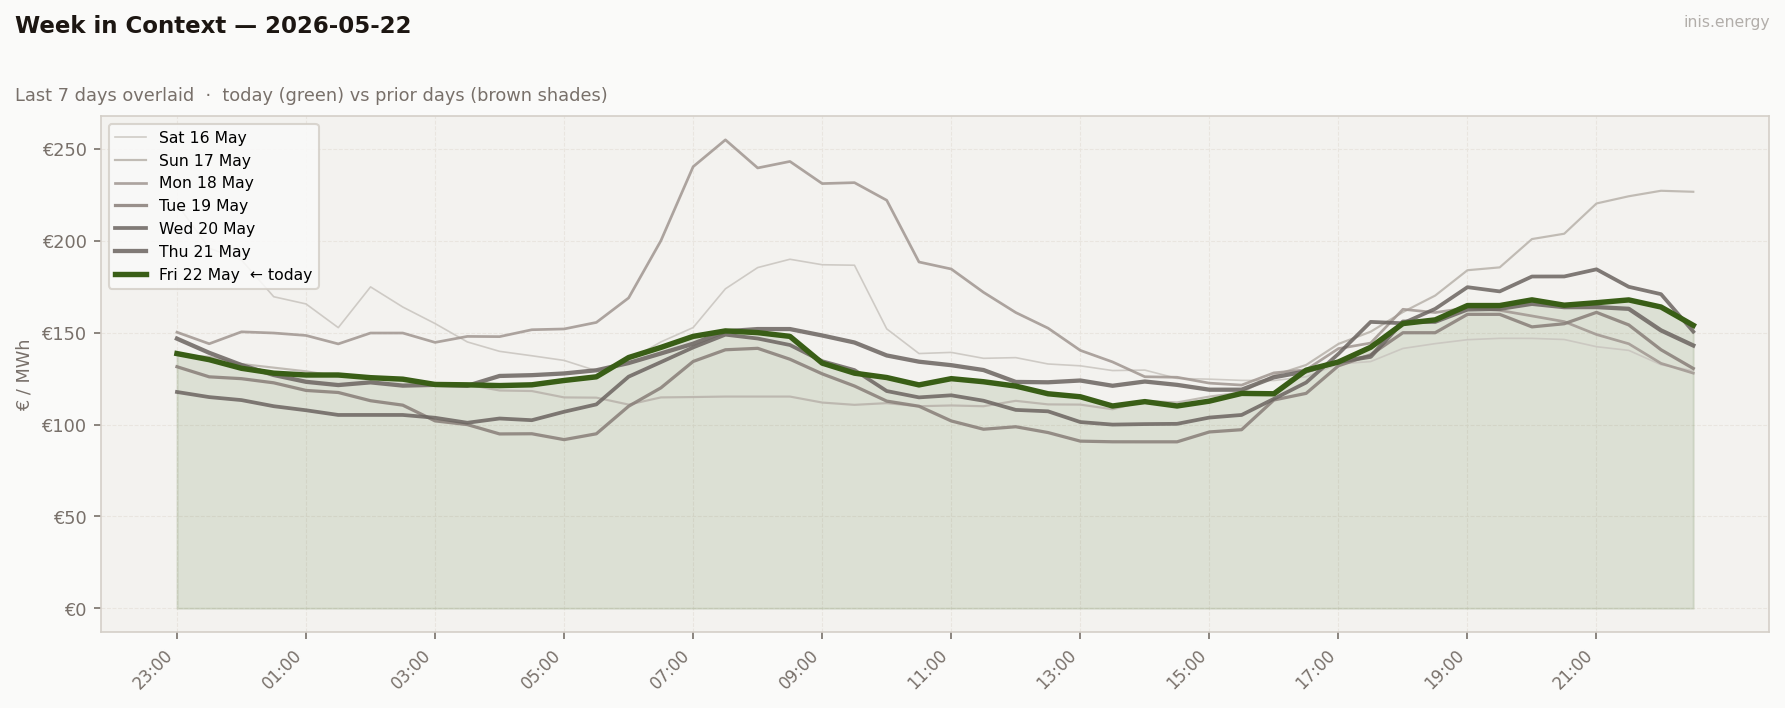
Three working days, three wind shapes, three BESS outcomes in a €38–€105 range — all at near-identical demand levels and within 10 percentage points of mean wind. The within-week wind-shape variance has been the structural story since May 19.
Price Duration Curve #
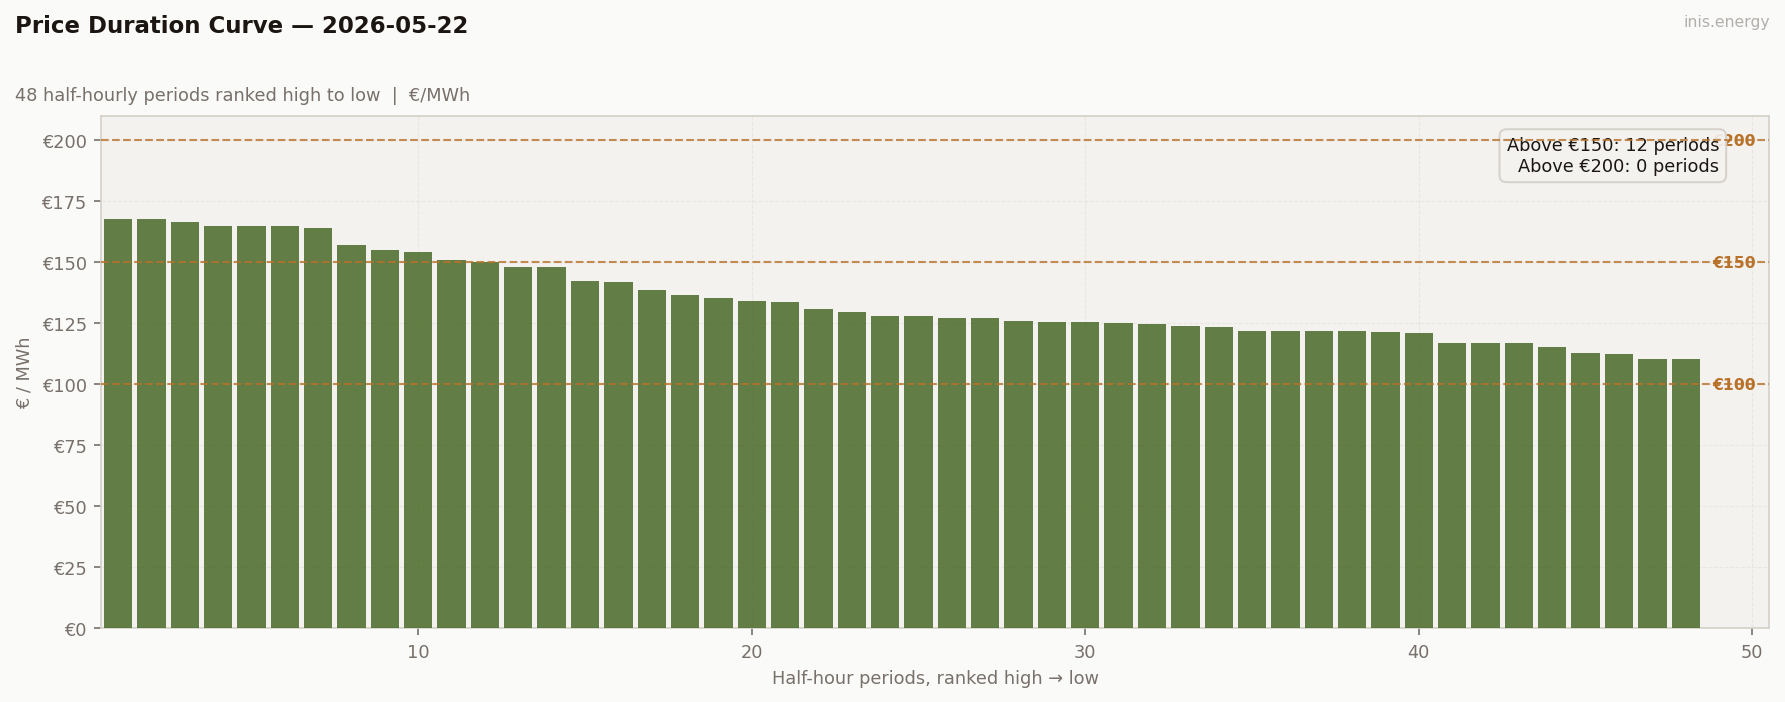
Periods above €150: 12 (25% of day) · Above €200: 0 (0% of day)
12 above €150, 0 above €200 — same headline counts as the last two days. But today’s PDC obscures something the price-vs-time chart shows clearly: the day had two distinct pricing events. The PDC strips time information. Sort 48 prices high-to-low and the W-pattern dissolves — the morning peak’s prices and the evening peak’s prices sort together at the top of the curve, the morning recovery and the midday trough sort together at the bottom. The curve looks like a clean step, smoother than yesterday’s flat slope.
This matters because a W-pattern day and a single-peak day with the same PDC produce very different BESS outcomes. The PDC tells the optimiser how much spread is available; it doesn’t tell it how to capture it. The 48-period sort makes them look identical; the dispatch window only finds one of them.
Peak / Off-Peak Spread #
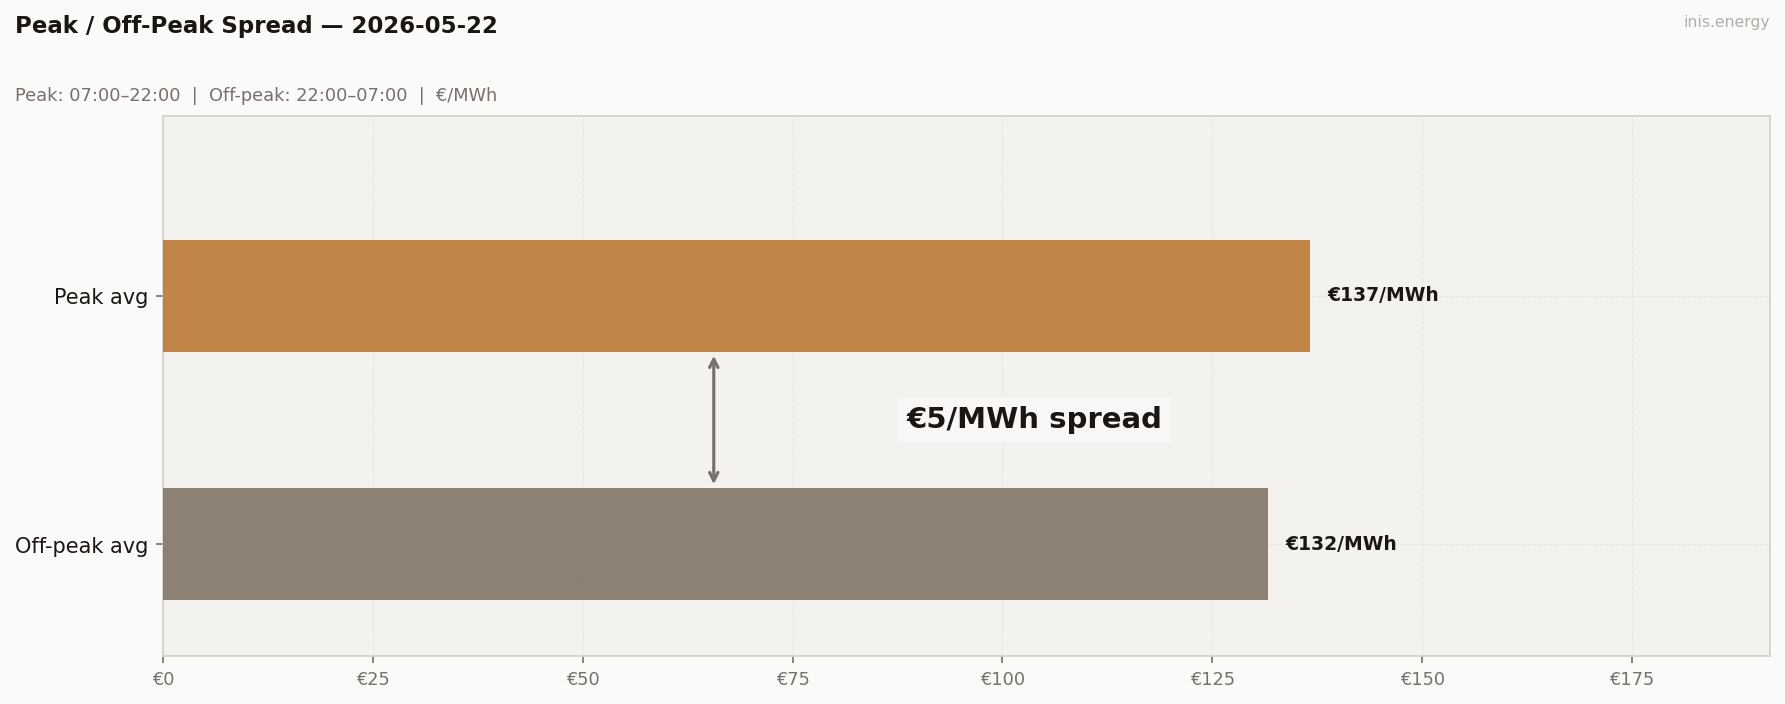
Peak avg (07:00–22:00): €136.69/MWh · Off-peak avg: €131.66/MWh · Spread: €5.03/MWh
Spread €5.03 — a new low again.
Peak avg €136.69, off-peak avg €131.66. The metric tells you the day was almost time-of-use neutral. The chart tells you something else entirely: the day had two real ramps, two real peaks, and a real midday trough.
This is where the peak/off-peak number breaks. The averaging window from 07:00 to 22:00 captured both the morning peak and the midday trough — the trough cancels the peak inside the peak window, and the result is a peak average that looks similar to the off-peak average even though the day was clearly volatile in shape. The PDC has the same problem in a different way.
The captured spread (€55) — the spread the BESS optimiser actually found — is the right number for a W-shape day. The peak/off-peak number isn’t.
BESS Dispatch Signal #
| Price | Time | Energy | Value | |
|---|---|---|---|---|
| Charge | €111/MWh | 13:30 | 2 MWh | −€223 |
| Discharge | €167/MWh | 20:00 | 1.7 MWh (85% RTE) | +€284 |
| Gross profit | €61 | |||
| Price spread | €55/MWh | ROI: 27.3% |
Simulated 1MW/2MWh battery, one optimal DAM cycle. Gross before network charges and capacity costs.
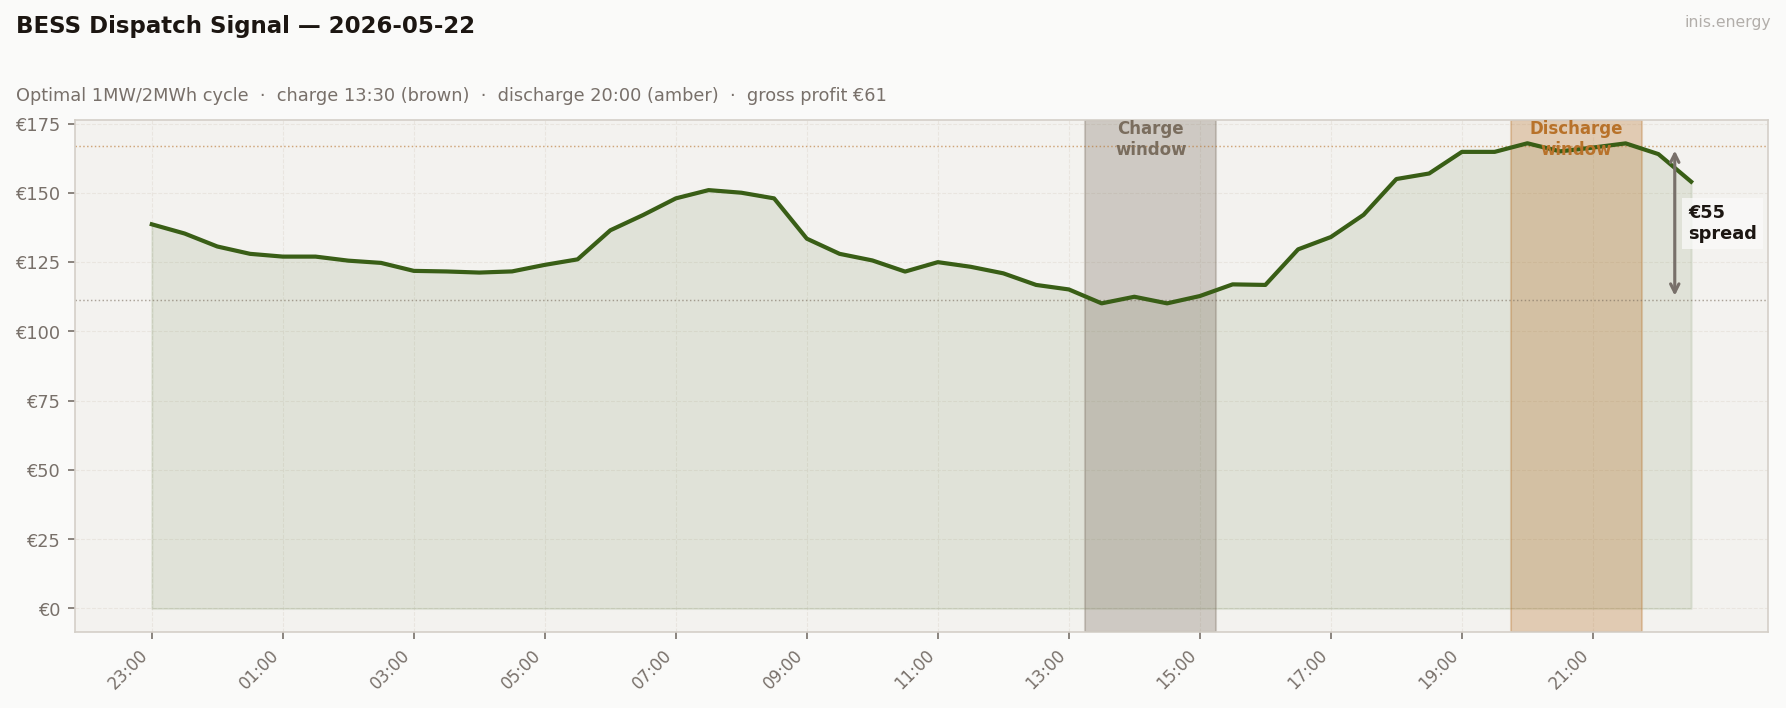
€61 gross — €23 above yesterday’s €38, on near-identical mean prices.
The optimiser found the midday trough (13:30–15:00 at €111 avg) and the evening peak (19:30–21:00 at €167 avg) cleanly. Captured spread €55, gross €61, ROI 27.3% on the €223 charge cost. Standard wind-rich working-day BESS, in the middle of the May 11–14 range.
The €23 BESS revenue difference between yesterday and today is the entire structural read of the working week. Same demand, same mean price level — different intra-day wind shape. A V-out-of-peak day (yesterday) earned €38. A W-shape day (today) earned €61. A V-into-peak day (May 20) earned €105. Three values, three wind shapes, single variable.
Commentary #
The W-day. Mean €134.81 sits almost level with yesterday’s €136.98, but the day climbed twice and fell twice — a morning ramp, a midday trough, an evening peak — instead of yesterday’s single contained plateau. The structural cause was the wind shape: two distinct wind declines (overnight → morning, and afternoon → evening) producing two distinct pricing events.
The three working days from May 20 to May 22 produced the cleanest within-week wind-shape comparison of the run. Same demand, similar mean wind levels, three different intra-day wind shapes:
- V into peak (May 20): wind drains to evening, evening peaks €184, BESS €105
- V out of peak (May 21): wind refills evening, evening peaks €165, BESS €38
- W (May 22): two wind declines, two pricing events, BESS €61
The structural lesson is that the daily summary statistics — mean price, mean wind, peak/off-peak spread — don’t carry the relevant information for flexibility revenue. A BESS forecast model needs to predict the shape of the wind day, not its level. The captured spread (the metric the optimiser actually earns against) tracked the wind shape cleanly across all three days; the peak/off-peak spread didn’t.
Half-hourly data — 2026-05-22
| Period | Time | Price (€/MWh) | Wind % |
|---|---|---|---|
| 1 | 23:00 | 138.66 | 28.7% |
| 2 | 23:30 | 135.34 | 27.5% |
| 3 | 00:00 | 130.65 | 54.2% |
| 4 | 00:30 | 128.00 | 53.3% |
| 5 | 01:00 | 127.00 | 49.2% |
| 6 | 01:30 | 127.00 | 47.9% |
| 7 | 02:00 | 125.54 | 47.6% |
| 8 | 02:30 | 124.73 | 46.2% |
| 9 | 03:00 | 121.85 | 47.0% |
| 10 | 03:30 | 121.64 | 47.5% |
| 11 | 04:00 | 121.24 | 47.5% |
| 12 | 04:30 | 121.66 | 46.0% |
| 13 | 05:00 | 124.02 | 44.0% |
| 14 | 05:30 | 126.01 | 42.9% |
| 15 | 06:00 | 136.50 | 41.8% |
| 16 | 06:30 | 142.01 | 37.4% |
| 17 | 07:00 | 148.02 | 33.4% |
| 18 | 07:30 | 151.00 | 29.4% |
| 19 | 08:00 | 150.06 | 27.5% |
| 20 | 08:30 | 148.02 | 27.5% |
| 21 | 09:00 | 133.47 | 26.5% |
| 22 | 09:30 | 128.00 | 25.9% |
| 23 | 10:00 | 125.62 | 26.0% |
| 24 | 10:30 | 121.60 | 27.9% |
| 25 | 11:00 | 125.00 | 26.6% |
| 26 | 11:30 | 123.33 | 26.7% |
| 27 | 12:00 | 120.96 | 26.3% |
| 28 | 12:30 | 116.78 | 27.6% |
| 29 | 13:00 | 115.15 | 28.0% |
| 30 | 13:30 | 110.13 | 30.3% |
| 31 | 14:00 | 112.51 | 30.8% |
| 32 | 14:30 | 110.13 | 34.8% |
| 33 | 15:00 | 112.77 | 39.3% |
| 34 | 15:30 | 116.98 | 45.7% |
| 35 | 16:00 | 116.78 | 46.3% |
| 36 | 16:30 | 129.62 | 46.3% |
| 37 | 17:00 | 134.07 | 41.6% |
| 38 | 17:30 | 142.10 | 39.1% |
| 39 | 18:00 | 155.00 | 39.2% |
| 40 | 18:30 | 157.00 | 42.5% |
| 41 | 19:00 | 164.80 | 38.5% |
| 42 | 19:30 | 164.80 | 35.8% |
| 43 | 20:00 | 167.90 | 34.7% |
| 44 | 20:30 | 164.99 | 34.4% |
| 45 | 21:00 | 166.35 | 31.8% |
| 46 | 21:30 | 167.87 | 32.2% |
| 47 | 22:00 | 164.00 | 30.4% |
| 48 | 22:30 | 154.04 | 28.8% |
Compare your business electricity and gas rates in minutes with INIS Energy Brokers.
Compare rates