I-SEM Daily Briefing — 24 May 2026
Table of Contents
Market Snapshot
| Metric | Value |
|---|---|
| Mean DAM Price | €143.77/MWh |
| Median Price | €131.86/MWh |
| Std Dev | €35.63/MWh |
| Peak Price | €228.48/MWh (21:30) |
| Min Price | €110.0/MWh (13:30) |
| Price Range | €118.48/MWh |
| Periods above €150 | 10 of 48 (21%) |
| Periods above €200 | 7 of 48 (15%) |
| Peak Avg (07–22) | €145.28/MWh |
| Off-peak Avg (22–07) | €141.25/MWh |
| Peak/Off-Peak Spread | €4.03/MWh |
| Wind % of Demand | 16.4% |
| Wind Range | 6.0%–30.4% |
| Mean Demand | 3358 MW |
Price Profile #
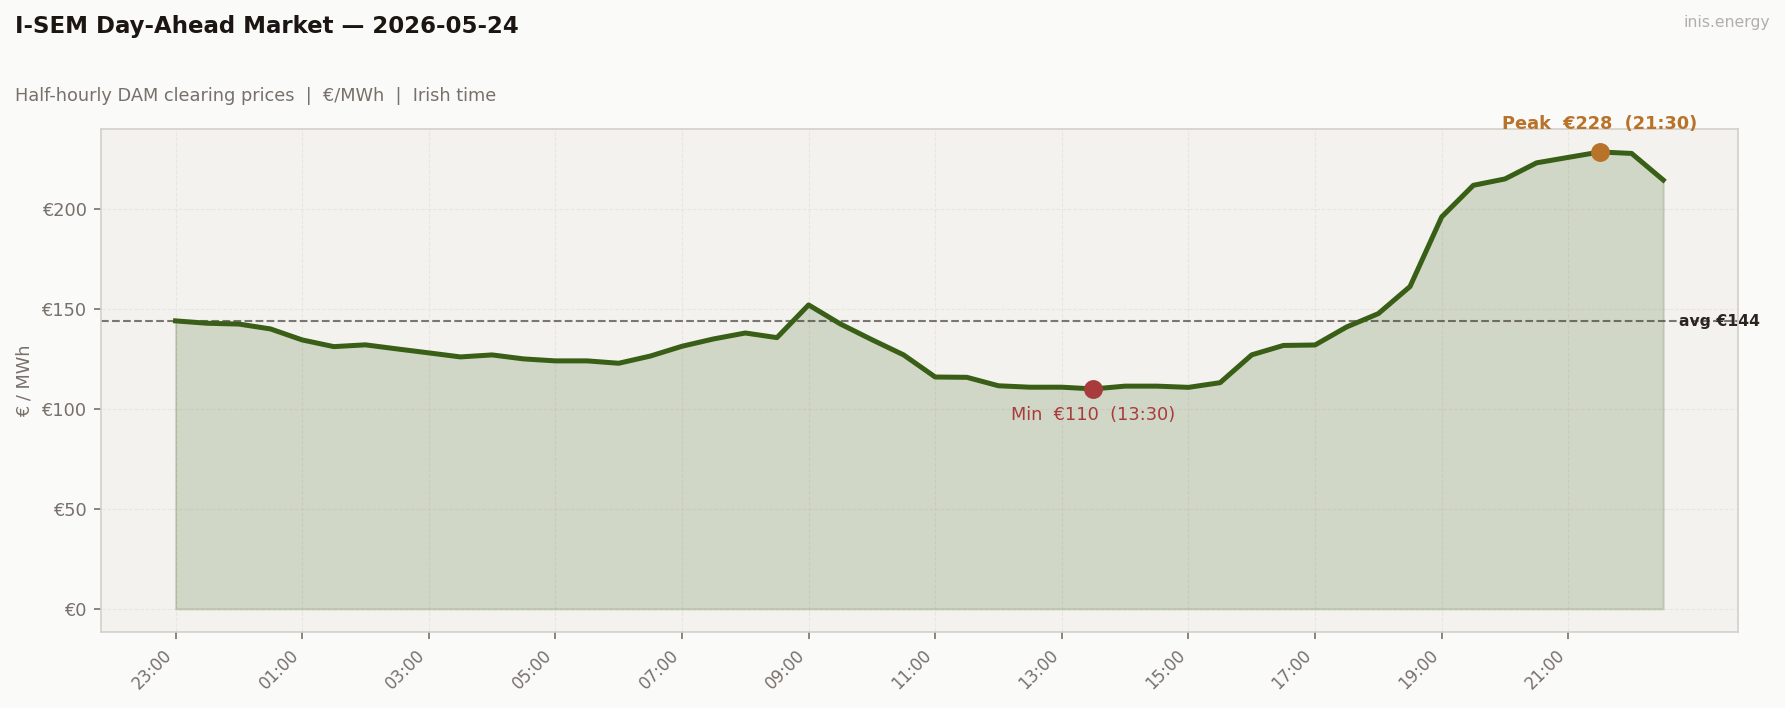
Std dev €35.63/MWh · Median €131.86/MWh · Periods above €150: 10 of 48 (21%)
Sunday, even lower demand than Saturday — and a scarcity event. Mean €143.77 lifts €21 from Saturday. The shape resembles May 23 in its first half (no morning peak, midday trough), then breaks dramatically: where Saturday’s evening capped at €174, today’s evening kept climbing — to €228.48 at 21:30, with 7 of 48 periods clearing above €200. The half-hourly: overnight ran €122–144 (a normal weekend floor), the morning ramp existed but modestly (€127 → €152 between 06:00 and 09:00), and the midday belly held €110–127 from 11:00 to 15:30 with the floor at €110.00 at 13:30. Then the evening built relentlessly: €127 at 16:00 → €152 at 18:00 → €212 at 19:30 → €228 at 21:30. The four consecutive half-hours from 20:30 to 22:00 averaged €226 — straight peaker territory. Two distinct days in one: a wind-rich weekend morning, and a wind-shortage evening scarcity. Mean demand only 3,358 MW — lowest of the run by 150 MW — and still 7 periods above €200.
Price vs Wind #
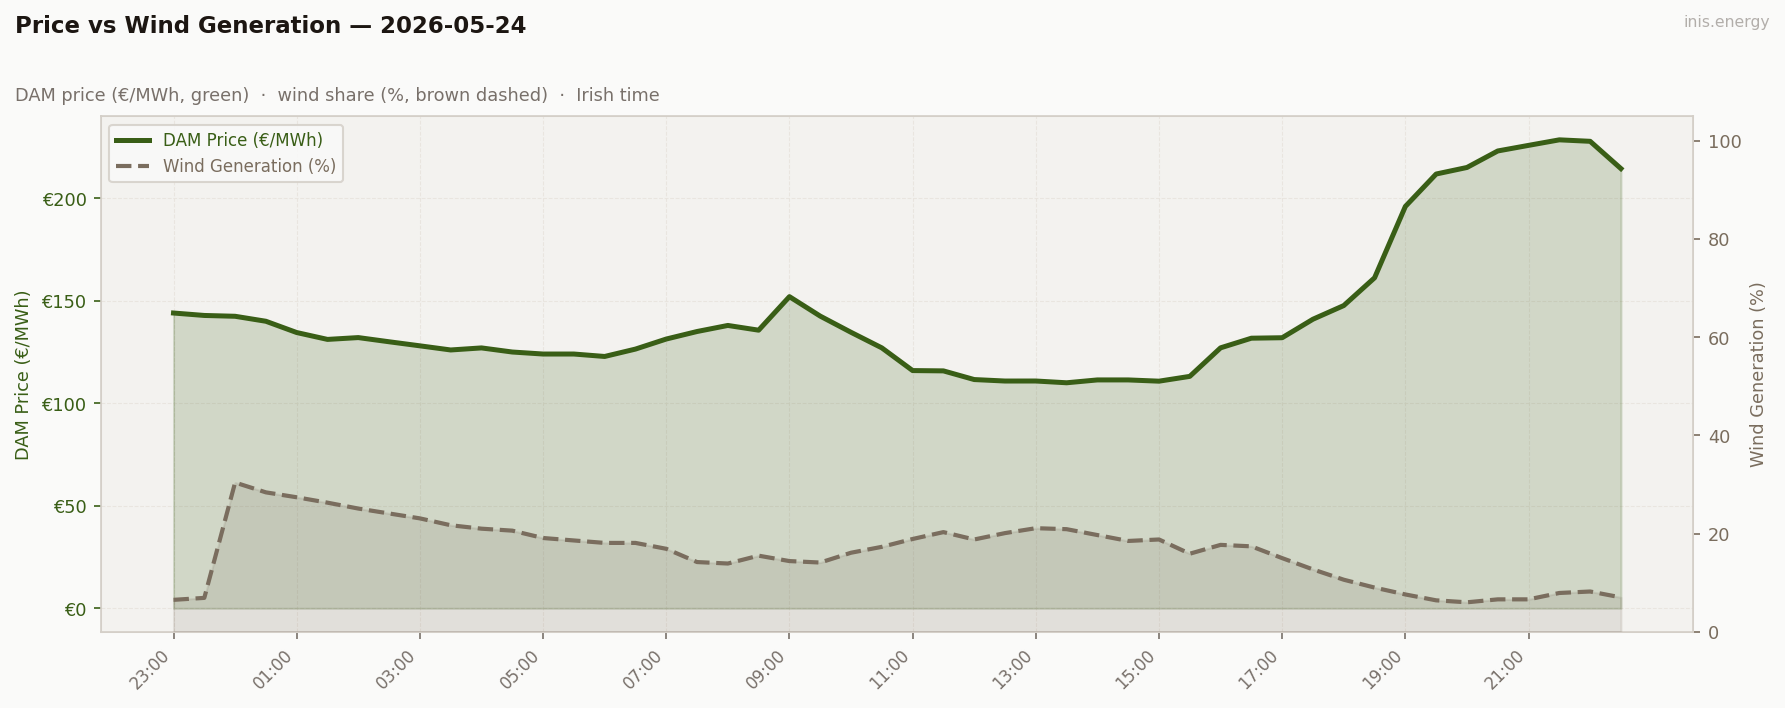
Mean wind: 16.4% · Range: 6.0%–30.4%
The wind shape did the entire structural work, and re-confirms a lesson the May 17–18 scarcity event taught. Wind ran 24–30% through the overnight and morning, drifted down to 13–21% through the working day, and then drained sharply through the evening — 17% at 17:00, 13% at 18:00, 9% at 18:30, 6% by 20:00. Wind effectively disappeared during the evening peak demand window. Even with demand at a weekend-low 3,358 MW, the merit order ran out of mid-merit gas and climbed into peakers. €228 at 21:30 is plant-scarcity pricing — same regime as the May 18 morning event. The takeaway: scarcity isn’t a demand event, it’s a wind-timing event. May 24 had the lowest demand of the run and still produced 7 scarcity prints, purely because wind drained into the evening peak. Most market commentary focuses on demand peaks; the I-SEM’s price formation in 2026 is driven much more by where the wind is than how much demand there is. A Sunday with 3,358 MW demand and 6% evening wind produces a higher peak than a working Wednesday with 4,028 MW demand and 50% evening wind.
Week in Context #
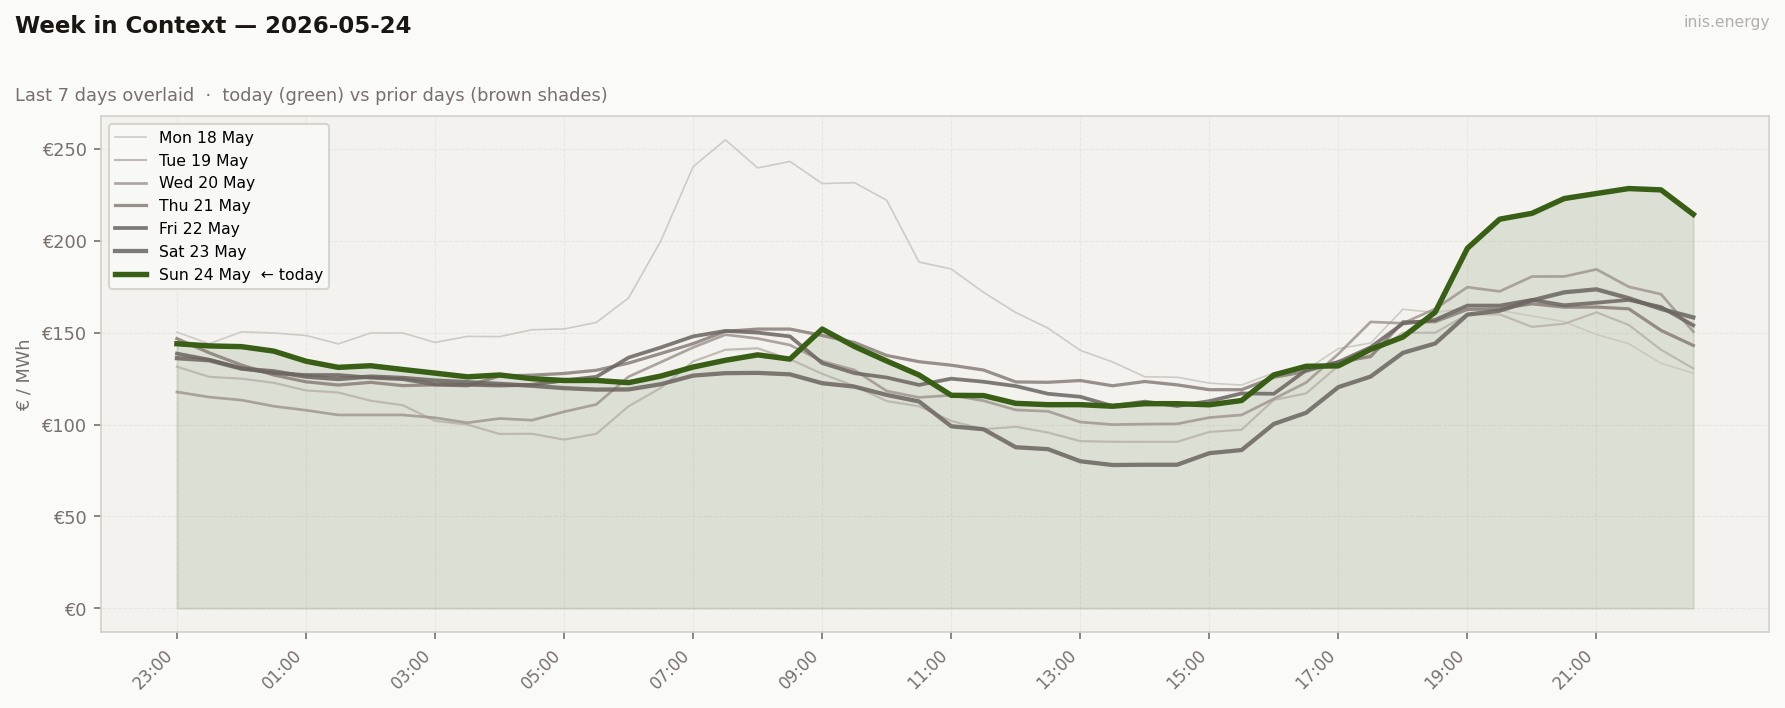
Sunday should be cheap. It wasn’t. The wind drought builds: 47% Friday → 36% Saturday → 31% Saturday (mean wind doesn’t tell you everything — the evening wind on Saturday was 27%) → 16% Sunday. Tomorrow brings 3.7% and a bank holiday.
Price Duration Curve #
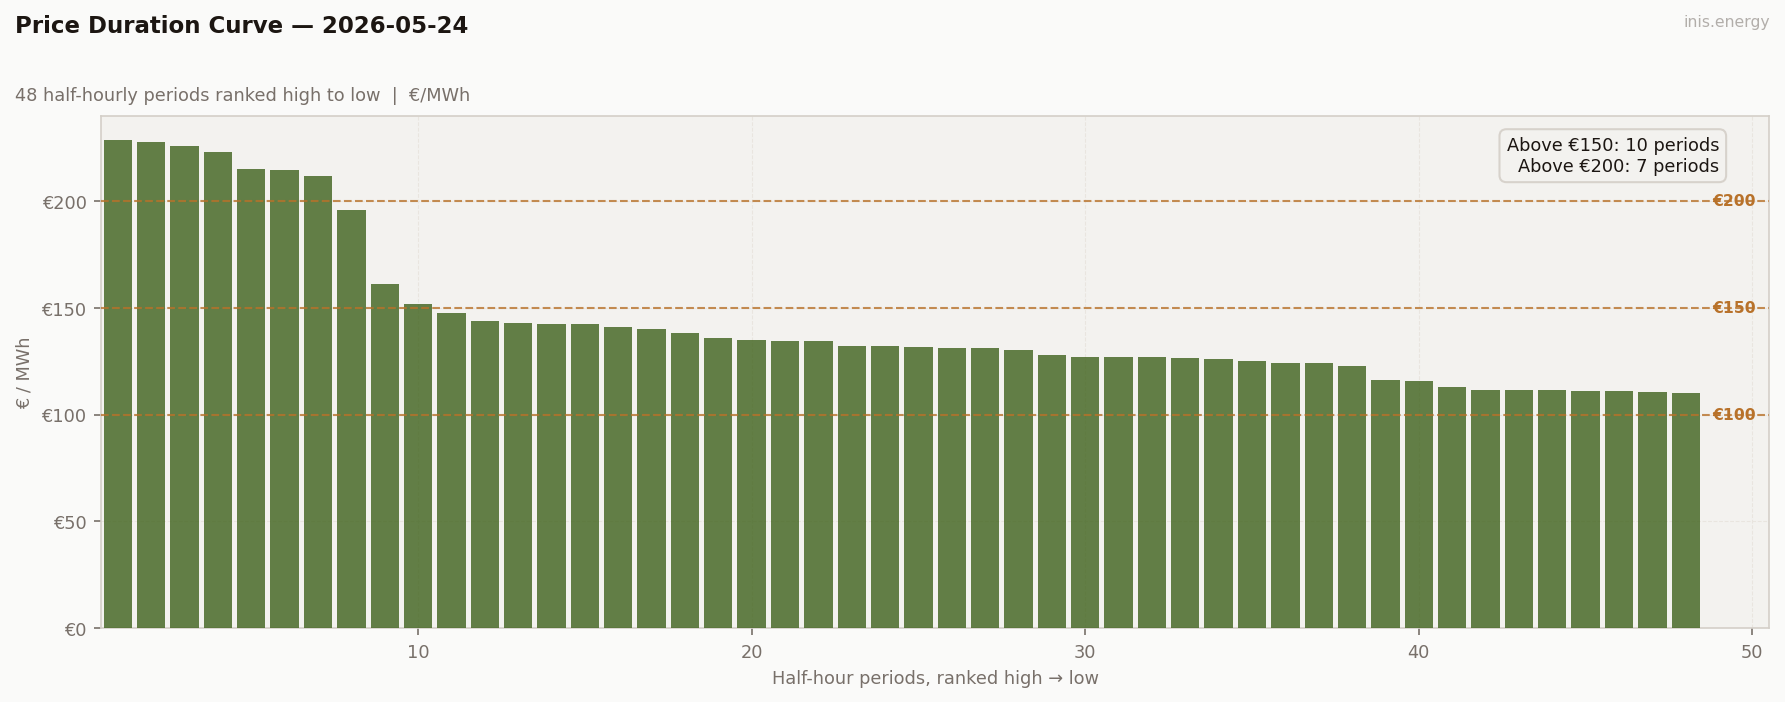
Periods above €150: 10 (21% of day) · Above €200: 7 (15% of day)
10 above €150, 7 above €200. The curve has a clean two-tier shape: a sharp top plateau (the 7 scarcity periods clustered €200–228) and a long cheap tail (16 periods below €130, with the bottom 4 averaging €111). The middle is moderate — 25 periods between €130 and €150, smoothly transitioning. This is the double-shoulder PDC — both a real top step and a real bottom step, with a moderate slope in between. The visual signature of a day with a deep midday trough and a real evening scarcity. Compare to May 18’s PDC (steep top, no real trough — pure scarcity revenue) or to May 23’s PDC (steep bottom, no real top — pure trough revenue). Today’s PDC has both ends working at once, which is the structural condition for a top-quintile BESS day.
Peak / Off-Peak Spread #
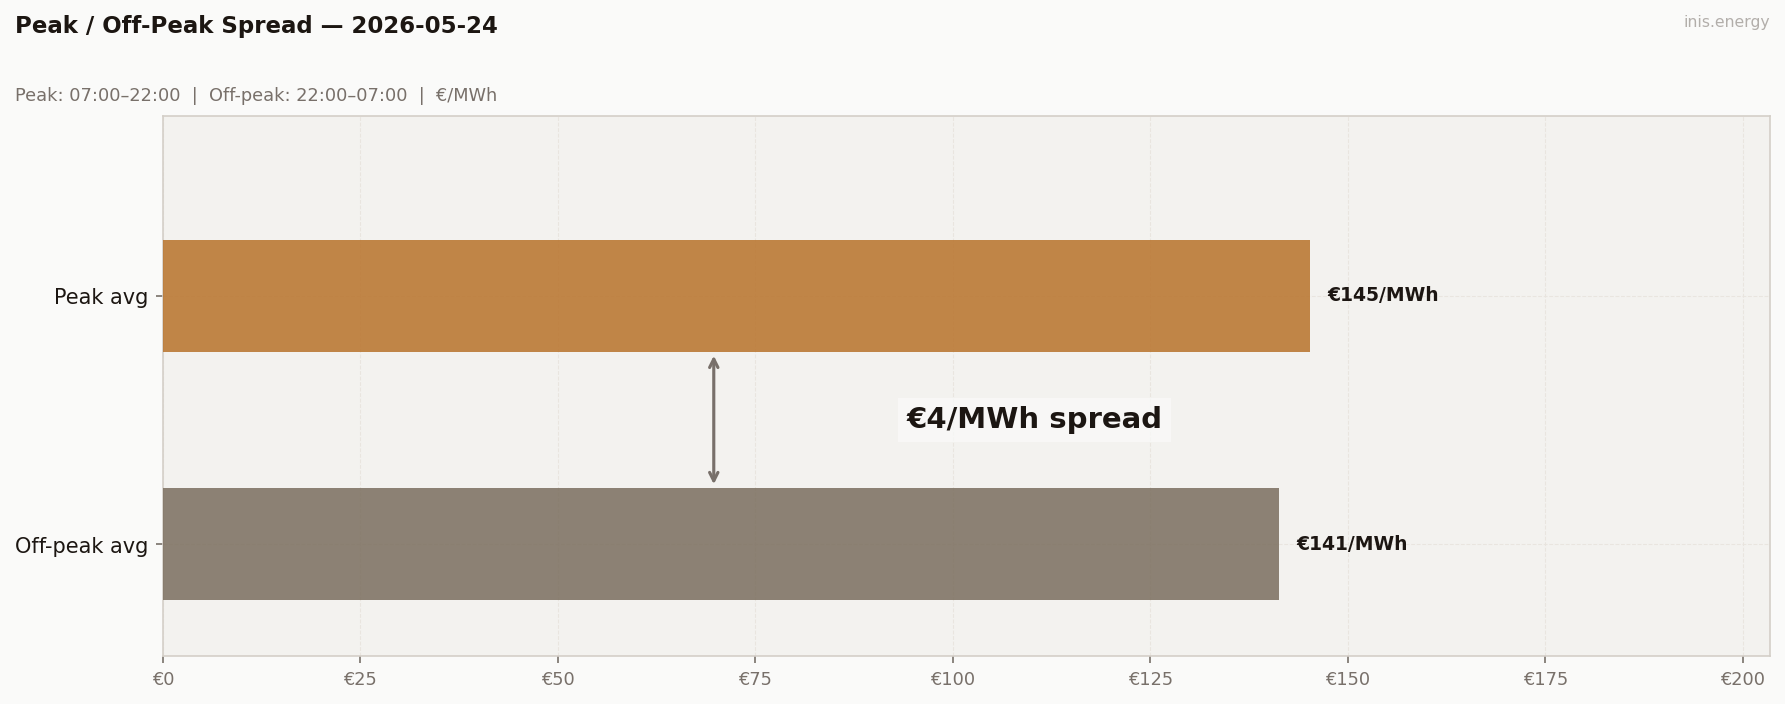
Peak avg (07:00–22:00): €145.28/MWh · Off-peak avg: €141.25/MWh · Spread: €4.03/MWh
Spread €4.03 — a tiny number that hides a €228 evening peak. Peak avg €145.28, off-peak avg €141.25. Same metric problem as yesterday’s negative spread, in a different direction. The peak window (07:00–22:00) contains both the deep midday trough (€110) and the evening scarcity (€228). The trough drags the peak average down to €145; the off-peak average sits at €141 (overnight floor that didn’t move much). The two averages converge despite a price range of €118 within the peak window itself. This is now the third day in a row where the peak/off-peak metric materially misrepresents the day. May 22 reported €5.03 on a €58 range. May 23 reported −€9.88 on a €96 range. May 24 reports €4.03 on a €118 range. Whatever the peak/off-peak metric is good for, it isn’t reading wind-shape days.
BESS Dispatch Signal #
| Price | Time | Energy | Value | |
|---|---|---|---|---|
| Charge | €111/MWh | 12:30 | 2 MWh | −€222 |
| Discharge | €226/MWh | 20:30 | 1.7 MWh (85% RTE) | +€385 |
| Gross profit | €163 | |||
| Price spread | €115/MWh | ROI: 73.6% |
Simulated 1MW/2MWh battery, one optimal DAM cycle. Gross before network charges and capacity costs.
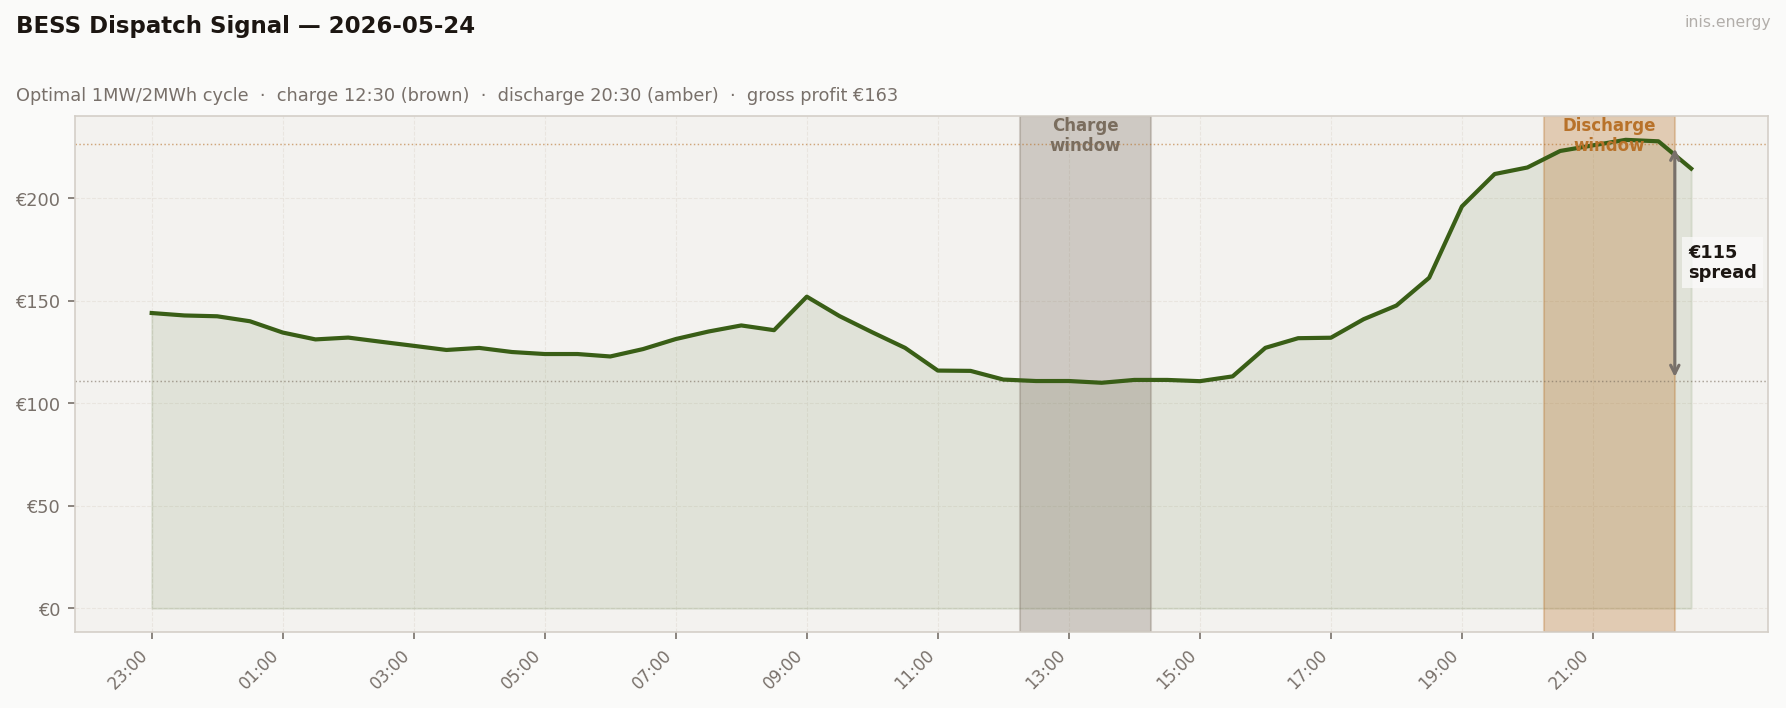
€163 gross. Sunday delivers a top-tier BESS outturn. Charge €111 in the midday belly (12:30–14:00 at €111 avg), discharge €226 in the late-evening scarcity block (20:30–22:00 at €226 avg). Captured spread €115. ROI 73.6% on the €222 charge cost.
Conventional wisdom puts the best BESS days on working-week scarcity; today’s a Sunday.
Commentary #
Sunday, demand at the run’s lowest (3,358 MW), and 7 of 48 periods cleared above €200. Mean €143.77 lifted €21 from Saturday. The structural cause was the wind shape: wind held 24–30% through the morning, drifted down through the working day, and then drained sharply through the evening peak — 17% at 17:00, 13% at 18:00, 9% at 18:30, 6% by 20:00. With wind effectively absent at peak demand, the merit order climbed into peakers and the day cleared €226 across four consecutive half-hours from 20:30 to 22:00. The May 17–18 lesson re-confirmed: scarcity isn’t a demand event, it’s a wind-timing event. Today’s demand was the lowest of the 21-day run; today’s evening peak was the third-highest. A Sunday with 3,358 MW demand and 6% evening wind cleared higher than working days with 4,028 MW demand and 50% evening wind. The relevant variable for I-SEM price formation in 2026 is wind timing, not load. For storage, €163 gross on a €115 captured spread (€111 midday charge, €226 evening discharge). The working-week-scarcity assumption that underpins most BESS revenue modelling deserves a closer look.
Half-hourly data — 2026-05-24
| Period | Time | Price (€/MWh) | Wind % |
|---|---|---|---|
| 1 | 23:00 | 144.02 | 6.5% |
| 2 | 23:30 | 142.83 | 6.9% |
| 3 | 00:00 | 142.43 | 30.4% |
| 4 | 00:30 | 140.00 | 28.4% |
| 5 | 01:00 | 134.50 | 27.4% |
| 6 | 01:30 | 131.15 | 26.3% |
| 7 | 02:00 | 132.04 | 25.1% |
| 8 | 02:30 | 130.00 | 24.1% |
| 9 | 03:00 | 128.02 | 23.1% |
| 10 | 03:30 | 126.00 | 21.7% |
| 11 | 04:00 | 127.00 | 21.0% |
| 12 | 04:30 | 125.00 | 20.6% |
| 13 | 05:00 | 124.02 | 19.1% |
| 14 | 05:30 | 124.02 | 18.6% |
| 15 | 06:00 | 122.83 | 18.1% |
| 16 | 06:30 | 126.43 | 18.1% |
| 17 | 07:00 | 131.33 | 16.9% |
| 18 | 07:30 | 135.00 | 14.2% |
| 19 | 08:00 | 137.96 | 13.9% |
| 20 | 08:30 | 135.65 | 15.5% |
| 21 | 09:00 | 152.00 | 14.4% |
| 22 | 09:30 | 142.51 | 14.1% |
| 23 | 10:00 | 134.61 | 16.1% |
| 24 | 10:30 | 127.02 | 17.3% |
| 25 | 11:00 | 115.95 | 18.9% |
| 26 | 11:30 | 115.80 | 20.3% |
| 27 | 12:00 | 111.57 | 18.8% |
| 28 | 12:30 | 110.85 | 20.1% |
| 29 | 13:00 | 110.86 | 21.1% |
| 30 | 13:30 | 110.00 | 20.9% |
| 31 | 14:00 | 111.39 | 19.7% |
| 32 | 14:30 | 111.39 | 18.5% |
| 33 | 15:00 | 110.78 | 18.8% |
| 34 | 15:30 | 113.12 | 15.9% |
| 35 | 16:00 | 127.04 | 17.7% |
| 36 | 16:30 | 131.74 | 17.4% |
| 37 | 17:00 | 131.97 | 15.0% |
| 38 | 17:30 | 141.00 | 12.7% |
| 39 | 18:00 | 147.66 | 10.6% |
| 40 | 18:30 | 161.20 | 9.0% |
| 41 | 19:00 | 196.00 | 7.6% |
| 42 | 19:30 | 211.81 | 6.4% |
| 43 | 20:00 | 215.00 | 6.0% |
| 44 | 20:30 | 223.05 | 6.6% |
| 45 | 21:00 | 225.78 | 6.6% |
| 46 | 21:30 | 228.48 | 7.9% |
| 47 | 22:00 | 227.76 | 8.2% |
| 48 | 22:30 | 214.45 | 7.0% |
Compare your business electricity and gas rates in minutes with INIS Energy Brokers.
Compare rates