I-SEM Daily Briefing — 25 May 2026
Table of Contents
Market Snapshot
| Metric | Value |
|---|---|
| Mean DAM Price | €152.78/MWh |
| Median Price | €132.3/MWh |
| Std Dev | €35.75/MWh |
| Peak Price | €223.0/MWh (18:30) |
| Min Price | €116.6/MWh (13:00) |
| Price Range | €106.4/MWh |
| Periods above €150 | 19 of 48 (40%) |
| Periods above €200 | 11 of 48 (23%) |
| Peak Avg (07–22) | €160.43/MWh |
| Off-peak Avg (22–07) | €140.02/MWh |
| Peak/Off-Peak Spread | €20.41/MWh |
| Wind % of Demand | 3.7% |
| Wind Range | 1.6%–8.5% |
| Mean Demand | 3706 MW |
Price Profile #
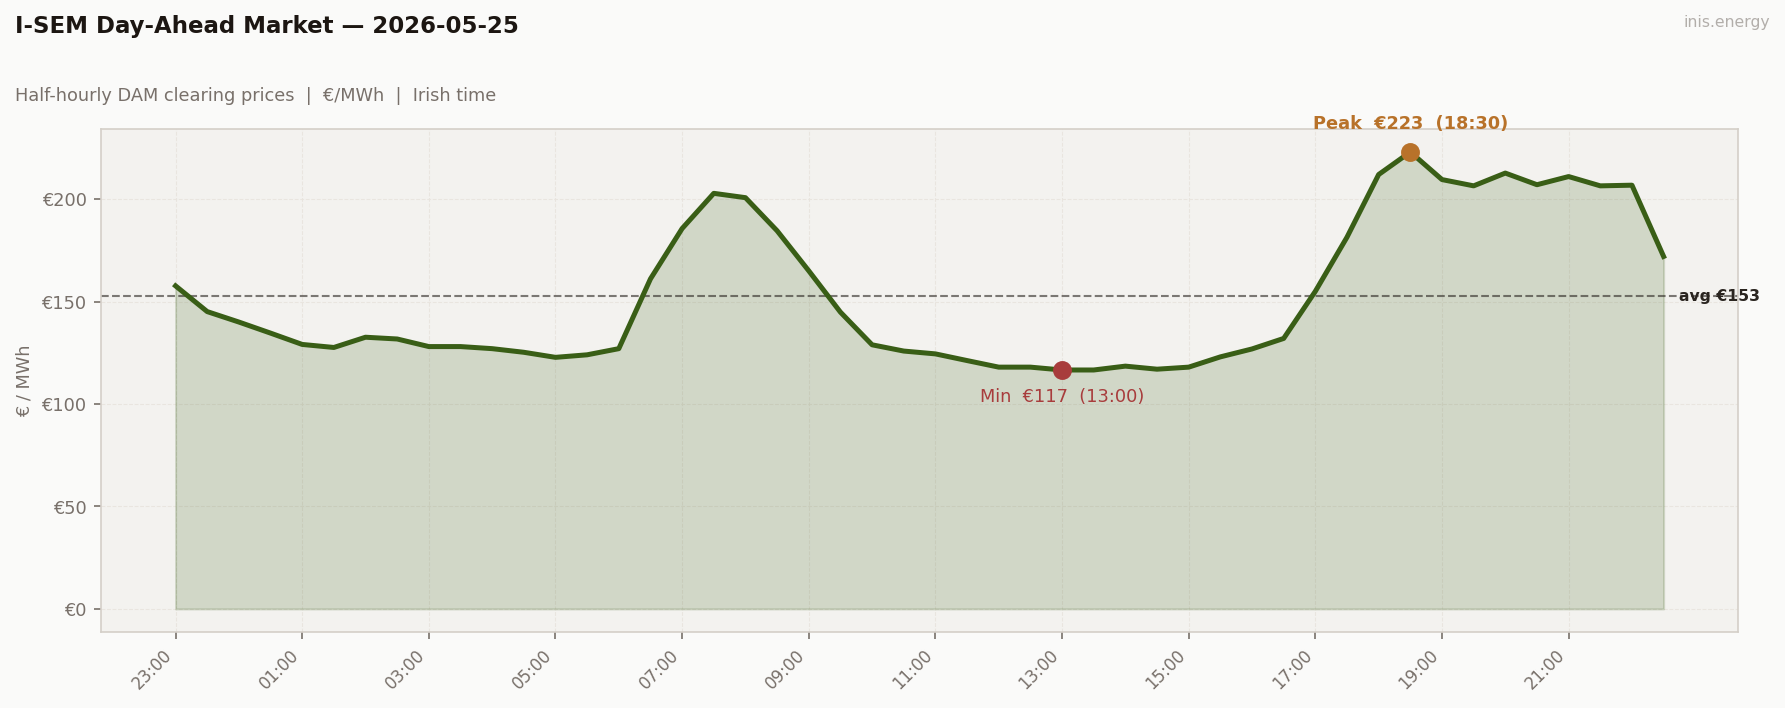
Std dev €35.75/MWh · Median €132.3/MWh · Periods above €150: 19 of 48 (40%)
The wind drought peaks. Mean wind 3.7% — the lowest of the entire 22-day run. Two distinct scarcity events in one day. Mean €152.78, the highest of the run since May 7. The shape carries both a real morning peak and a sustained evening peak — the first day in the series to deliver both at scarcity intensity. Overnight ran €123–158 (high floor — wind essentially absent overnight too, gas setting price at low demand). Morning ramp climbed from €127 at 06:00 to €203 at 07:30: +€76 in 90 minutes. The morning peak block (07:30–08:00) averaged €202, with 3 periods clearing above €200. By 10:00 prices fell back to €129. Midday belly held €117–128 from 11:00 to 16:00 — a real relative trough even with no wind, because daytime demand on a bank holiday is suppressed. Then the evening built relentlessly: €127 at 16:00 → €155 at 17:00 → €212 at 18:00 → €223 at 18:30, and held above €200 across 8 consecutive half-hours from 18:00 to 22:00. The evening peak window averaged €211 across that 4-hour stretch. 11 of 48 periods cleared above €200 — the third-highest scarcity count of the run, behind May 6 (16) and May 18 (8 in one block).
Price vs Wind #
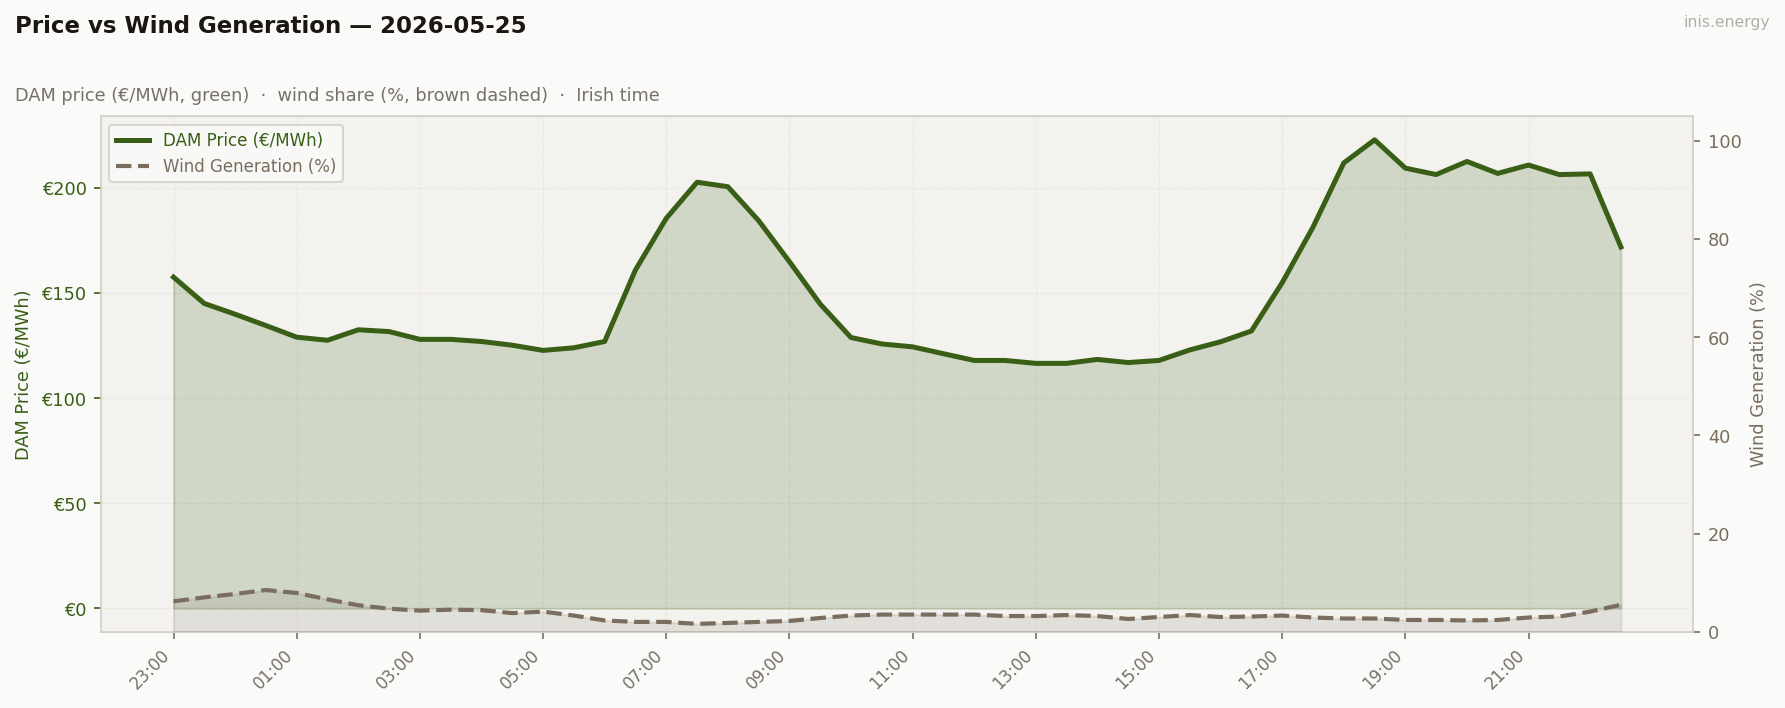
Mean wind: 3.7% · Range: 1.6%–8.5%
Wind essentially didn’t blow. 1.6–8.5% across the entire 24-hour window. This is the strongest wind drought in the run, beating May 6’s 3.8% and matching the May 18 morning regime. What’s notable is that demand was suppressed (3,706 MW vs 3,950+ on working days) — yet the day still produced 11 periods above €200 and a mean €30 above the working-week average. The wind drought overwhelmed the demand suppression. Compare to May 4, the previous bank holiday in the run: similar demand suppression, similar low wind (13% — much higher than today), and that day produced no scarcity at all (peak €213, only the late evening). Today is what May 4 would have been if wind had been 9 percentage points worse. The salary-signal observation: at 5% wind on the I-SEM, demand level barely matters. The merit order is dominated by thermal cost across all demand conditions, and any demand peak — even a suppressed one — pulls clearing prices into peaker territory. The marginal supply curve becomes a step function at low-wind conditions, and the step location depends on which plants are available, not on whether it’s a working day.
Week in Context #
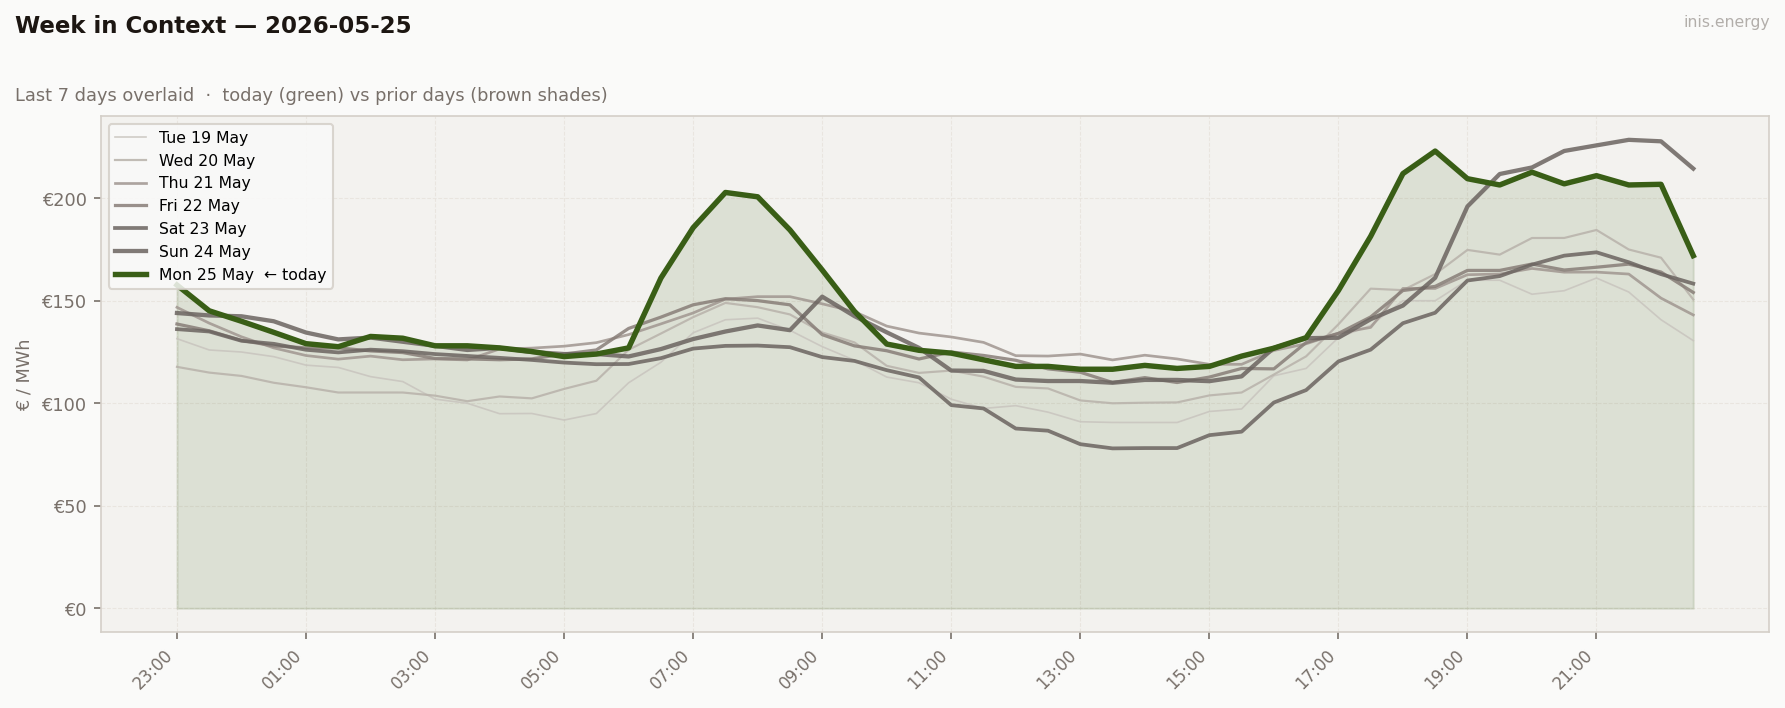
A four-day wind decline: 31% → 16% → 4% → and tomorrow’s 7%. The wind regime broke after May 22 and hasn’t recovered. The May 4–7 wind-drought pattern is repeating.
Price Duration Curve #
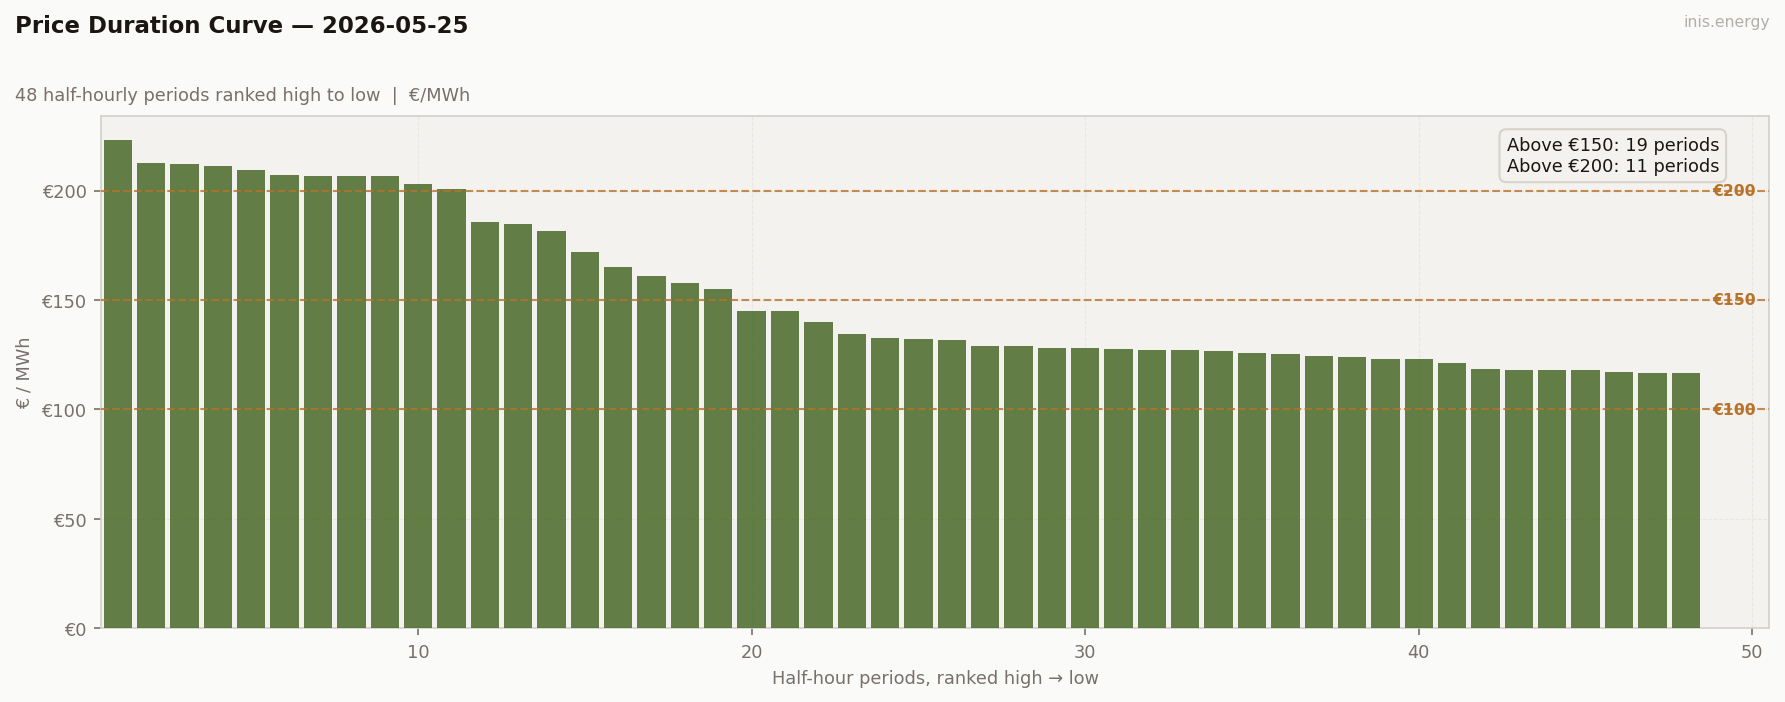
The curve has a double-plateau shape: a top plateau (8 periods €200–223 — the evening cluster), a secondary shelf (3 periods €185–203 — the morning cluster), and a long cheap tail (28 periods €117–145). Two distinct scarcity bands separated by a gentle slope. This is the wind-drought working-day archetype — the May 6 PDC re-rendered. Most days in the May 19–23 wind-rich working-day cluster produced PDCs with a single moderate top shoulder. Today’s PDC has two real top steps, because there were two genuine scarcity events. The shape signals a tradeable opportunity at both ends of the day, which the dispatch optimiser will need to choose between (more below).
Periods above €150: 19 (40% of day) · Above €200: 11 (23% of day)
Peak / Off-Peak Spread #
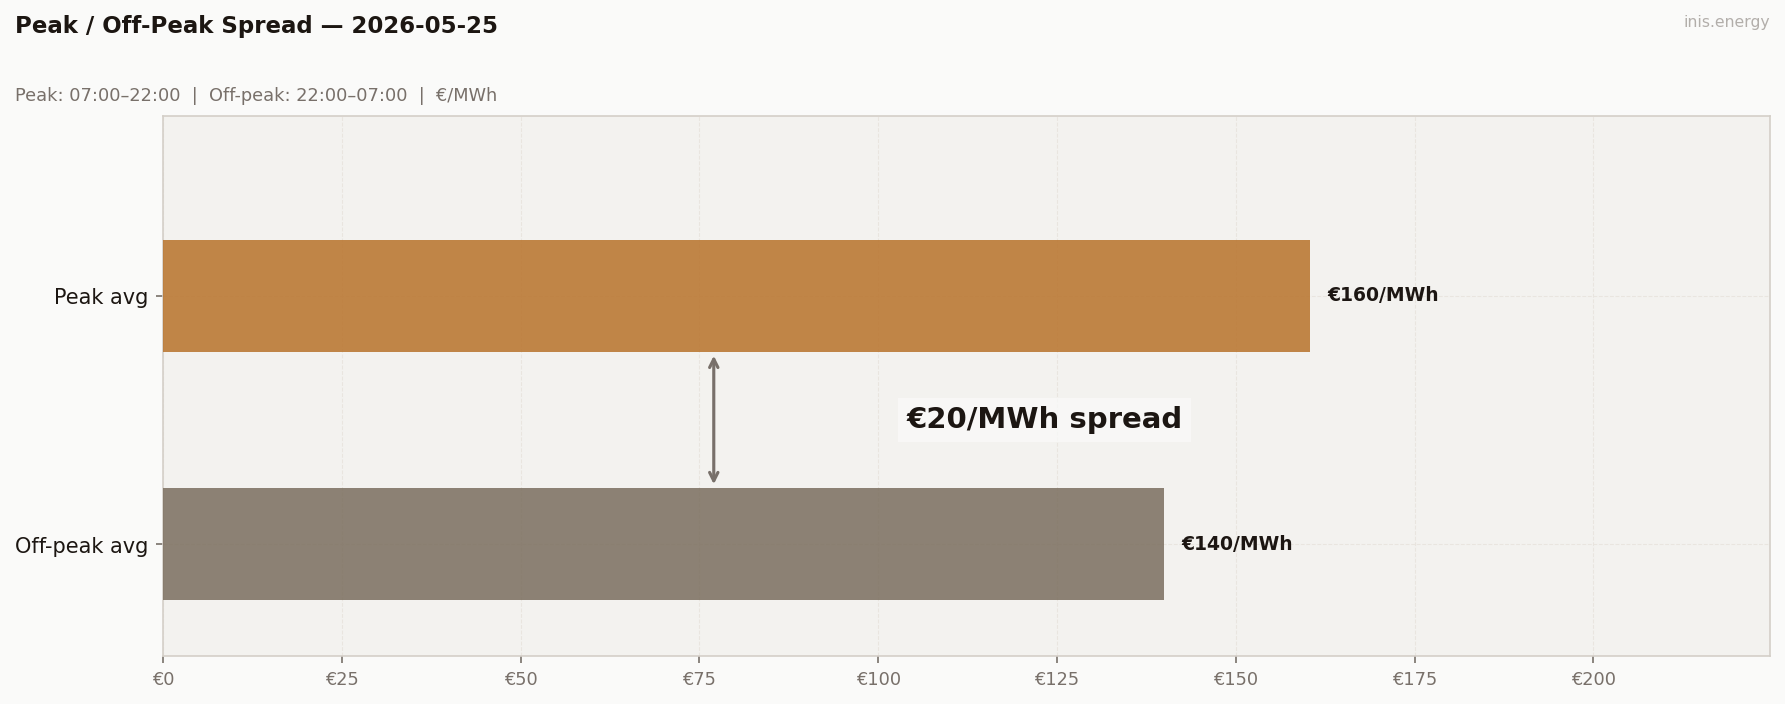
Peak avg (07:00–22:00): €160.43/MWh · Off-peak avg: €140.02/MWh · Spread: €20.41/MWh
Spread €20.41 — back to honest territory after three consecutive days of metric misalignment. Peak avg €160.43, off-peak avg €140.02. The peak window contains both the morning and evening scarcity clusters; the off-peak window catches the overnight floor (which today wasn’t cheap — €123–158, gas-marginal). The spread is real, modest, and aligned with the captured spread the optimiser actually found (€96). The metric works on this day because the cheap hour is overnight in some sense — the bottom of the day is the cheapest, and the bottom of the day falls inside the off-peak window. The midday trough at €117 still lives inside the peak window but it isn’t as deep as the scarcity bands are tall, so the peak window averages out higher. Standard reading restored. Peak avg (07:00–22:00): €160.43/MWh · Off-peak avg: €140.02/MWh · Spread: €20.41/MWh
BESS Dispatch Signal #
| Price | Time | Energy | Value | |
|---|---|---|---|---|
| Charge | €117/MWh | 13:00 | 2 MWh | −€234 |
| Discharge | €213/MWh | 18:30 | 1.7 MWh (85% RTE) | +€362 |
| Gross profit | €128 | |||
| Price spread | €96/MWh | ROI: 54.5% |
Simulated 1MW/2MWh battery, one optimal DAM cycle. Gross before network charges and capacity costs.
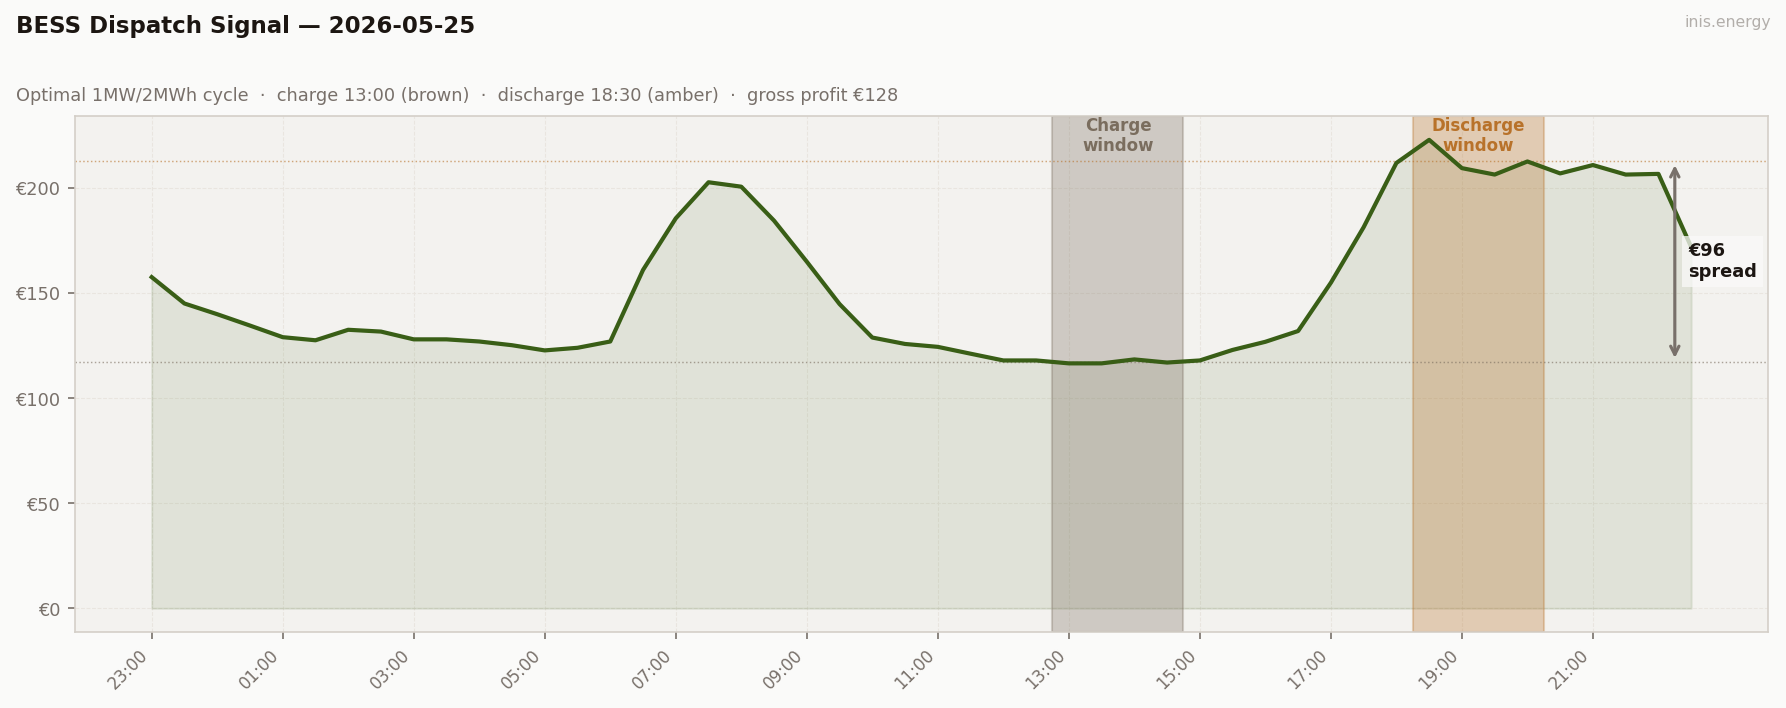
€128 gross. The optimiser had two genuine discharge options today (morning and evening), and the evening narrowly won. Morning peak block (07:00–08:30) averaged €193. Evening peak block (18:00–19:30) averaged €212. €19/MWh of difference on the discharge side, and the optimiser picked the higher one — discharge at €213 across 18:30–20:00. What’s interesting is the quality of the morning peak. The morning produced three periods above €200; the evening produced the higher-priced four-period block. A real BESS operator using a two-cycle-per-day strategy could have captured both — charging overnight (€122–127 average), discharging into the morning peak (€200+), recharging in the midday trough (€117), and discharging into the evening peak (€213). The single-cycle model misses the second cycle that’s structurally available on double-peak days. This is a research note worth flagging: the simulation assumes one DAM cycle. On 11/48-above-€200 days like today, two cycles is the optimal strategy. The €128 the model reports is a lower bound — a two-cycle dispatch could realistically have added another €50–80 of gross revenue. Single-cycle dispatch is the right baseline for storage assets with 2-hour duration; longer-duration assets (4h+) leave revenue on the table by cycling once.
Commentary #
The wind drought peaks. Mean wind 3.7% — the lowest of the 22-day run — and the I-SEM produced two distinct scarcity events: a morning peak topping €203 at 07:30, and an evening peak holding €200+ across 8 consecutive half-hours from 18:00 to 22:00. 11 of 48 periods cleared above €200; mean lifted €9 to €152.78. This is the May 6 archetype: wind essentially absent, gas pricing both peaks, demand suppression failing to save the day. The bank holiday comparison is the structural point. May 4 — the previous bank holiday in the run — saw similar demand (3,633 MW) and 13% wind, and produced zero scarcity prints (peak €213, mean €152.58). May 25 — today — sees 3,706 MW demand (50 MW higher, statistical noise) and 3.7% wind, and produces 11 scarcity prints (peak €223, mean €152.78). Same mean price, very different intra-day shape. €30 of mean — coincidence; what makes today an analytically significant day is the 11 above €200, where May 4 had 0. The 9 percentage points of wind difference between two bank holidays produced 11 scarcity hours. For storage, €128 gross. The day delivered two real discharge options — morning and evening — and the single-cycle model picked the evening. Worth noting: an 11-above-€200 day is structurally a two-cycle day. The single-cycle BESS model captured €128; a two-cycle dispatch on the same data could plausibly have added €50–80. Days where the simulation is a clean lower bound are the days where forecasting and dispatch strategy on real assets earn the most. This is one of them.
Half-hourly data — 2026-05-25
| Period | Time | Price (€/MWh) | Wind % |
|---|---|---|---|
| 1 | 23:00 | 157.66 | 6.2% |
| 2 | 23:30 | 145.10 | 7.0% |
| 3 | 00:00 | 140.00 | 7.7% |
| 4 | 00:30 | 134.60 | 8.5% |
| 5 | 01:00 | 129.07 | 7.9% |
| 6 | 01:30 | 127.59 | 6.6% |
| 7 | 02:00 | 132.59 | 5.4% |
| 8 | 02:30 | 131.73 | 4.7% |
| 9 | 03:00 | 128.03 | 4.3% |
| 10 | 03:30 | 128.03 | 4.5% |
| 11 | 04:00 | 127.01 | 4.4% |
| 12 | 04:30 | 125.24 | 3.8% |
| 13 | 05:00 | 122.77 | 4.1% |
| 14 | 05:30 | 124.01 | 3.3% |
| 15 | 06:00 | 127.01 | 2.3% |
| 16 | 06:30 | 161.06 | 2.0% |
| 17 | 07:00 | 185.64 | 2.0% |
| 18 | 07:30 | 202.81 | 1.6% |
| 19 | 08:00 | 200.70 | 1.8% |
| 20 | 08:30 | 184.54 | 2.0% |
| 21 | 09:00 | 165.00 | 2.2% |
| 22 | 09:30 | 144.83 | 2.8% |
| 23 | 10:00 | 128.89 | 3.3% |
| 24 | 10:30 | 125.84 | 3.5% |
| 25 | 11:00 | 124.46 | 3.5% |
| 26 | 11:30 | 121.20 | 3.5% |
| 27 | 12:00 | 117.99 | 3.5% |
| 28 | 12:30 | 117.99 | 3.2% |
| 29 | 13:00 | 116.60 | 3.2% |
| 30 | 13:30 | 116.60 | 3.4% |
| 31 | 14:00 | 118.48 | 3.2% |
| 32 | 14:30 | 116.99 | 2.6% |
| 33 | 15:00 | 117.99 | 3.0% |
| 34 | 15:30 | 123.00 | 3.4% |
| 35 | 16:00 | 126.87 | 3.0% |
| 36 | 16:30 | 132.00 | 3.1% |
| 37 | 17:00 | 155.00 | 3.3% |
| 38 | 17:30 | 181.42 | 2.9% |
| 39 | 18:00 | 212.00 | 2.7% |
| 40 | 18:30 | 223.00 | 2.7% |
| 41 | 19:00 | 209.53 | 2.4% |
| 42 | 19:30 | 206.47 | 2.4% |
| 43 | 20:00 | 212.70 | 2.3% |
| 44 | 20:30 | 207.02 | 2.4% |
| 45 | 21:00 | 211.00 | 2.9% |
| 46 | 21:30 | 206.47 | 3.1% |
| 47 | 22:00 | 206.79 | 4.1% |
| 48 | 22:30 | 172.00 | 5.5% |
Compare your business electricity and gas rates in minutes with INIS Energy Brokers.
Compare rates