I-SEM Daily Briefing — 26 May 2026
Table of Contents
Market Snapshot
| Metric | Value |
|---|---|
| Mean DAM Price | €151.18/MWh |
| Median Price | €140.65/MWh |
| Std Dev | €26.04/MWh |
| Peak Price | €212.05/MWh (07:30) |
| Min Price | €119.0/MWh (13:30) |
| Price Range | €93.05/MWh |
| Periods above €150 | 20 of 48 (42%) |
| Periods above €200 | 2 of 48 (4%) |
| Peak Avg (07–22) | €154.49/MWh |
| Off-peak Avg (22–07) | €145.65/MWh |
| Peak/Off-Peak Spread | €8.84/MWh |
| Wind % of Demand | 6.6% |
| Wind Range | 2.0%–23.0% |
| Mean Demand | 3789 MW |
Price Profile #
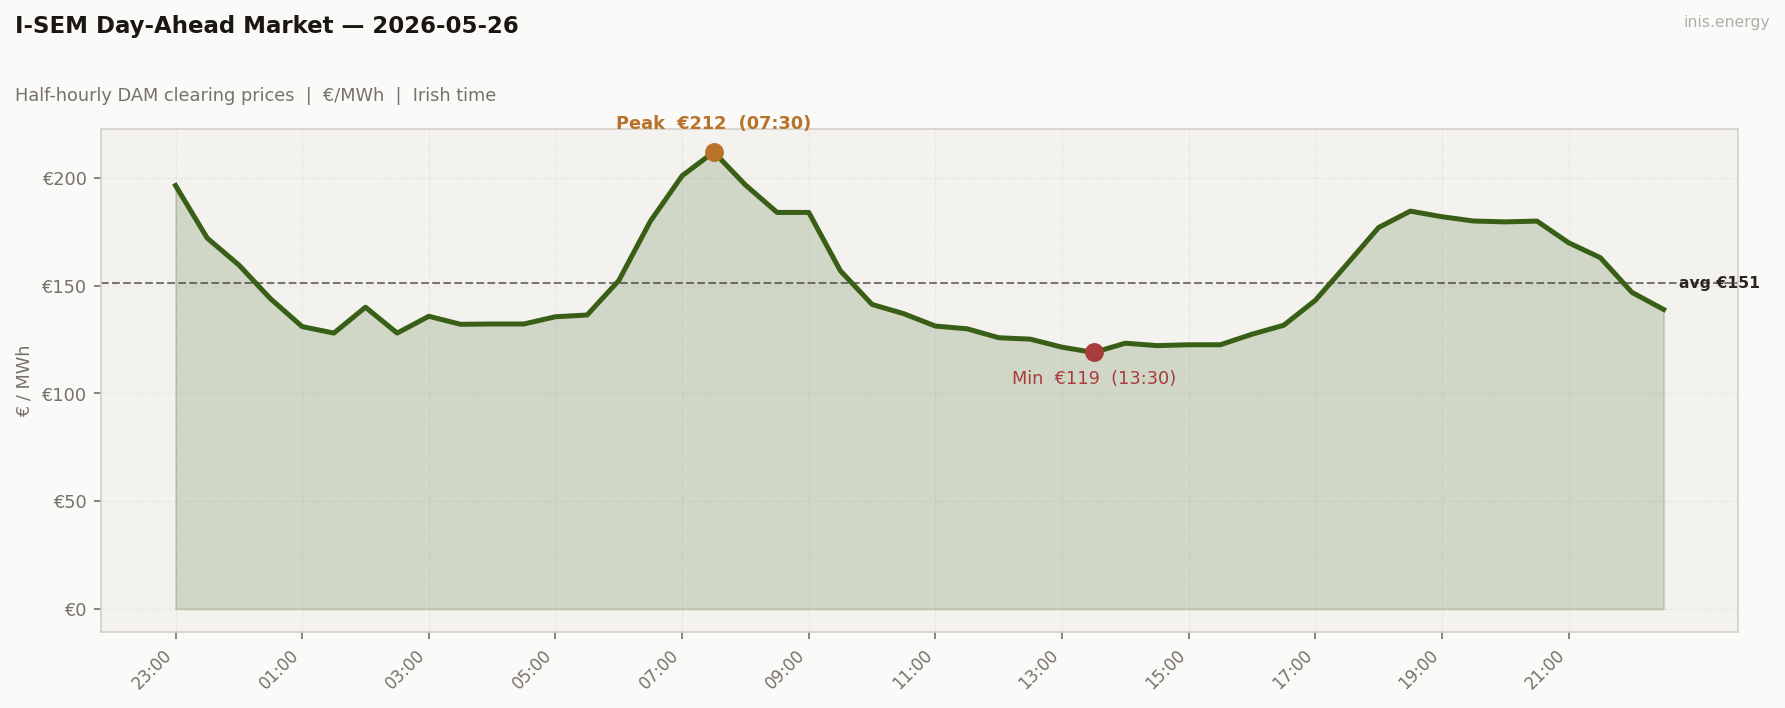
Std dev €26.04/MWh · Median €140.65/MWh · Periods above €150: 20 of 48 (42%)
Tuesday after a bank holiday, with the wind drought continuing. Mean €151.18 (basically level with yesterday’s €152.78). The structural feature: a morning-dominated day, where the morning peak outran the evening for the first time since May 18. Periods 1–2 (23:00–23:30) at €196 and €172 are the familiar SEM day boundary issue — these prices are Monday’s evening peak spilling into Tuesday’s file. From 00:00 onward the “real” Tuesday begins: overnight floor €128–160, climbing into the morning. Morning ramp climbed €127 at 06:00 → €212.05 at 07:30 — the day’s peak. The morning peak block (07:00–08:30) averaged €198, with both periods at 07:30 and 08:00 clearing above €200. By 10:00 the morning peak had collapsed to €141. Midday belly held €119–128 from 11:00 to 15:30, with the floor at €119.00 at 13:30. The evening then built a contained second peak — €127 at 16:00 → €184 at 18:30 — and held €179–184 across 19:00 to 20:30. Notably, the evening peak failed to clear €200, despite mean wind being 6.6%. The evening shoulder wasn’t deep enough to break into peakers. 20 of 48 periods cleared above €150 (the highest count of the run); 2 above €200 (both in the morning block).
Price vs Wind #
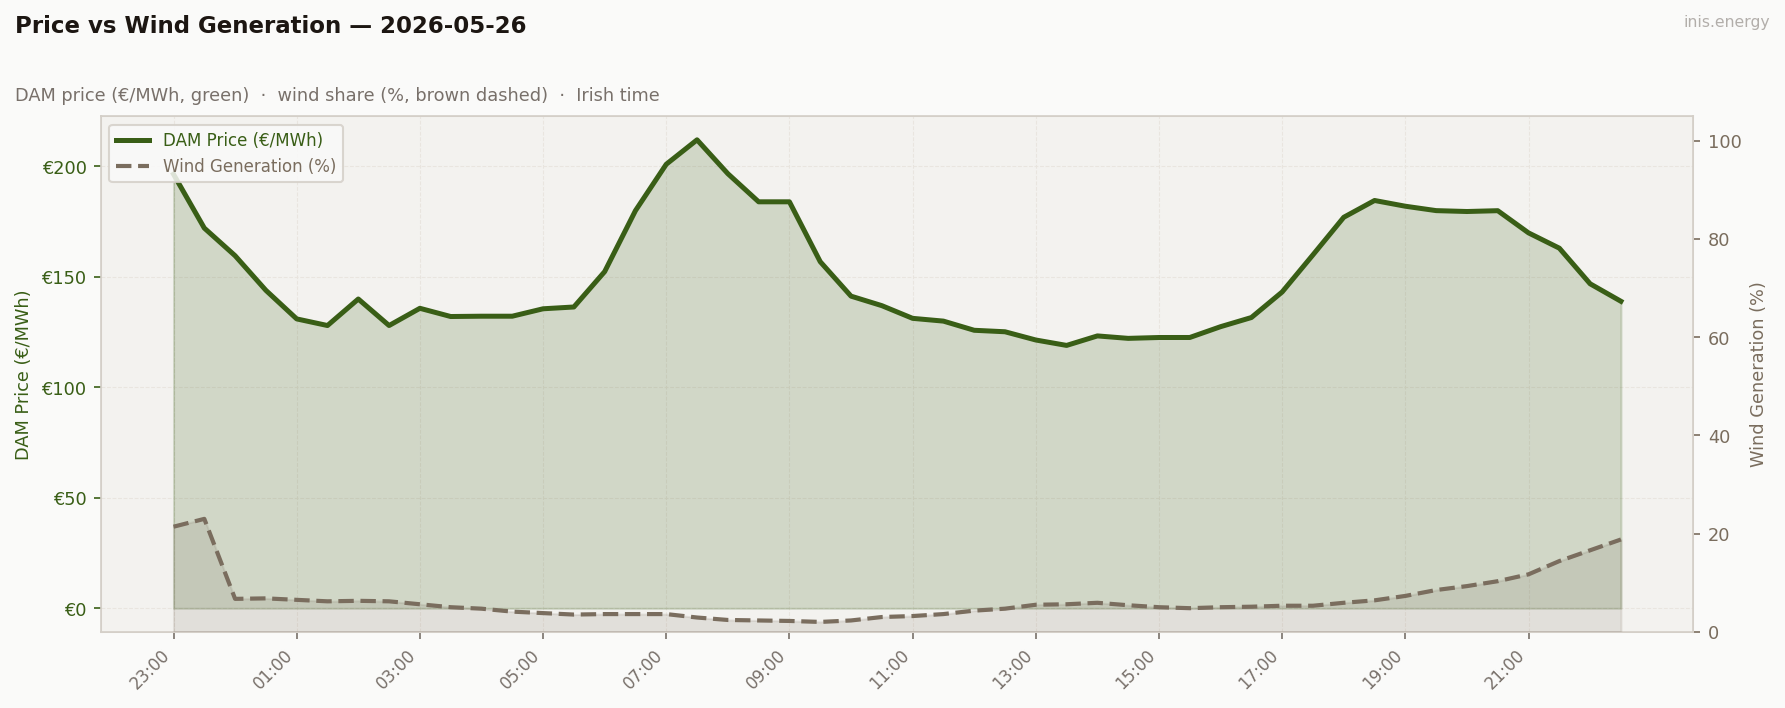
Mean wind: 6.6% · Range: 2.0%–23.0%
Two-decline wind shape, with a sharper morning shortfall than evening one — the inverse of May 18. Wind started elevated at 21–23% in the boundary periods (Monday’s tail), then immediately dropped to 6–7% overnight and stayed essentially absent through the working day (2–6%). It then recovered through the late evening (8% at 20:00 → 19% by 22:30). The morning peak landed in the absolute wind trough (2–3% from 07:00 to 09:30); the evening peak landed in slightly better but still poor wind (5–9% from 18:00 to 20:00). The differential matters. May 18 had a similar profile but in reverse: morning at 1% wind produced €255; evening at 50% wind capped at €162. May 26 has morning at 3% wind producing €212; evening at 6–9% wind producing €184. The relative depth of the wind shortfall in each window dictates which peak wins — and the optimiser will follow the depth, not the calendar. Removing the boundary periods, the corrected mean wind for the “real” Tuesday is around 5% — placing this day inside the May 25 wind-drought regime. The drought is two days deep and still building.
Week in Context #
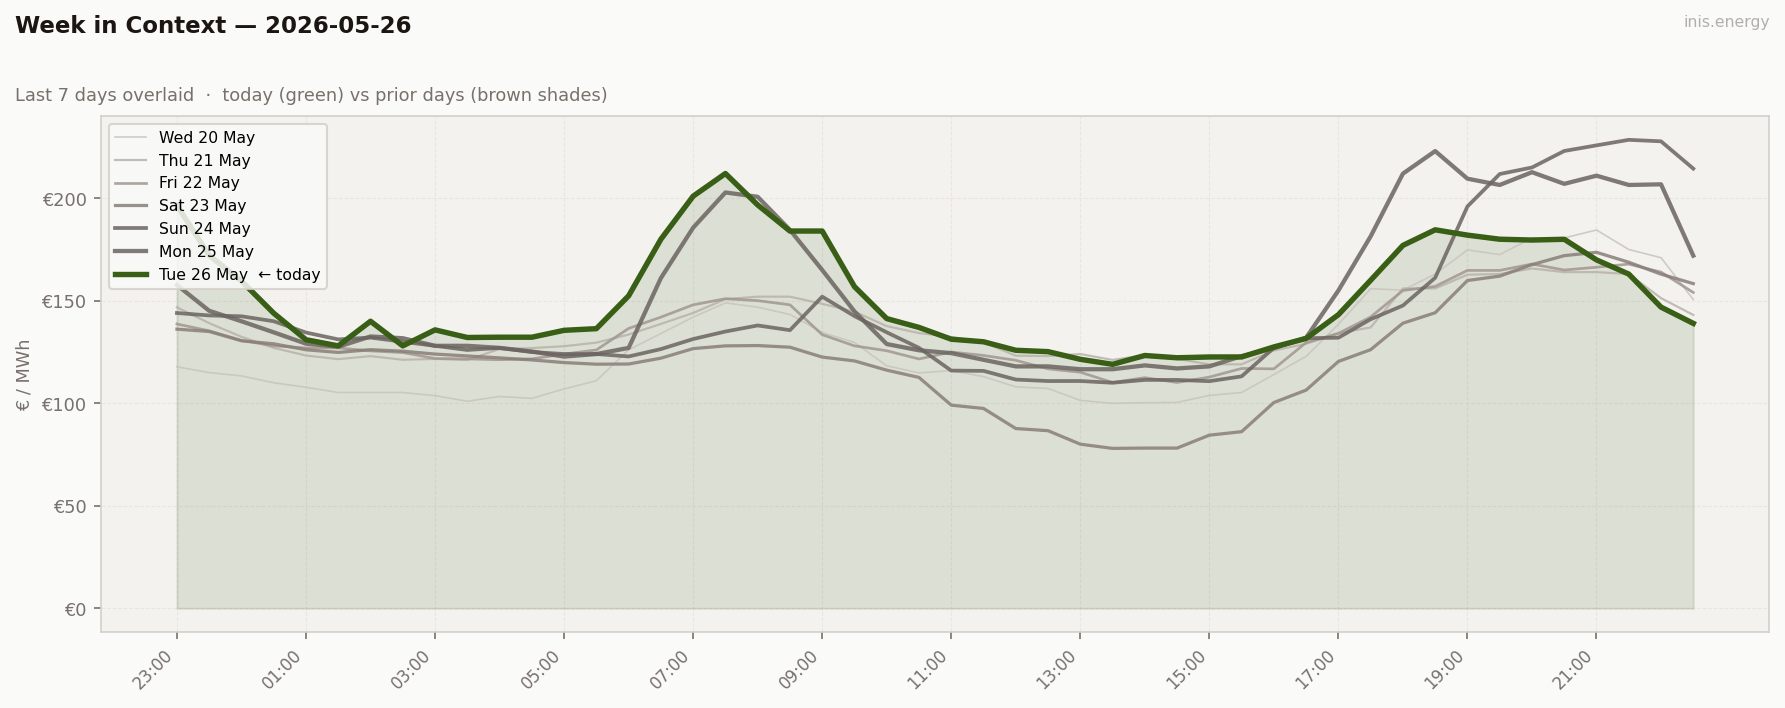
Wind: 31% Saturday → 16% Sunday → 4% Monday → ~5% Tuesday (corrected). Four-day wind decline, no recovery yet. Compare to the May 4–7 wind drought (13% → 8.5% → 3.8% → 11%) — the current drought is now structurally deeper than that one.
Price Duration Curve #
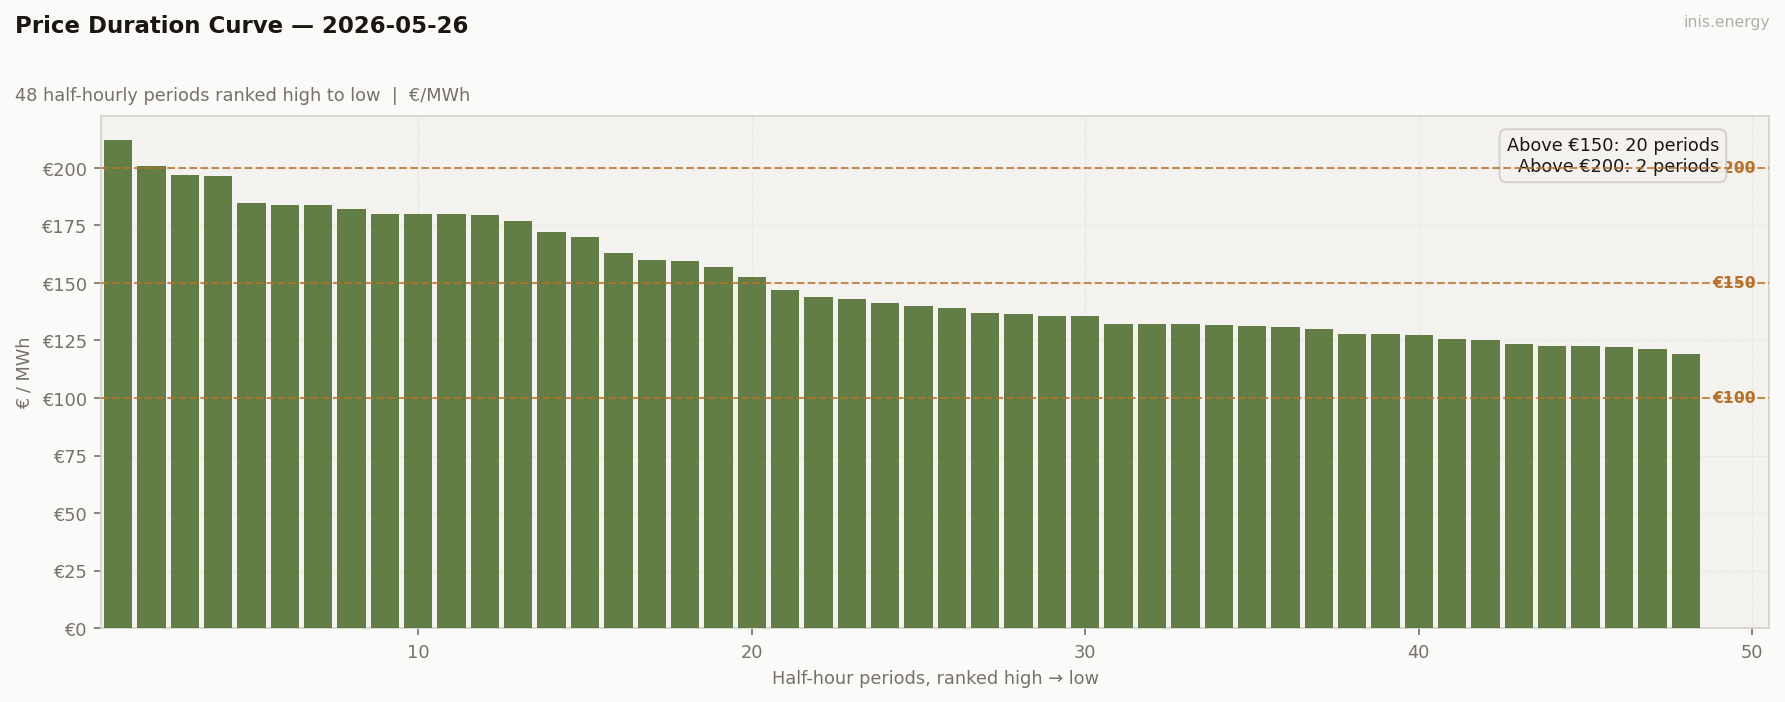
Periods above €150: 20 (42% of day) · Above €200: 2 (4% of day)
Today’s PDC has a sharp morning-peak spike at the top (2 periods €201–212), then a smooth, gradual descent through 18 periods in the €150–200 band (the evening cluster + boundary spillover), and a moderate tail of 28 periods between €119 and €150. The most periods above €150 of the entire 22-day run — but only 2 above €200, because the evening peak couldn’t quite reach peaker territory. This is the “high-and-moderate” archetype — sustained elevated prices across the day with limited scarcity at the top. Compare to May 5’s PDC (high-and-flat, 6 periods above €200, no real trough). Today has a real trough (€119) and more time spent above €150, but less true scarcity. A high-priced day for everyone — but not a top-tier BESS day, because what storage wants is a wider gap between trough and peak, not a higher floor.
Peak / Off-Peak Spread #
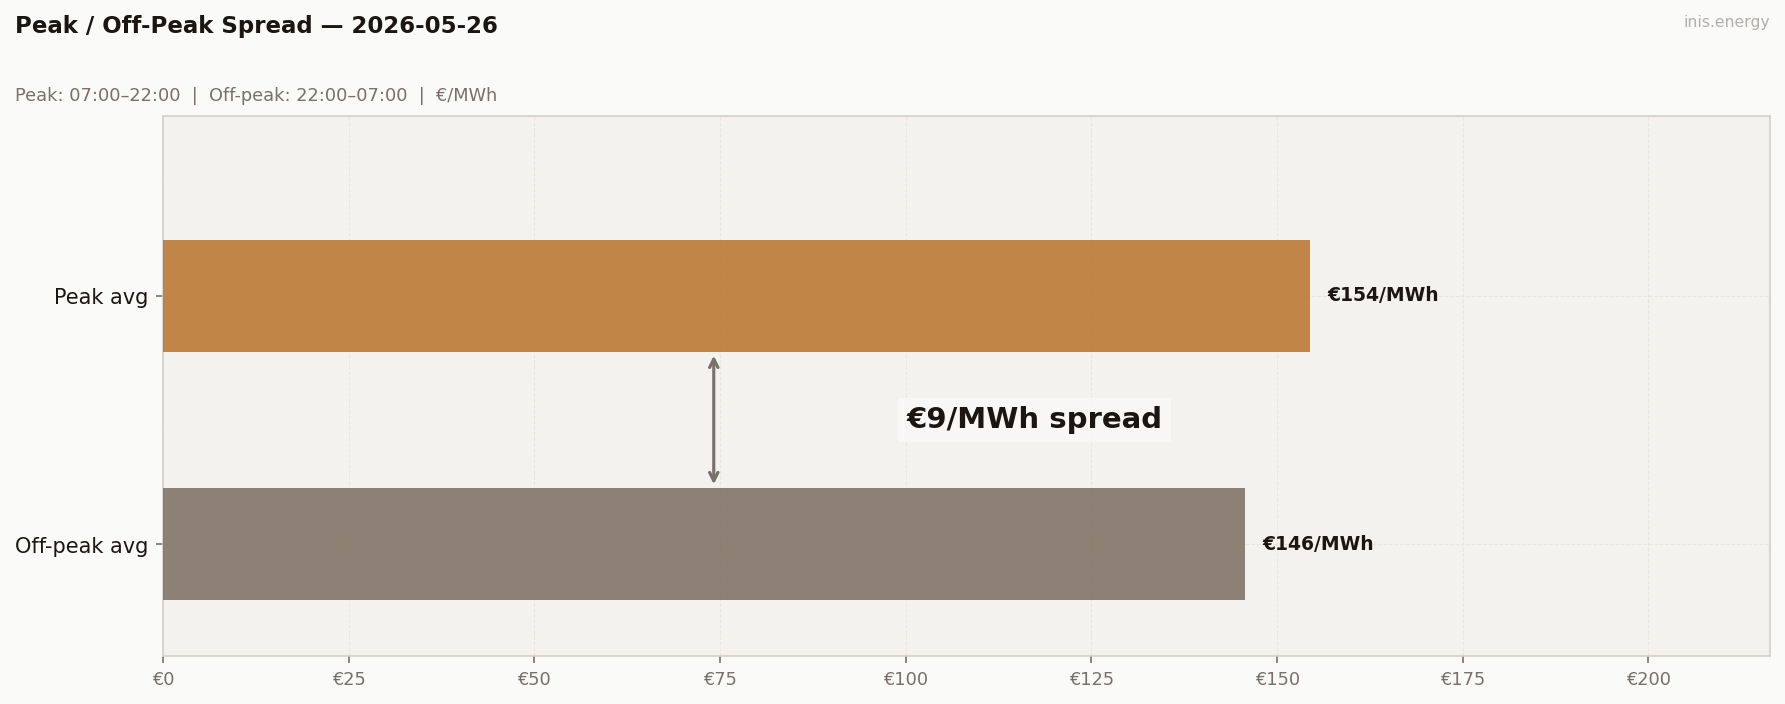
Peak avg (07:00–22:00): €154.49/MWh · Off-peak avg: €145.65/MWh · Spread: €8.84/MWh
Spread €8.84 — a small number that this time genuinely understates the day. Peak avg €154.49, off-peak avg €145.65. The peak window contains the morning peak block (€198 average), the midday trough (€122 average), and the evening peak (€181 average) — three distinct events that the averaging dilutes. The off-peak window contains the boundary spillover at the start (€196 → €172) and the overnight floor (€128–160), and comes out higher than usual. The captured spread the BESS actually earned was €77 — between a €121 midday charge and a €198 morning discharge. The peak/off-peak metric reported €9. The captured spread is closer to nine times the headline spread.
BESS Dispatch Signal #
| Price | Time | Energy | Value | |
|---|---|---|---|---|
| Charge | €121/MWh | 13:00 | 2 MWh | −€243 |
| Discharge | €182/MWh | 18:30 | 1.7 MWh (85% RTE) | +€309 |
| Gross profit | €66 | |||
| Price spread | €60/MWh | ROI: 27.0% |
Simulated 1MW/2MWh battery, one optimal DAM cycle. Gross before network charges and capacity costs.
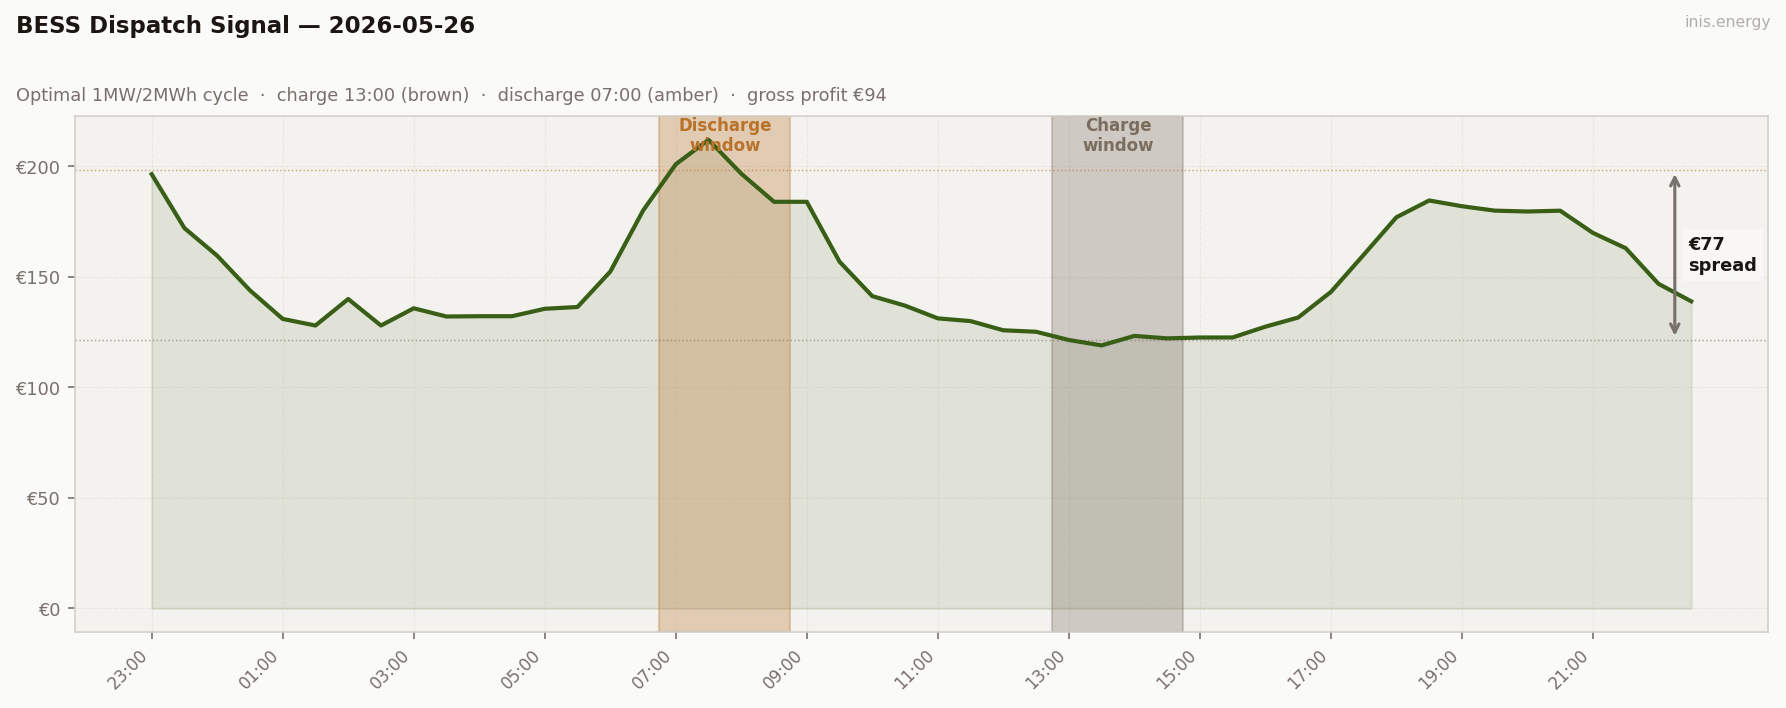
Updated 2026-08-27: the BESS simulation previously allowed the discharge window to occur before the charge window ended, which is physically impossible for a battery — in this case, by picking the 07:00–08:30 morning peak, which falls before the midday charge. Recalculated enforcing charge-before-discharge; gross profit corrected from €94 to €66.
€66 gross. The day’s highest-priced block was actually the morning (07:00–08:30, averaging €198.45), beating the evening peak’s best block (18:30–20:00, €184.91) by €13/MWh — but the charge sits in the midday belly (13:00–14:30, €121 avg), after the morning peak has already happened. A same-day cycle can only reach the evening, so today discharges into the lower of the two peaks: €182 average at 18:30.
Commentary #
A working Tuesday inside the wind drought. Mean €151.18 (level with yesterday), and the structural feature is a morning peak that outpriced the evening: wind 2–3% through the morning ramp produced €212 at 07:30, while wind 5–9% through the evening capped the second peak at €184. For a battery, though, the morning peak isn’t reachable — it happens before the midday charge — so the market’s own highest price and the battery’s actual payday are two different windows today. The current wind drought (May 23–26: 31% → 16% → 4% → ~5%) is now structurally deeper than the May 4–7 one and shows no sign of breaking. The boundary periods at 23:00–23:30 (€196, €172 with 21–23% wind) are Monday’s evening peak spilling into Tuesday’s file — the familiar SEM day boundary artifact that keeps appearing on high-volatility transitions. Strip those two periods and Tuesday’s real-day mean wind is closer to 5%. For storage, €66 gross — a modest mid-range day made smaller by causality. The market’s real peak was the morning (€212 at 07:30), but it fell before the midday charge, so the battery could only reach the lower evening peak (€182 at 18:30). The gap between “the day’s best price” and “the best price a same-day cycle can actually capture” is the operational lesson: a real asset with an overnight-charge option would have priced this very differently.
Half-hourly data — 2026-05-26
| Period | Time | Price (€/MWh) | Wind % |
|---|---|---|---|
| 1 | 23:00 | 196.48 | 21.4% |
| 2 | 23:30 | 172.10 | 23.0% |
| 3 | 00:00 | 159.60 | 6.7% |
| 4 | 00:30 | 143.92 | 6.8% |
| 5 | 01:00 | 131.00 | 6.5% |
| 6 | 01:30 | 128.00 | 6.2% |
| 7 | 02:00 | 140.00 | 6.3% |
| 8 | 02:30 | 128.00 | 6.2% |
| 9 | 03:00 | 135.80 | 5.6% |
| 10 | 03:30 | 132.08 | 5.0% |
| 11 | 04:00 | 132.22 | 4.7% |
| 12 | 04:30 | 132.22 | 4.1% |
| 13 | 05:00 | 135.58 | 3.8% |
| 14 | 05:30 | 136.39 | 3.5% |
| 15 | 06:00 | 152.40 | 3.6% |
| 16 | 06:30 | 180.00 | 3.6% |
| 17 | 07:00 | 201.00 | 3.6% |
| 18 | 07:30 | 212.05 | 2.9% |
| 19 | 08:00 | 196.73 | 2.4% |
| 20 | 08:30 | 184.00 | 2.3% |
| 21 | 09:00 | 184.00 | 2.2% |
| 22 | 09:30 | 156.89 | 2.0% |
| 23 | 10:00 | 141.30 | 2.3% |
| 24 | 10:30 | 137.00 | 3.0% |
| 25 | 11:00 | 131.25 | 3.2% |
| 26 | 11:30 | 130.00 | 3.6% |
| 27 | 12:00 | 125.85 | 4.3% |
| 28 | 12:30 | 125.18 | 4.7% |
| 29 | 13:00 | 121.45 | 5.5% |
| 30 | 13:30 | 119.00 | 5.6% |
| 31 | 14:00 | 123.30 | 5.9% |
| 32 | 14:30 | 122.19 | 5.4% |
| 33 | 15:00 | 122.58 | 5.0% |
| 34 | 15:30 | 122.59 | 4.8% |
| 35 | 16:00 | 127.48 | 5.0% |
| 36 | 16:30 | 131.62 | 5.1% |
| 37 | 17:00 | 143.20 | 5.3% |
| 38 | 17:30 | 160.00 | 5.3% |
| 39 | 18:00 | 177.00 | 5.9% |
| 40 | 18:30 | 184.60 | 6.4% |
| 41 | 19:00 | 182.00 | 7.3% |
| 42 | 19:30 | 180.01 | 8.5% |
| 43 | 20:00 | 179.61 | 9.3% |
| 44 | 20:30 | 179.98 | 10.3% |
| 45 | 21:00 | 169.93 | 11.7% |
| 46 | 21:30 | 163.01 | 14.4% |
| 47 | 22:00 | 146.89 | 16.6% |
| 48 | 22:30 | 138.97 | 18.8% |
Compare your business electricity and gas rates in minutes with INIS Energy Brokers.
Compare rates