I-SEM Daily Briefing — 27 May 2026
Table of Contents
Market Snapshot
| Metric | Value |
|---|---|
| Mean DAM Price | €140.81/MWh |
| Median Price | €128.74/MWh |
| Std Dev | €28.7/MWh |
| Peak Price | €227.22/MWh (07:30) |
| Min Price | €113.56/MWh (15:30) |
| Price Range | €113.66/MWh |
| Periods above €150 | 15 of 48 (31%) |
| Periods above €200 | 3 of 48 (6%) |
| Peak Avg (07–22) | €142.27/MWh |
| Off-peak Avg (22–07) | €138.39/MWh |
| BESS Captured Spread | €98/MWh |
| Wind % of Demand | 32.3% |
| Wind Range | 19.3%–46.5% |
| Mean Demand | 3730 MW |
Price Profile #
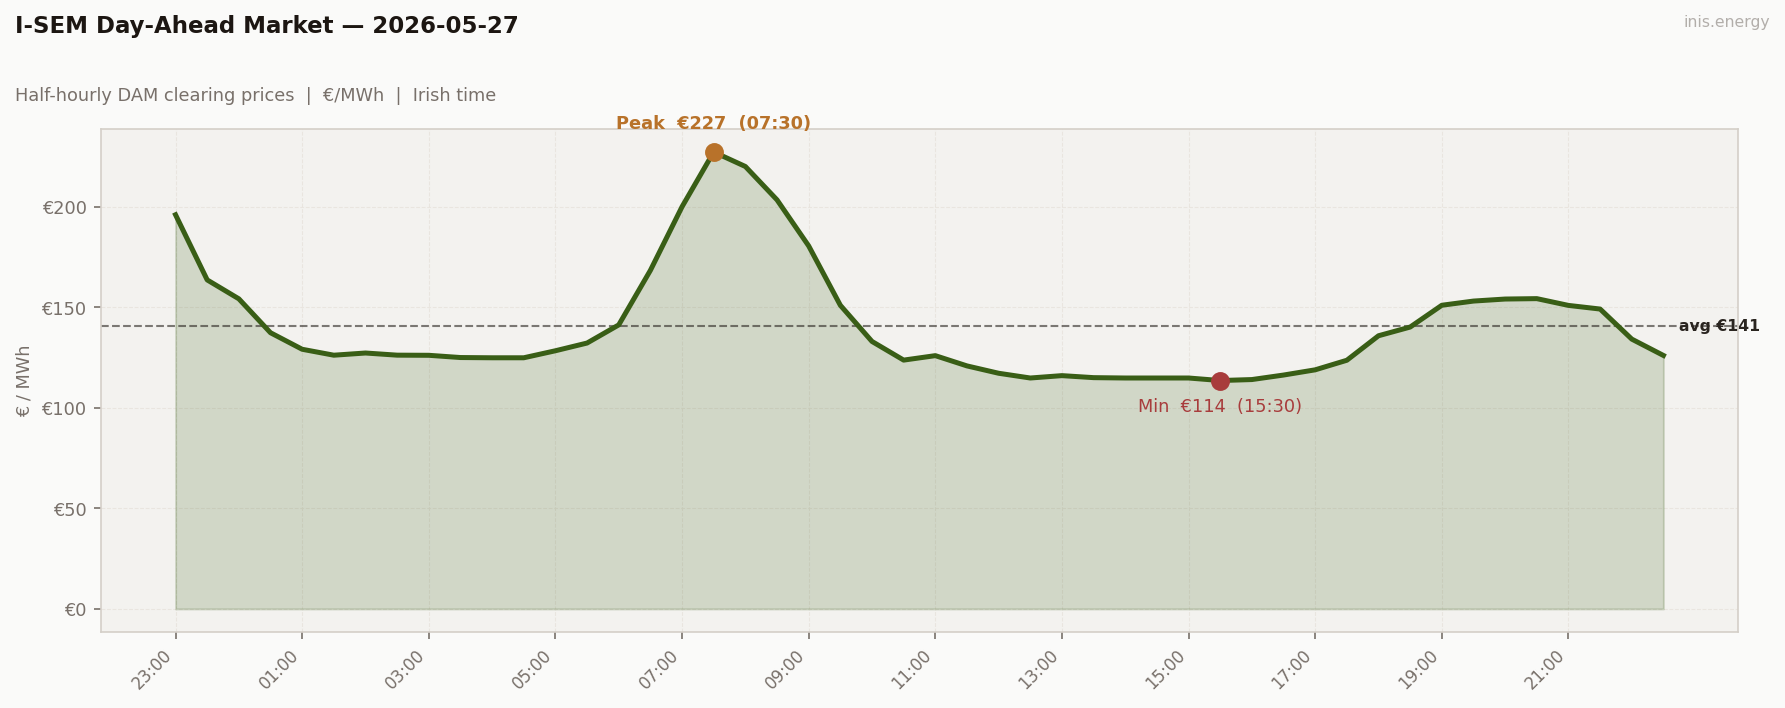
Std dev €28.7/MWh · Median €128.74/MWh · Periods above €150: 15 of 48 (31%)
The wind drought of May 25–26 broke — partially — and the day produced the second-highest morning peak of the entire series at €227.22 at 07:30. Only May 18’s €255 was higher.
Periods 1–2 (€196, €164 at 23:00–23:30 with wind at 42–44%) are Tuesday May 26’s evening peak spilling into Wednesday’s file — the familiar SEM day boundary artifact. The “real” Wednesday begins at 00:00 with €154 and falls cleanly into the overnight floor: €124–141 from 01:00 to 06:30, wind holding 26–34%.
The morning ramp is the structural feature. €141 at 06:00 → €227 at 07:30: +€86 in 90 minutes — the steepest ramp of the run. Three consecutive periods cleared above €200 (07:00–08:00). By 10:00 the morning peak had collapsed to €133. Midday belly held €113–117 from 12:30 to 15:30 (with the floor at €113.56 at 15:30), and the evening built a contained second peak — €114 at 16:00 → €154 at 20:00 — holding €151–154 across 19:00 to 21:00 before fading.
15 of 48 periods cleared above €150; 3 above €200 (all in the morning).
Price vs Wind #
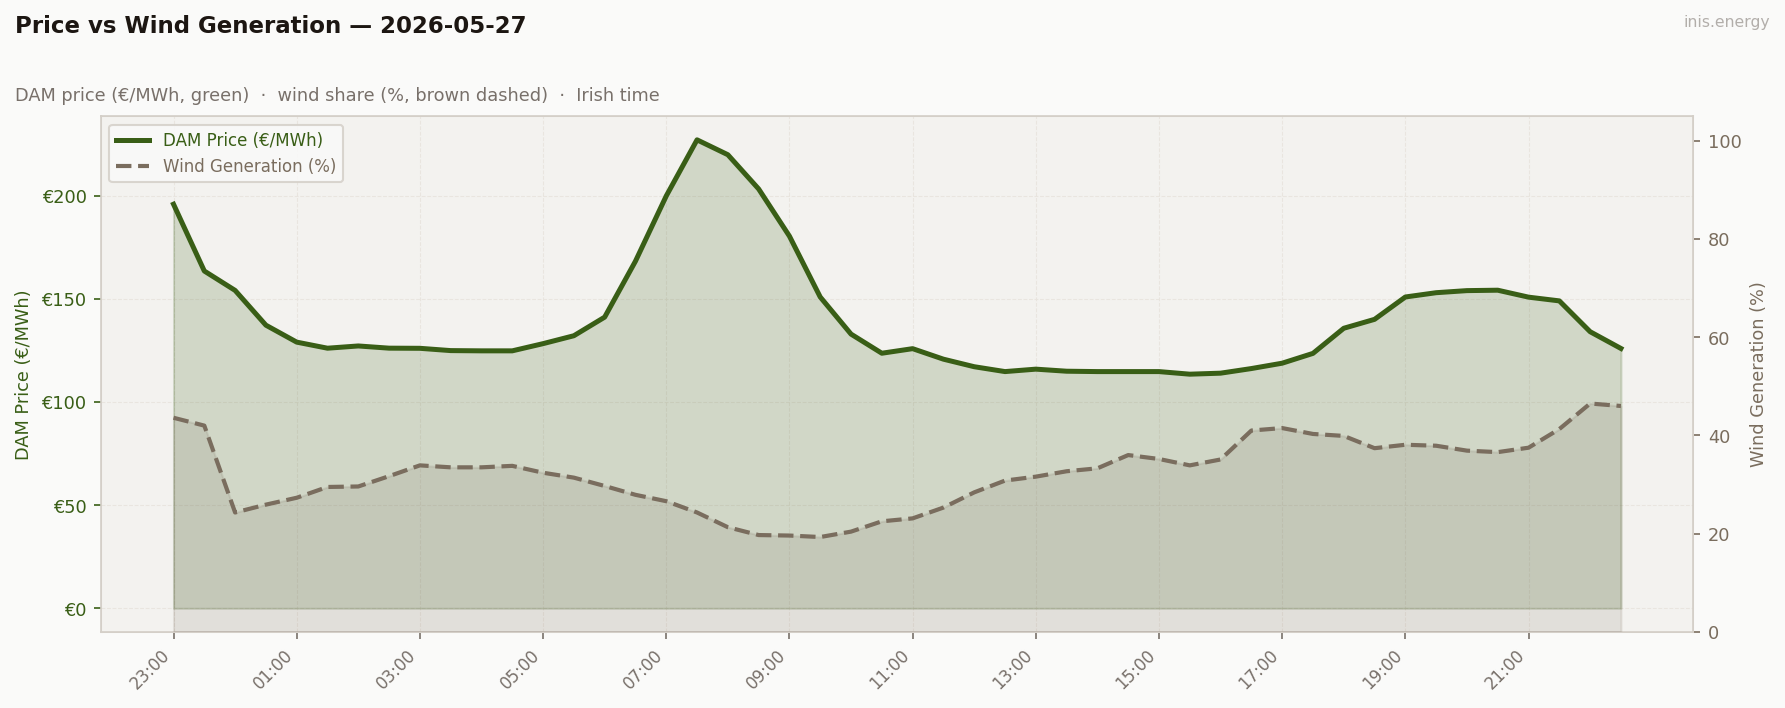
Mean wind: 32.3% · Range: 19.3%–46.5%
A V-into-morning-peak wind shape. Wind started at 42–44% overnight (the Tuesday spillover) and dropped sharply into the morning ramp: 30% at 06:00, 27% at 06:30, 24% at 07:00, 21% at 08:00, 19% at 08:30 — the day’s minimum, sitting right inside the morning peak window. By midday wind had recovered to 30–35%, and held 36–46% through the evening.
This is the inverse of May 28’s wind shape (where wind held high through the evening and dropped only modestly through the morning). May 27 had a sharp morning shortfall and a steady evening — the optimiser will pick morning discharge for the third time in three days.
The mean wind today (32%) is higher than May 26’s 6.6%, but the morning peak (€227) is higher than May 26’s morning peak (€212). This is the wind-shape lesson reinforced: a higher mean with a sharper shortfall produces a higher peak. Mean wind is a poor predictor of peak price. The half-hour with the lowest wind during high demand is what matters.
Week in Context #
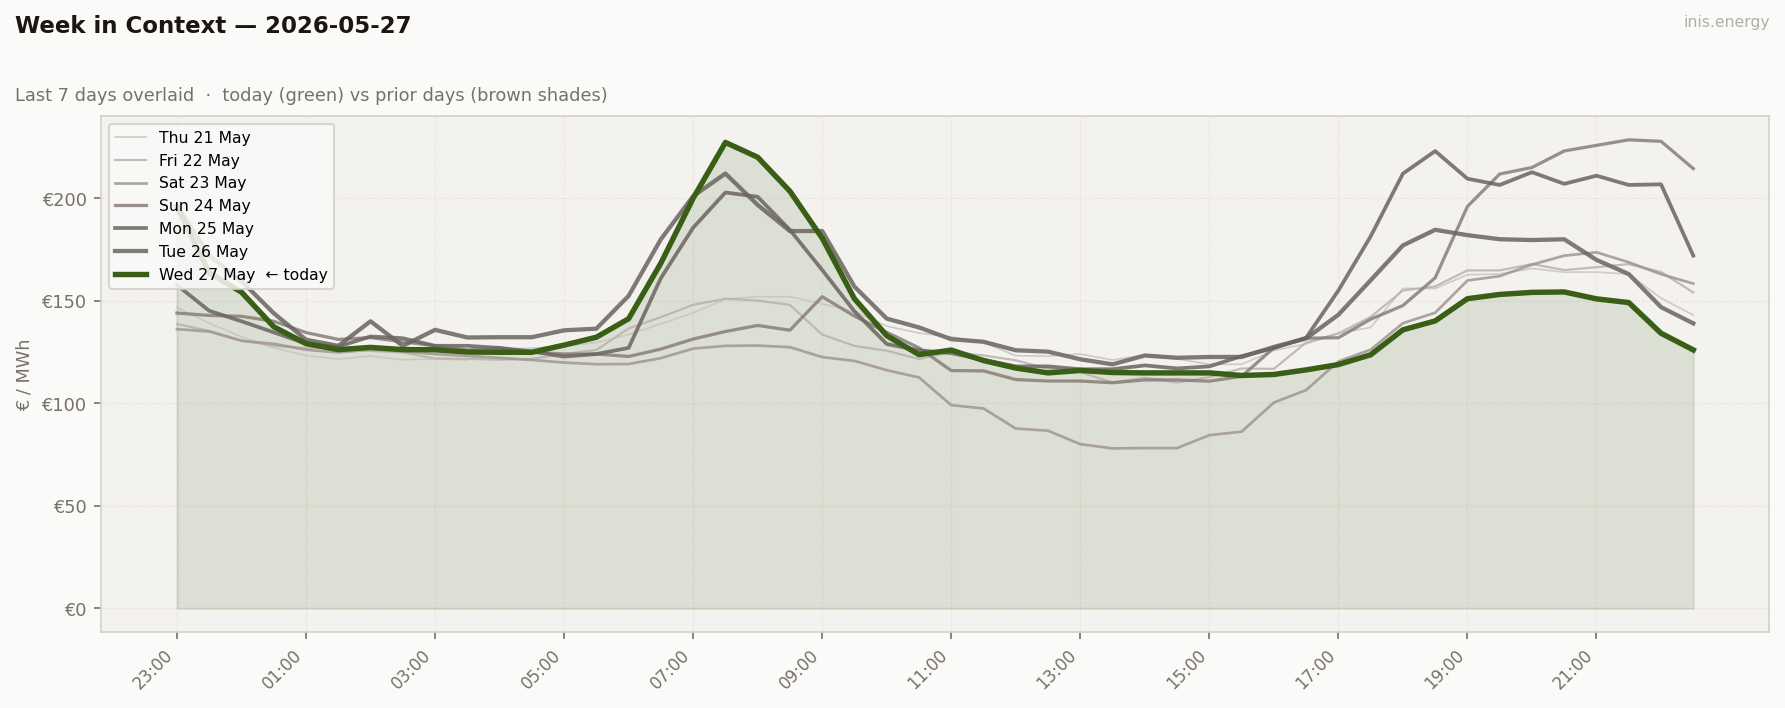
The morning-discharge pattern is now established. May 26, 27, and 28 will all be morning-discharge days. Combined with May 5 and May 18, that’s 5 of 24 days in the series where the morning peak outpriced the evening peak — and all 5 share the same wind signature: low wind in the morning peak demand window.
Price Duration Curve #
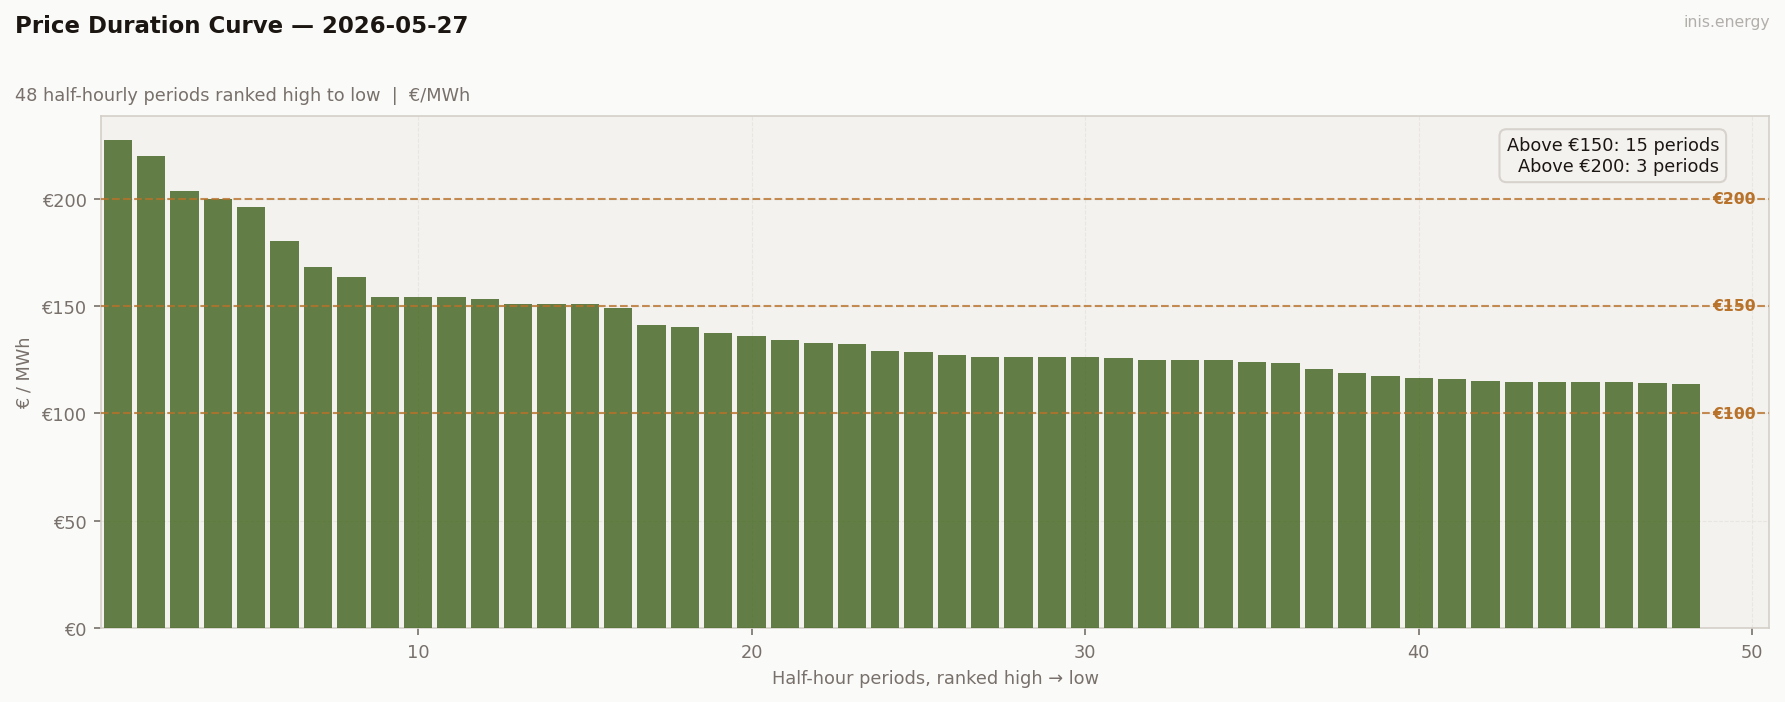
Periods above €150: 15 (31% of day) · Above €200: 3 (6% of day)
The curve has a sharp top spike (3 periods €203–227 — the morning cluster) followed by a smooth gentle slope through the upper-mid range and a moderate cheap tail. The visual signature: most of the day clears in the €115–155 band, with a sharp 3-period excursion at the top.
This is the “morning-spike” archetype — distinct from May 6’s twin-peak PDC or May 18’s broad scarcity plateau. The morning spike is short, sharp, and the rest of the day is unremarkable. A BESS that captures those three periods does well; everything else is filler.
Price Spread #
Captured spread: €39/MWh · Charge: €114/MWh (14:30) · Discharge: €153/MWh (19:00)
BESS Dispatch Signal #
| Price | Time | Energy | Value | |
|---|---|---|---|---|
| Charge | €114/MWh | 14:30 | 2 MWh | −€229 |
| Discharge | €153/MWh | 19:00 | 1.7 MWh (85% RTE) | +€260 |
| Gross profit | €32 | |||
| Price spread | €39/MWh | ROI: 13.9% |
Simulated 1MW/2MWh battery, one optimal DAM cycle. Gross before network charges and capacity costs.
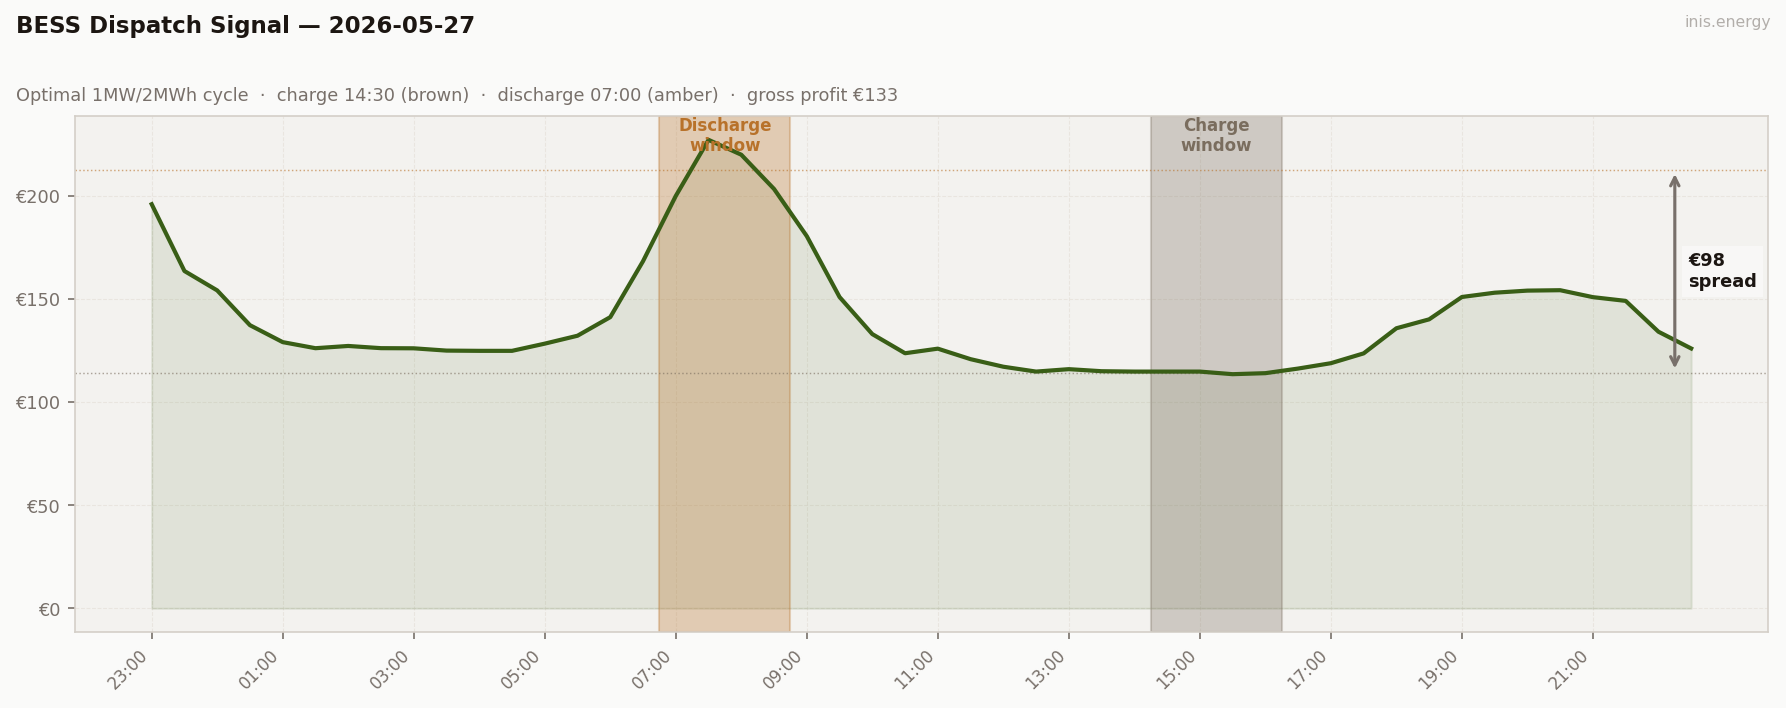
Updated 2026-08-27: the BESS simulation previously allowed the discharge window to occur before the charge window ended, which is physically impossible for a battery — in this case, by picking the 07:00–08:30 morning block, which falls before the afternoon charge. Recalculated enforcing charge-before-discharge; gross profit corrected from €133 to €32.
€32 gross. The morning block (07:00–08:30, €212.65 avg) was the day’s highest-priced window by a wide margin — €60/MWh above the evening block (19:00–20:30, €153.12 avg) — but the charge sits in the afternoon trough (14:30–16:00, €114 avg), after the morning peak has already passed. A same-day cycle can only reach the evening, so today’s captured spread is €39, not the €98 the morning peak would have offered.
Commentary #
The wind drought broke, but only halfway. Mean wind 32% (up from May 26’s 6.6%) — but the timing of the wind was punishing: from 42% in the Tuesday spillover, dropping to 19% by 08:30 inside the morning peak demand window. The merit order climbed into peakers and produced the second-highest morning peak of the series at €227.22, with 3 periods clearing above €200.
The structural read: the morning peak (€227.22) outpriced the evening for the third consecutive day, driven by the wind decline rate into the morning demand surge rather than the mean wind level. But that’s a statement about the market’s price shape, not about what a same-day battery can capture — the morning peak happens before any afternoon charge window, so it’s structurally out of reach for this dispatch model.
For storage, €32 gross — a thin day, because the market’s real scarcity event (the morning peak) fell before the battery could charge into it. The evening block it actually discharged into was a distant second-highest window. The gap between the day’s best price and the battery’s best reachable price is now the recurring theme of this run’s morning-peak days.
Half-hourly data — 2026-05-27
| Period | Time | Price (€/MWh) | Wind % |
|---|---|---|---|
| 1 | 23:00 | 196.00 | 43.6% |
| 2 | 23:30 | 163.60 | 42.0% |
| 3 | 00:00 | 154.19 | 24.3% |
| 4 | 00:30 | 137.33 | 25.9% |
| 5 | 01:00 | 129.11 | 27.3% |
| 6 | 01:30 | 126.16 | 29.5% |
| 7 | 02:00 | 127.25 | 29.6% |
| 8 | 02:30 | 126.18 | 31.7% |
| 9 | 03:00 | 126.11 | 33.9% |
| 10 | 03:30 | 125.00 | 33.5% |
| 11 | 04:00 | 124.88 | 33.5% |
| 12 | 04:30 | 124.88 | 33.8% |
| 13 | 05:00 | 128.37 | 32.4% |
| 14 | 05:30 | 132.21 | 31.4% |
| 15 | 06:00 | 141.23 | 29.7% |
| 16 | 06:30 | 168.36 | 27.9% |
| 17 | 07:00 | 200.00 | 26.6% |
| 18 | 07:30 | 227.22 | 24.3% |
| 19 | 08:00 | 220.00 | 21.3% |
| 20 | 08:30 | 203.40 | 19.7% |
| 21 | 09:00 | 180.50 | 19.6% |
| 22 | 09:30 | 150.98 | 19.3% |
| 23 | 10:00 | 133.00 | 20.4% |
| 24 | 10:30 | 123.72 | 22.5% |
| 25 | 11:00 | 125.94 | 23.1% |
| 26 | 11:30 | 120.84 | 25.3% |
| 27 | 12:00 | 117.18 | 28.4% |
| 28 | 12:30 | 114.82 | 30.8% |
| 29 | 13:00 | 116.00 | 31.6% |
| 30 | 13:30 | 115.00 | 32.7% |
| 31 | 14:00 | 114.82 | 33.3% |
| 32 | 14:30 | 114.82 | 36.0% |
| 33 | 15:00 | 114.82 | 35.2% |
| 34 | 15:30 | 113.56 | 33.9% |
| 35 | 16:00 | 114.05 | 35.1% |
| 36 | 16:30 | 116.29 | 41.0% |
| 37 | 17:00 | 118.89 | 41.5% |
| 38 | 17:30 | 123.65 | 40.3% |
| 39 | 18:00 | 135.83 | 39.9% |
| 40 | 18:30 | 140.16 | 37.4% |
| 41 | 19:00 | 151.00 | 38.1% |
| 42 | 19:30 | 153.08 | 37.9% |
| 43 | 20:00 | 154.09 | 36.9% |
| 44 | 20:30 | 154.29 | 36.6% |
| 45 | 21:00 | 150.92 | 37.5% |
| 46 | 21:30 | 149.11 | 41.3% |
| 47 | 22:00 | 134.16 | 46.5% |
| 48 | 22:30 | 126.03 | 46.0% |
Compare your business electricity and gas rates in minutes with INIS Energy Brokers.
Compare rates