I-SEM Daily Briefing — 28 May 2026
Table of Contents
Market Snapshot
| Metric | Value |
|---|---|
| Mean DAM Price | €128.37/MWh |
| Median Price | €124.4/MWh |
| Std Dev | €20.46/MWh |
| Peak Price | €175.45/MWh (08:00) |
| Min Price | €99.0/MWh (14:00) |
| Price Range | €76.45/MWh |
| Periods above €150 | 11 of 48 (23%) |
| Periods above €200 | 0 of 48 (0%) |
| Peak Avg (07–22) | €130.64/MWh |
| Off-peak Avg (22–07) | €124.59/MWh |
| BESS Captured Spread | €63/MWh |
| Wind % of Demand | 38.8% |
| Wind Range | 23.6%–53.8% |
| Mean Demand | 3854 MW |
Price Profile #
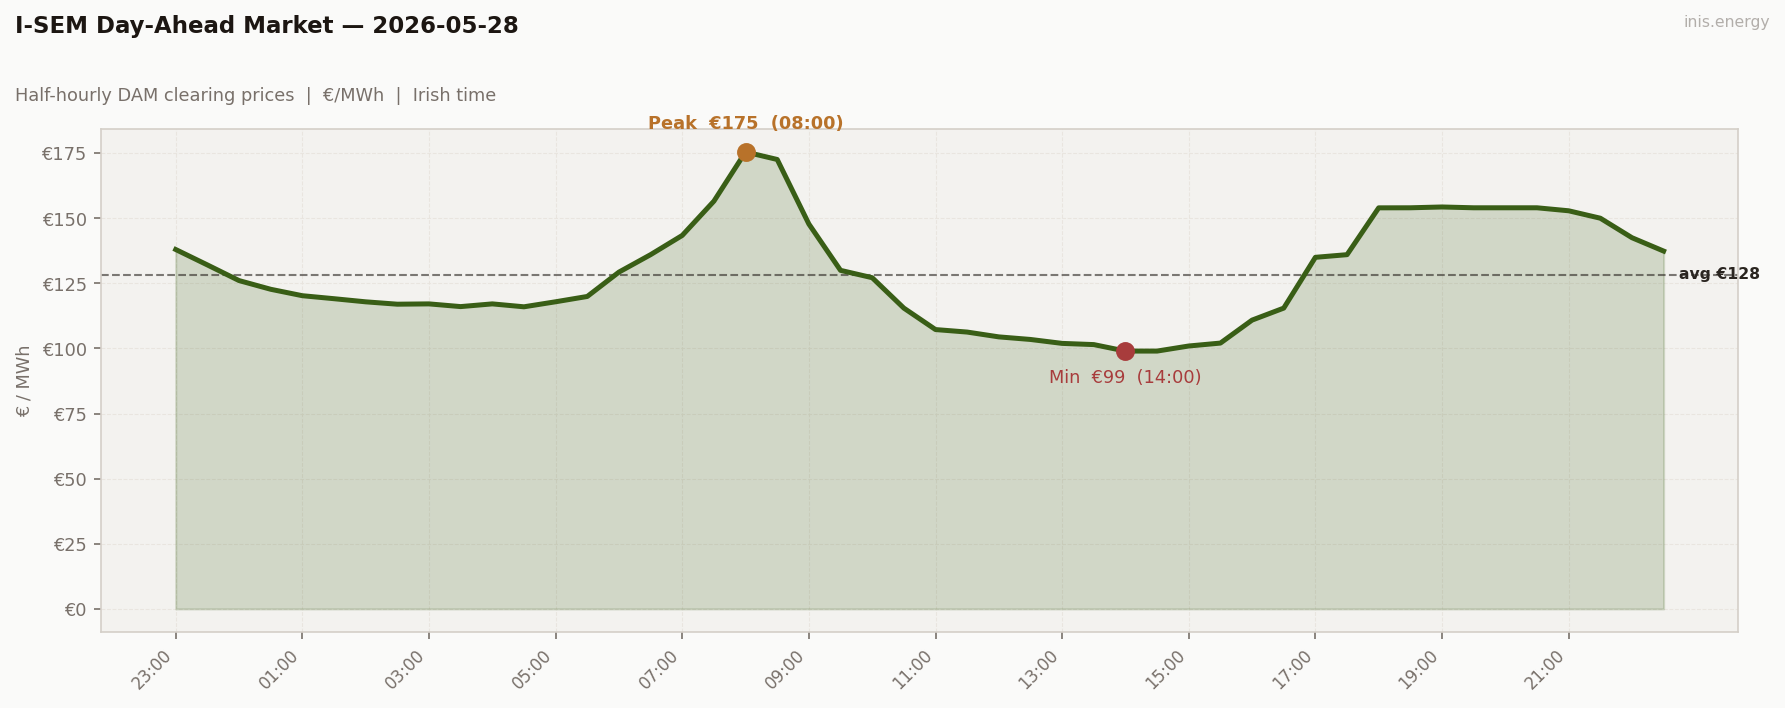
Std dev €20.46/MWh · Median €124.4/MWh · Periods above €150: 11 of 48 (23%)
A wind-recovered Thursday. Mean €128.37 sits below the working-week average, with no periods clearing €200 and the headline peak (€175.45 at 08:00) just barely above scarcity threshold.
Periods 1–2 (€138, €132 with wind 50–54%) look real this time — Wednesday’s evening tail faded to €126 by Wednesday 22:30, and the €138 at 23:00 fits the recovery. The boundary glitch is in the wind data only: period 3 wind drops from 54% to 41%, an unphysical jump.
Overnight ran €116–126 from 01:00 to 05:30 — a soft floor as wind held 36–45%. Morning ramp climbed €119 at 05:30 → €175 at 08:00: +€56 in 2.5 hours, less than two-thirds the slope of yesterday’s ramp. The morning peak landed at €175, contained — no excursion into peakers. By 10:00 prices had collapsed to €127, by 11:30 to €106, and the day spent four hours in a deep trough — €99–103 from 12:30 to 15:30, with the floor at €99.00 at 14:00 and 14:30.
Evening built a flat, sustained plateau: €154–155 across 18:00–21:00 — five consecutive half-hours within €1 of each other. The plateau then faded to €138 by 22:30.
11 of 48 periods cleared above €150; zero above €200.
Price vs Wind #
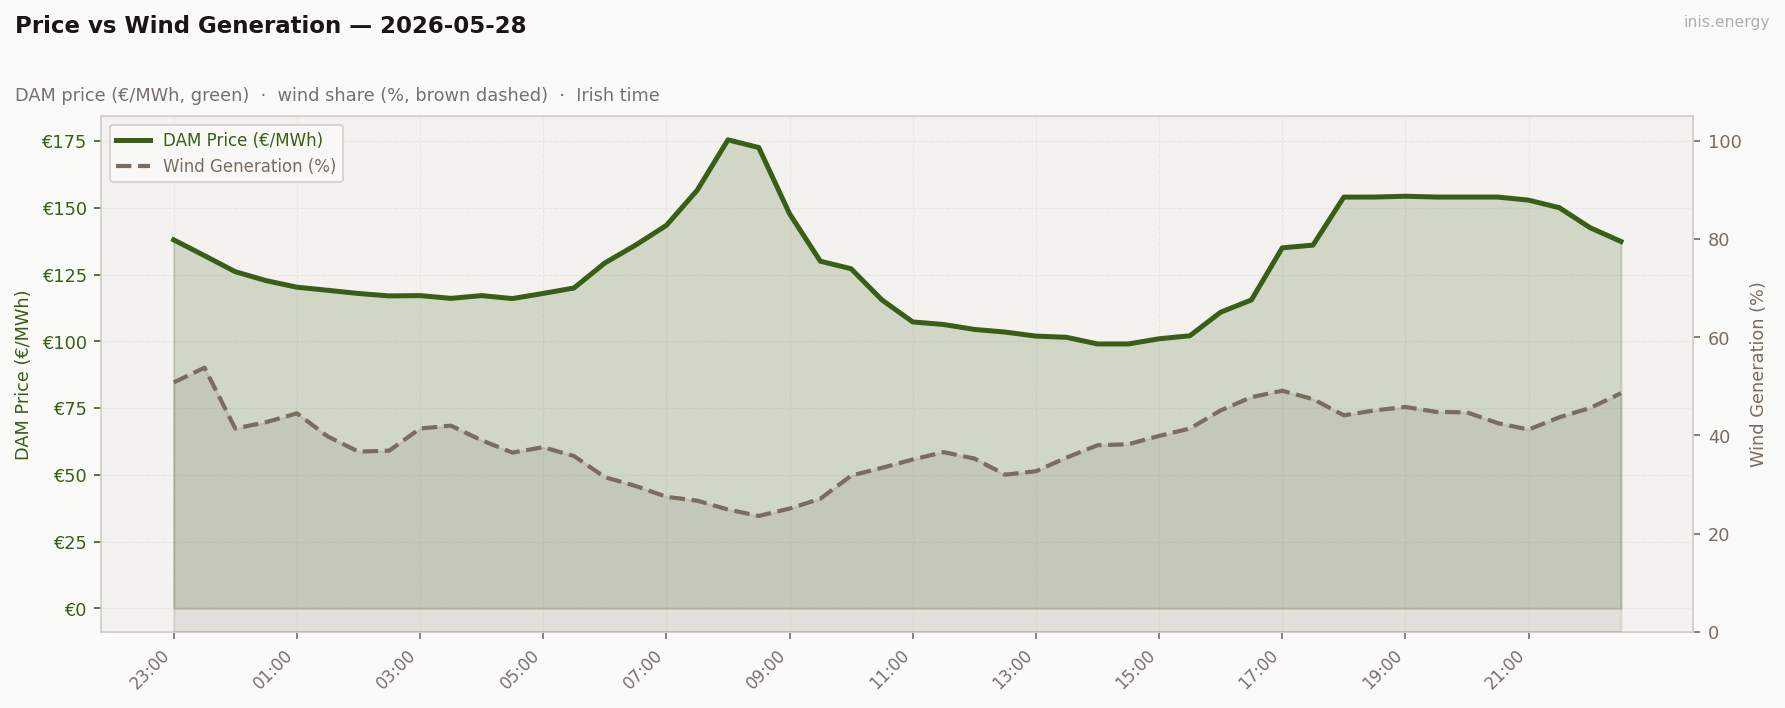
Mean wind: 38.8% · Range: 23.6%–53.8%
The morning-discharge pattern continues — even on a contained day. Wind shape: high overnight (40–54%), declined into the morning peak window (24% at 08:30 — the day’s minimum), recovered through the afternoon (33–47%), held high through evening (42–48%).
The wind decline into the morning was moderate (40% → 24% across 3 hours, a 16-point drop versus May 27’s 25-point drop). The evening wind held high. Result: the morning peak topped out at €175 (vs May 27’s €227, vs May 26’s €212), and the evening plateau capped at €154. Modest wind shortfall, modest peak.
The morning-discharge logic still applies. Morning block (07:00–08:30 at €162 avg) beats evening block (18:00–19:30 at €154 avg) by €8 — narrowly. The fourth straight day where the morning peak outpriced the evening, but the smallest margin of the run.
Week in Context #
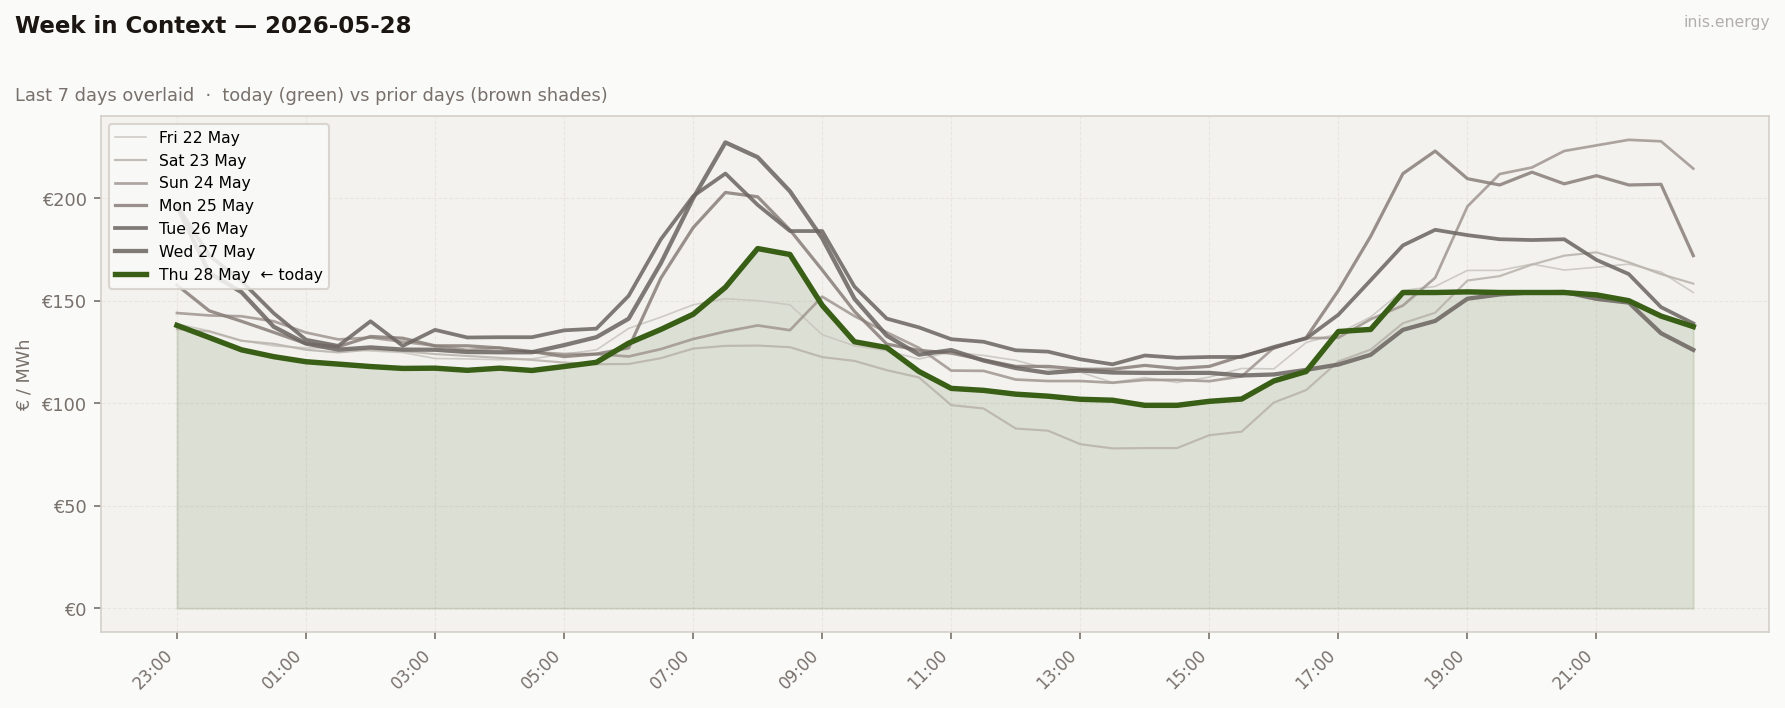
Three consecutive morning-discharge days now. The wind shape across May 26–28 is the same structural signature each day: low morning wind, high evening wind. Whatever weather pattern is producing this is producing a consistent BESS dispatch outcome.
Price Duration Curve #
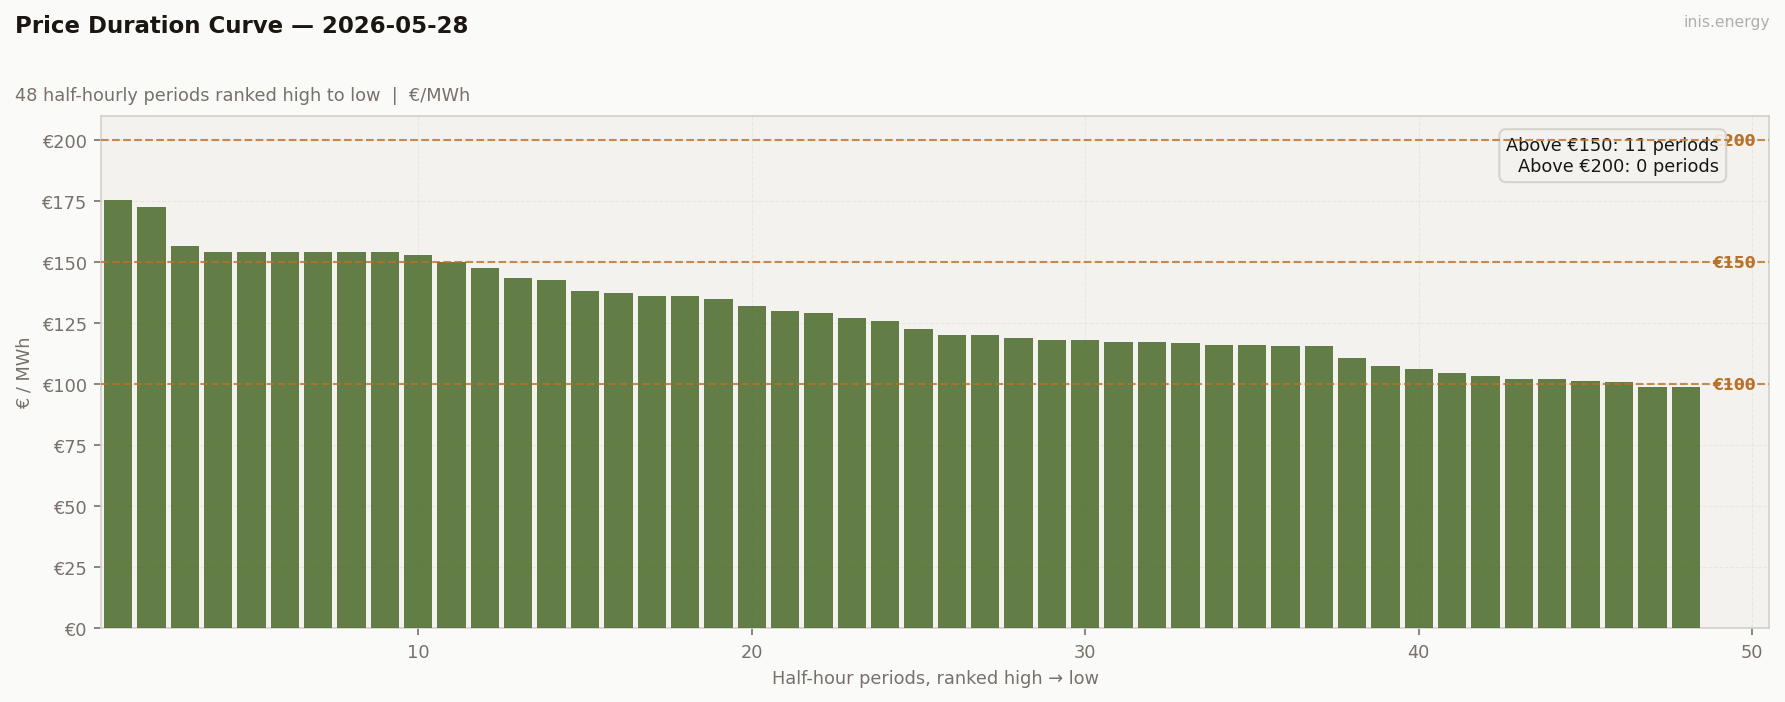
Periods above €150: 11 (23% of day) · Above €200: 0 (0% of day)
The curve shape is the “stepped shoulder” archetype — a soft top shelf around €152–175 (11 periods, the evening plateau plus the morning block), a gradual mid-section, and a cheap tail clustering around €99–110 (5 periods).
Compare to May 27’s PDC: today’s has a wider top shelf (more periods above €150) but a lower top — wider but less steep. Today’s PDC has more time spent in the elevated band but fewer scarcity prints. The shape pays storage less than yesterday’s, because the captured spread depends on the gap between the trough and the discharge window, and today’s discharge window sits lower.
Price Spread #
Captured spread: €54/MWh · Charge: €100/MWh (13:30) · Discharge: €154/MWh (18:30)
BESS Dispatch Signal #
| Price | Time | Energy | Value | |
|---|---|---|---|---|
| Charge | €100/MWh | 13:30 | 2 MWh | −€200 |
| Discharge | €154/MWh | 18:30 | 1.7 MWh (85% RTE) | +€262 |
| Gross profit | €62 | |||
| Price spread | €54/MWh | ROI: 30.8% |
Simulated 1MW/2MWh battery, one optimal DAM cycle. Gross before network charges and capacity costs.
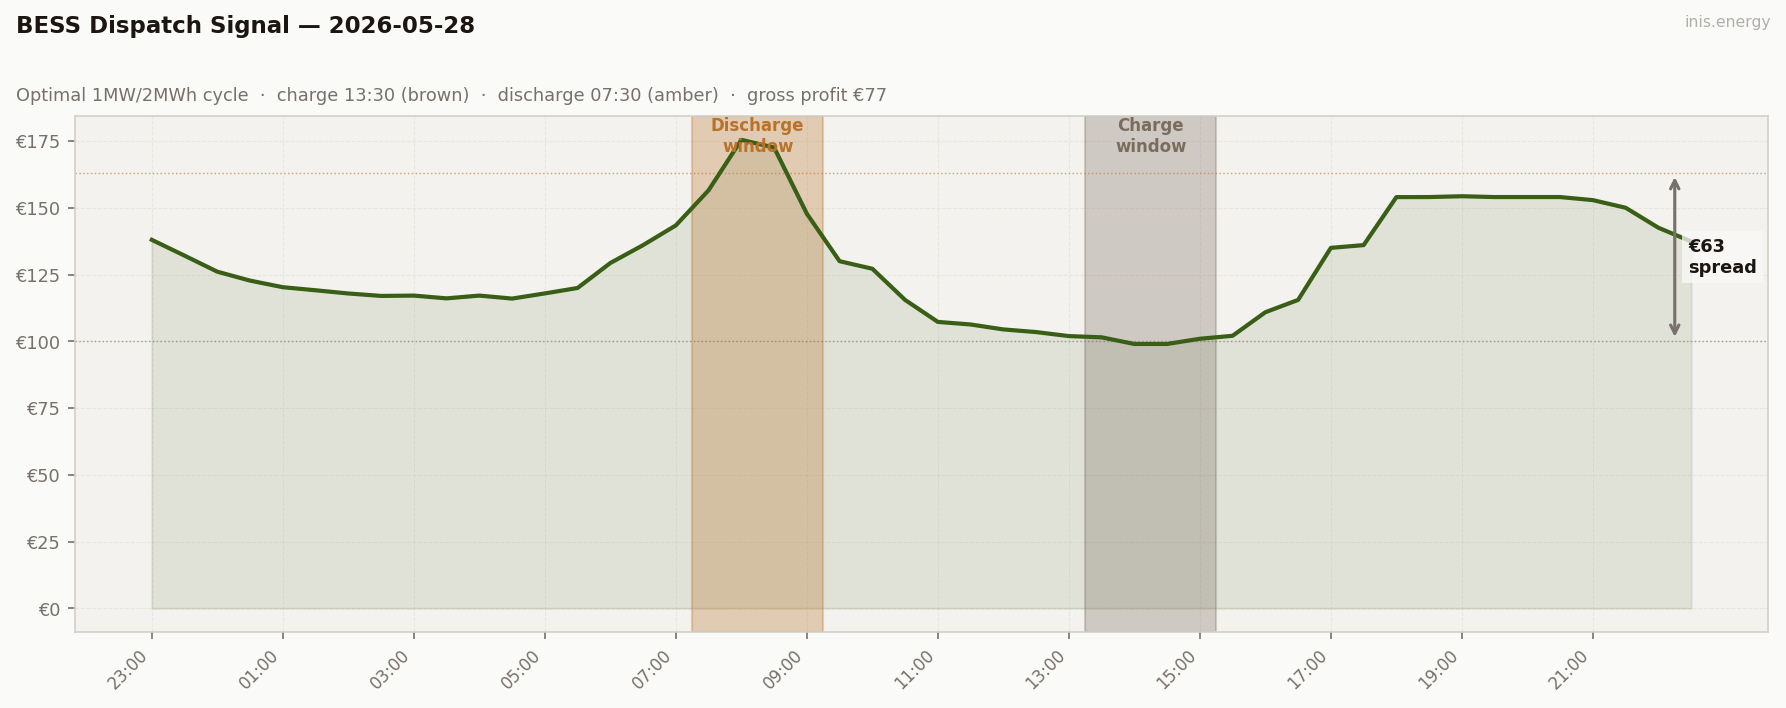
Updated 2026-08-27: the BESS simulation previously allowed the discharge window to occur before the charge window ended, which is physically impossible for a battery — in this case, by picking the 07:30–09:00 morning block, which falls before the midday charge. Recalculated enforcing charge-before-discharge; gross profit corrected from €77 to €62.
€62 gross. Charge €100 in the midday trough (13:30–15:00, ~€100 avg), discharge €154 in the evening block (18:30, €154 avg) — the morning block (07:30–09:00, €163 avg) was higher but fell before the charge, so it’s out of reach for a same-day cycle. Captured spread €54, ROI 30.8% on the €200 charge cost.
The past three days (May 26, 27, 28) all showed a morning peak that outpriced the evening — but in every case the charge sits in the afternoon, so none of them can actually discharge into that morning window. The corrected gross across the three is €66, €32, €62: no clean trend, because each day’s reachable evening peak depends on its own shape, not on how sharp the (unreachable) morning shortfall was.
Commentary #
A wind-recovered Thursday — the wind drought is properly broken, even with the morning-discharge pattern persisting. Mean €128.37 sits below the working-week average, zero periods above €200, and a sub-€100 midday trough returns for the first time since May 23. Wind 38.8% on the day with a 24–54% range; the morning peak landed at a contained €175, and the evening built a flat plateau at €154.
A three-day pattern of morning peaks outpricing the evening persists — May 26, 27, 28 in a row — with the magnitude tracking the morning wind shortfall depth, not the calendar. May 27’s 19% morning low produced €227; today’s 24% morning low produced €175. €8/MWh of additional wind during the demand surge cost €52/MWh of peak price. But this is a statement about market shape, not about what a same-day battery earns: in all three cases the charge sits in the afternoon, so the morning peak is never actually reachable.
For storage, €62 gross — the third day in a row where the market’s real peak happened before the battery could charge into it. A real operator’s forecasting horizon needs to cover the next-morning shortfall risk and charge the previous evening to actually capture it — the single-cycle, same-day DAM model captures the market’s shape after the fact, but an operating asset able to charge overnight would earn a materially different number on days like these.
Half-hourly data — 2026-05-28
| Period | Time | Price (€/MWh) | Wind % |
|---|---|---|---|
| 1 | 23:00 | 138.00 | 50.8% |
| 2 | 23:30 | 132.08 | 53.8% |
| 3 | 00:00 | 126.07 | 41.4% |
| 4 | 00:30 | 122.73 | 42.7% |
| 5 | 01:00 | 120.26 | 44.5% |
| 6 | 01:30 | 119.11 | 39.8% |
| 7 | 02:00 | 117.91 | 36.7% |
| 8 | 02:30 | 117.00 | 36.9% |
| 9 | 03:00 | 117.12 | 41.4% |
| 10 | 03:30 | 116.08 | 42.0% |
| 11 | 04:00 | 117.12 | 39.0% |
| 12 | 04:30 | 116.00 | 36.5% |
| 13 | 05:00 | 117.93 | 37.6% |
| 14 | 05:30 | 119.97 | 35.8% |
| 15 | 06:00 | 129.32 | 31.5% |
| 16 | 06:30 | 136.02 | 29.7% |
| 17 | 07:00 | 143.41 | 27.5% |
| 18 | 07:30 | 156.56 | 26.7% |
| 19 | 08:00 | 175.45 | 24.9% |
| 20 | 08:30 | 172.57 | 23.6% |
| 21 | 09:00 | 147.79 | 25.1% |
| 22 | 09:30 | 130.00 | 27.1% |
| 23 | 10:00 | 127.17 | 31.8% |
| 24 | 10:30 | 115.50 | 33.4% |
| 25 | 11:00 | 107.26 | 35.1% |
| 26 | 11:30 | 106.30 | 36.6% |
| 27 | 12:00 | 104.45 | 35.3% |
| 28 | 12:30 | 103.46 | 32.0% |
| 29 | 13:00 | 101.95 | 32.7% |
| 30 | 13:30 | 101.49 | 35.5% |
| 31 | 14:00 | 99.00 | 38.0% |
| 32 | 14:30 | 99.00 | 38.2% |
| 33 | 15:00 | 100.95 | 39.9% |
| 34 | 15:30 | 102.07 | 41.4% |
| 35 | 16:00 | 110.89 | 45.1% |
| 36 | 16:30 | 115.50 | 47.8% |
| 37 | 17:00 | 135.00 | 49.1% |
| 38 | 17:30 | 136.02 | 47.4% |
| 39 | 18:00 | 154.00 | 44.1% |
| 40 | 18:30 | 154.02 | 45.1% |
| 41 | 19:00 | 154.33 | 45.8% |
| 42 | 19:30 | 154.02 | 44.8% |
| 43 | 20:00 | 154.02 | 44.7% |
| 44 | 20:30 | 154.02 | 42.5% |
| 45 | 21:00 | 152.87 | 41.2% |
| 46 | 21:30 | 150.02 | 43.7% |
| 47 | 22:00 | 142.53 | 45.6% |
| 48 | 22:30 | 137.40 | 48.6% |
Compare your business electricity and gas rates in minutes with INIS Energy Brokers.
Compare rates