I-SEM Daily Briefing — 29 May 2026
Table of Contents
Market Snapshot
| Metric | Value |
|---|---|
| Mean DAM Price | €128.35/MWh |
| Median Price | €117.67/MWh |
| Std Dev | €30.88/MWh |
| Peak Price | €203.0/MWh (22:00) |
| Min Price | €91.0/MWh (14:30) |
| Price Range | €112.0/MWh |
| Periods above €150 | 9 of 48 (19%) |
| Periods above €200 | 3 of 48 (6%) |
| Peak Avg (07–22) | €129.47/MWh |
| Off-peak Avg (22–07) | €126.48/MWh |
| BESS Captured Spread | €107/MWh |
| Wind % of Demand | 39.4% |
| Wind Range | 13.8%–63.9% |
| Mean Demand | 3675 MW |
Price Profile #
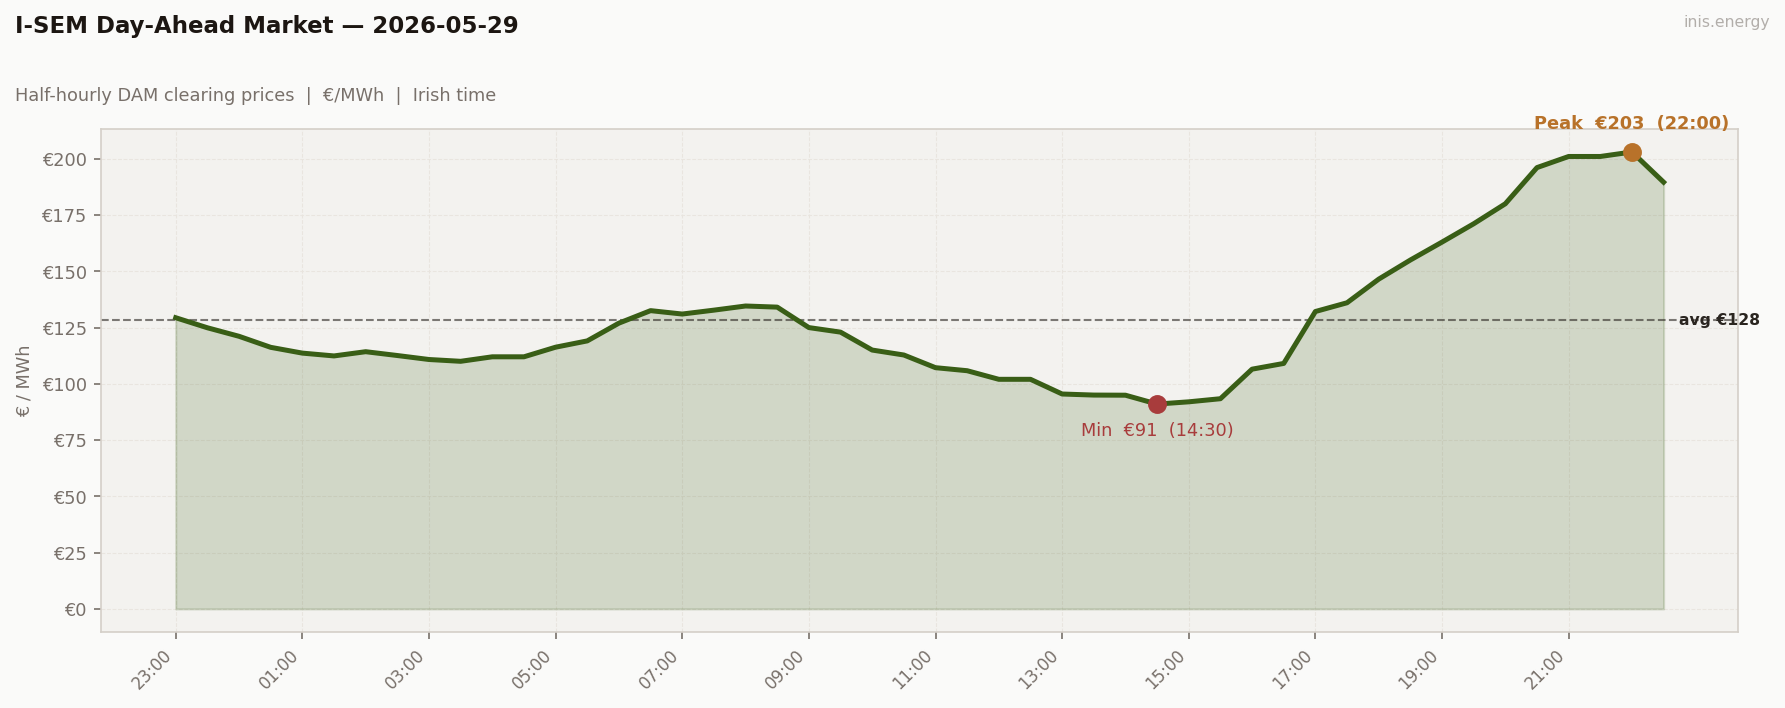
Std dev €30.88/MWh · Median €117.67/MWh · Periods above €150: 9 of 48 (19%)
The day’s headline statistics hide a top-5 BESS day. Mean €128.35 looks unremarkable — essentially identical to yesterday’s €128.37. But std dev jumped to €30.88 (vs €20.46 yesterday), range to €112 (vs €76), and the day produced 3 periods above €200 — all in the late evening from 21:00 to 22:00.
The profile is wind-rich morning bleeding into wind-poor evening. Overnight (after the boundary periods) ran €110–121 from 01:00 to 05:30 — a soft floor at 53–64% wind. The morning ramp was the gentlest of the working week: €127 at 06:00 → €135 at 08:00. No real morning peak. Mid-morning prices fell smoothly into the midday trough — €91.00 at 14:30, the day’s minimum and the second-deepest trough of the run after May 23’s €78.
Then the evening built relentlessly. €92 at 15:30 → €107 at 16:00 → €146 at 18:00 → €180 at 20:00 → €203 at 22:00. The four consecutive half-hours from 20:30 to 22:00 averaged €200 — straight scarcity territory. Then €189 at 22:30 fading.
9 of 48 periods cleared above €150; 3 above €200.
Price vs Wind #
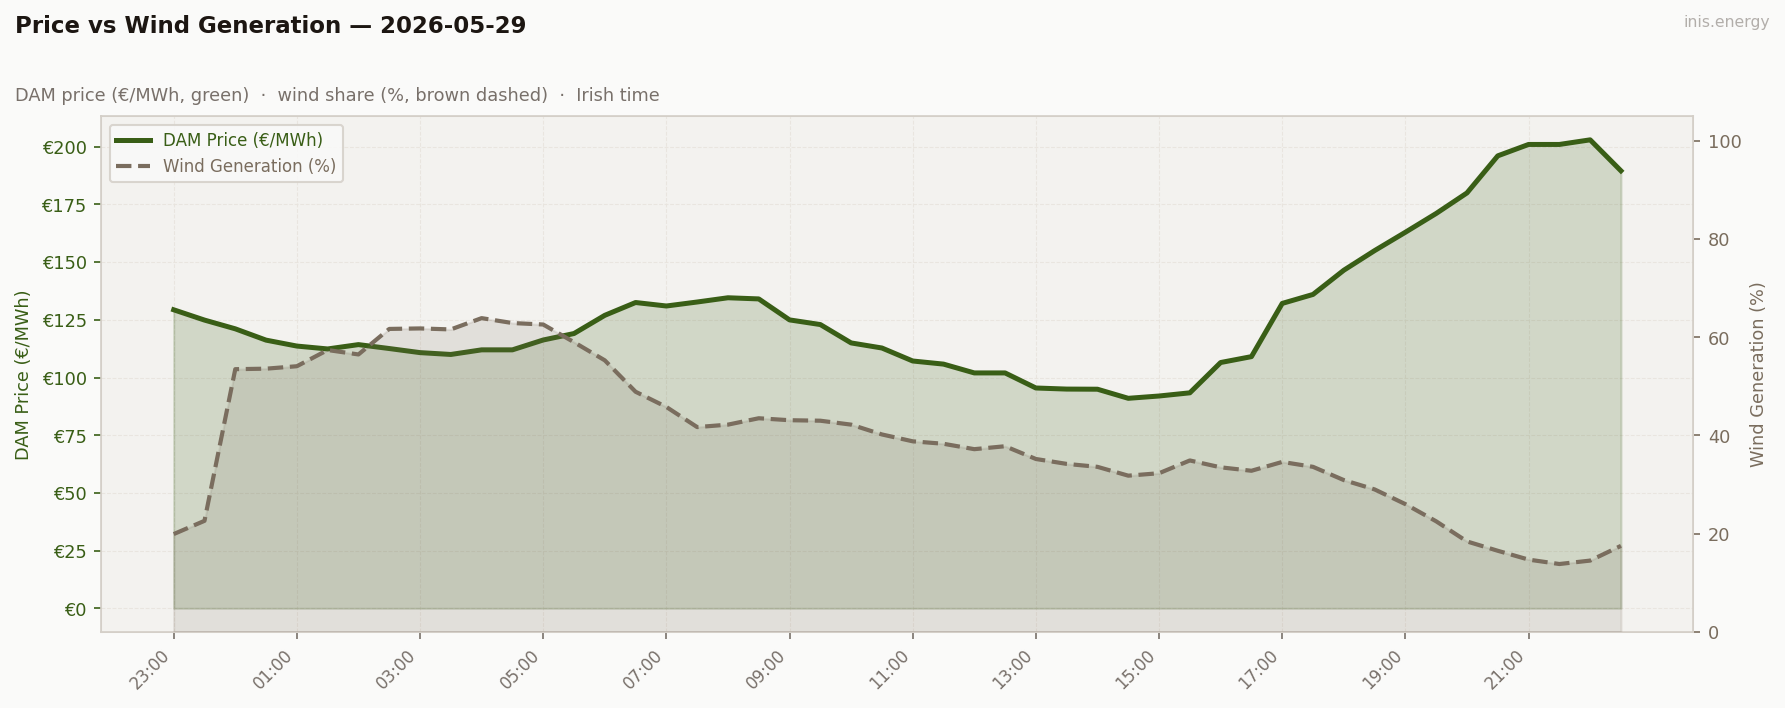
Mean wind: 39.4% · Range: 13.8%–63.9%
The widest wind range of the entire run — 50 percentage points across 24 hours. Wind started at 53–54% (after the boundary glitch — periods 1–2 show 20–22%, the boundary error), climbed to 62–64% from 04:00 to 05:00, drifted down through the morning to 35% by 13:00, then drained sharply through the evening: 35% at 17:00 → 29% at 18:30 → 22% at 19:30 → 18% at 20:00 → 14% by 21:00.
The structural pattern: wind-rich morning → wind-shortage evening. Exactly the inverse of the May 26–28 morning-shortage regime. Wind produced 62% during overnight when nothing was happening, then drained into the evening demand peak when it mattered. The merit order had nothing to fill the gap, and the late evening cleared €200+.
Today’s mean wind is 39.4% — higher than May 27’s 32.3%. May 27’s peak was €227 (morning); today’s peak is €203 (evening). Different shape, different time of day, different peak height — but both produced 3 scarcity prints, and the structural cause was identical: wind drained into the day’s demand peak. Mean wind is a useless summary statistic for predicting scarcity. The cleanest predictor is the minimum half-hour wind during the day’s highest-demand window.
Week in Context #
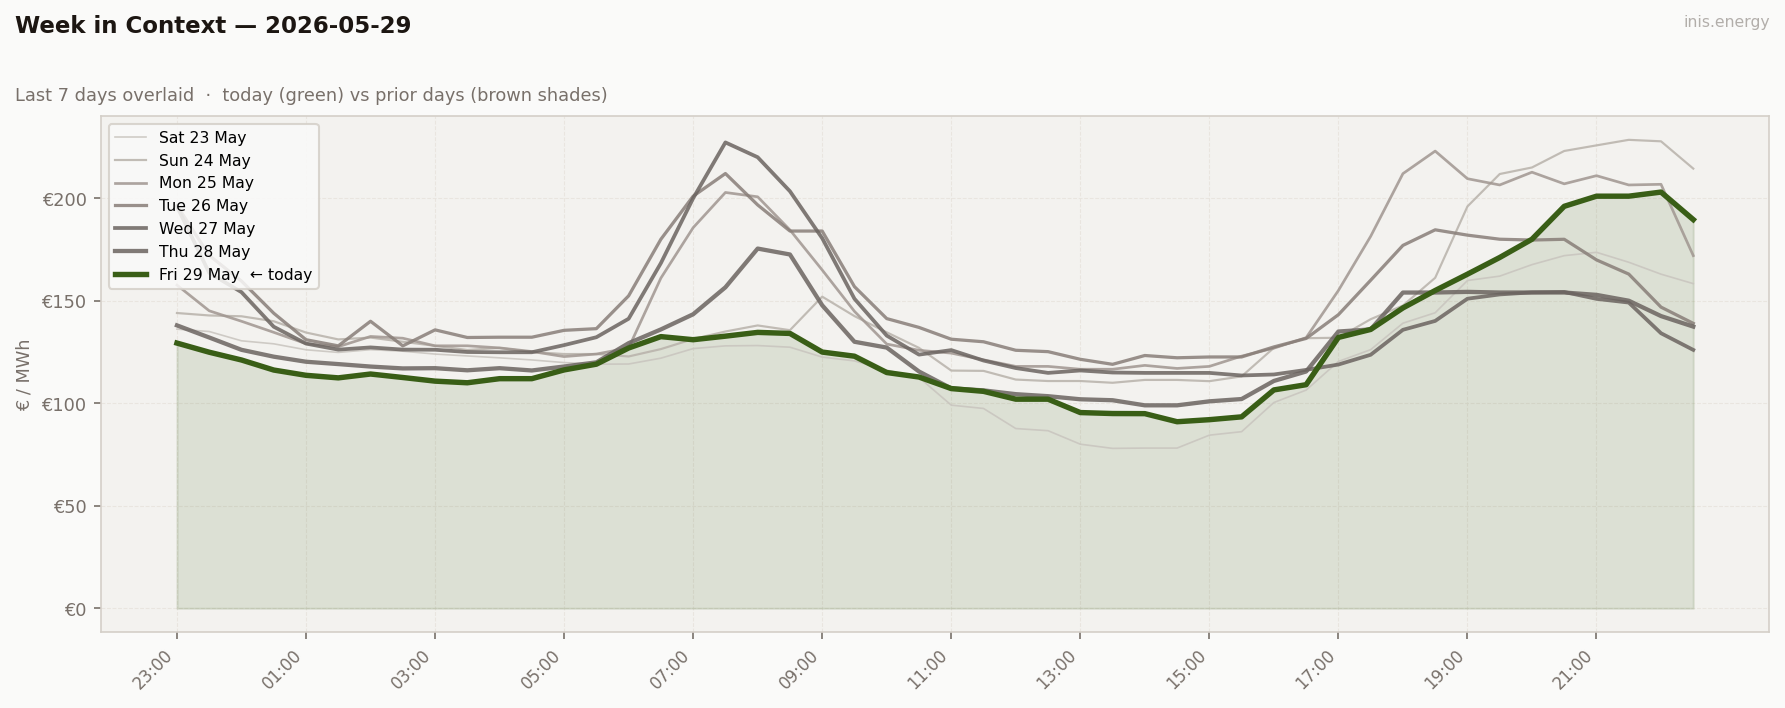
Wind shapes across the week: May 27 V-into-morning, May 28 V-out-of-evening (wind held high through evening), May 29 V-into-evening. Three working days, three distinct wind shapes, three different peak times, three different BESS dispatch outcomes. The wind-shape variance week.
Price Duration Curve #
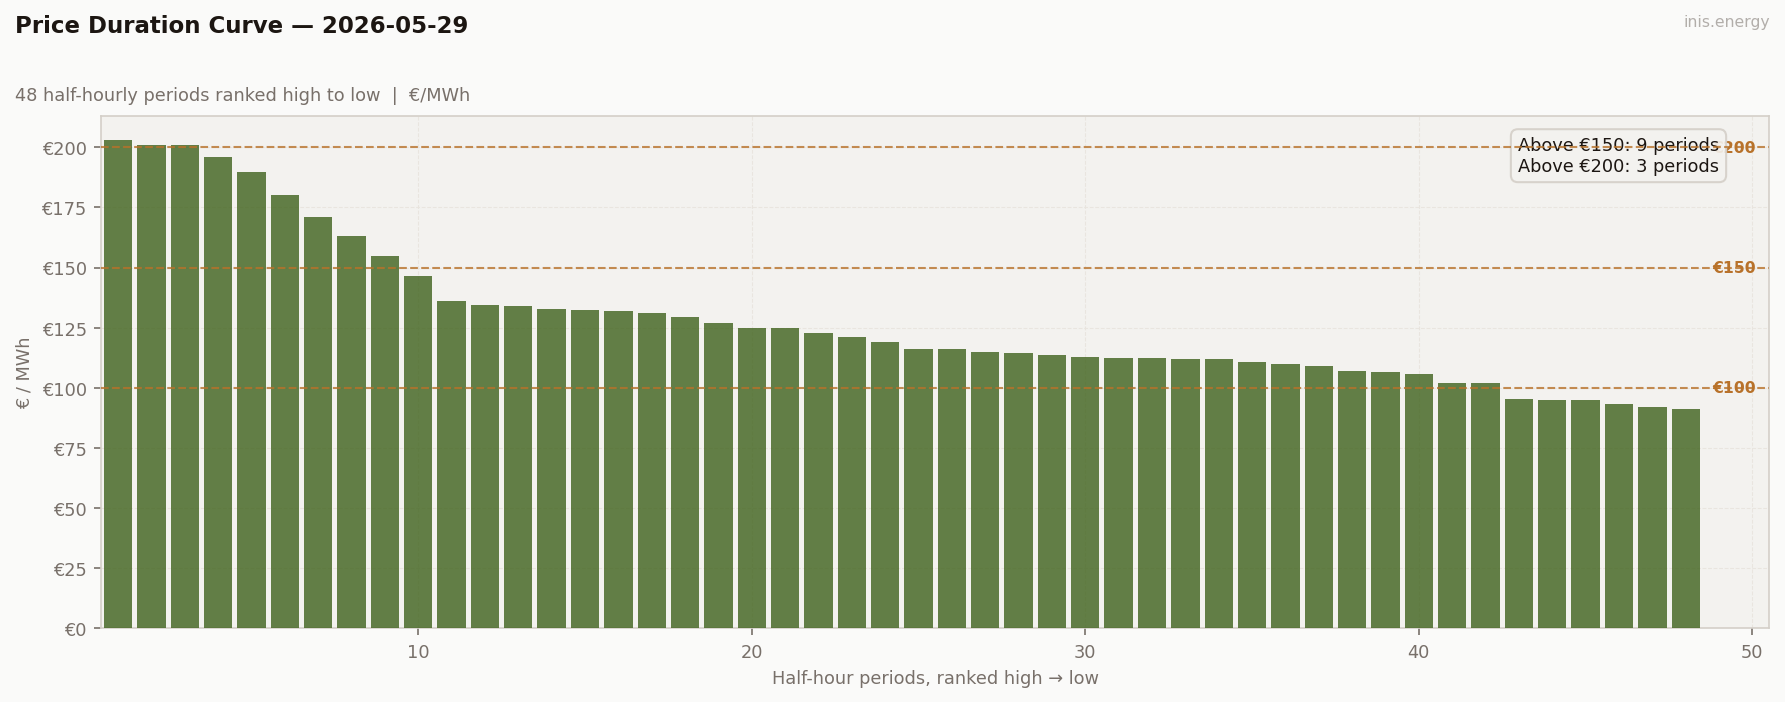
Periods above €150: 9 (19% of day) · Above €200: 3 (6% of day)
The PDC has a clear three-tier shape: a sharp top spike (3 periods €201–203 — the late evening), a gradual upper shelf (6 periods €146–189 — the evening build), and a long cheap tail (15 periods below €115). The middle is gradual — no flat section.
This is the “scarcity tail” archetype — distinct from May 27’s morning spike. The morning spike PDC has three sharp tops at the very left and a smooth drop. The scarcity tail PDC has a top spike followed by an extended upper shelf — the evening build is visible on the curve as a gradual climb rather than a sharp step.
For BESS, both shapes deliver — but in different ways. May 27 cycled into a sharp narrow morning peak. May 29 cycled into a sustained late-evening climb. Captured spread on both days exceeded €95.
Price Spread #
Captured spread: €107/MWh · Charge: €93/MWh (14:00) · Discharge: €200/MWh (20:30)
BESS Dispatch Signal #
| Price | Time | Energy | Value | |
|---|---|---|---|---|
| Charge | €93/MWh | 14:00 | 2 MWh | −€186 |
| Discharge | €200/MWh | 20:30 | 1.7 MWh (85% RTE) | +€340 |
| Gross profit | €155 | |||
| Price spread | €107/MWh | ROI: 83.4% |
Simulated 1MW/2MWh battery, one optimal DAM cycle. Gross before network charges and capacity costs.
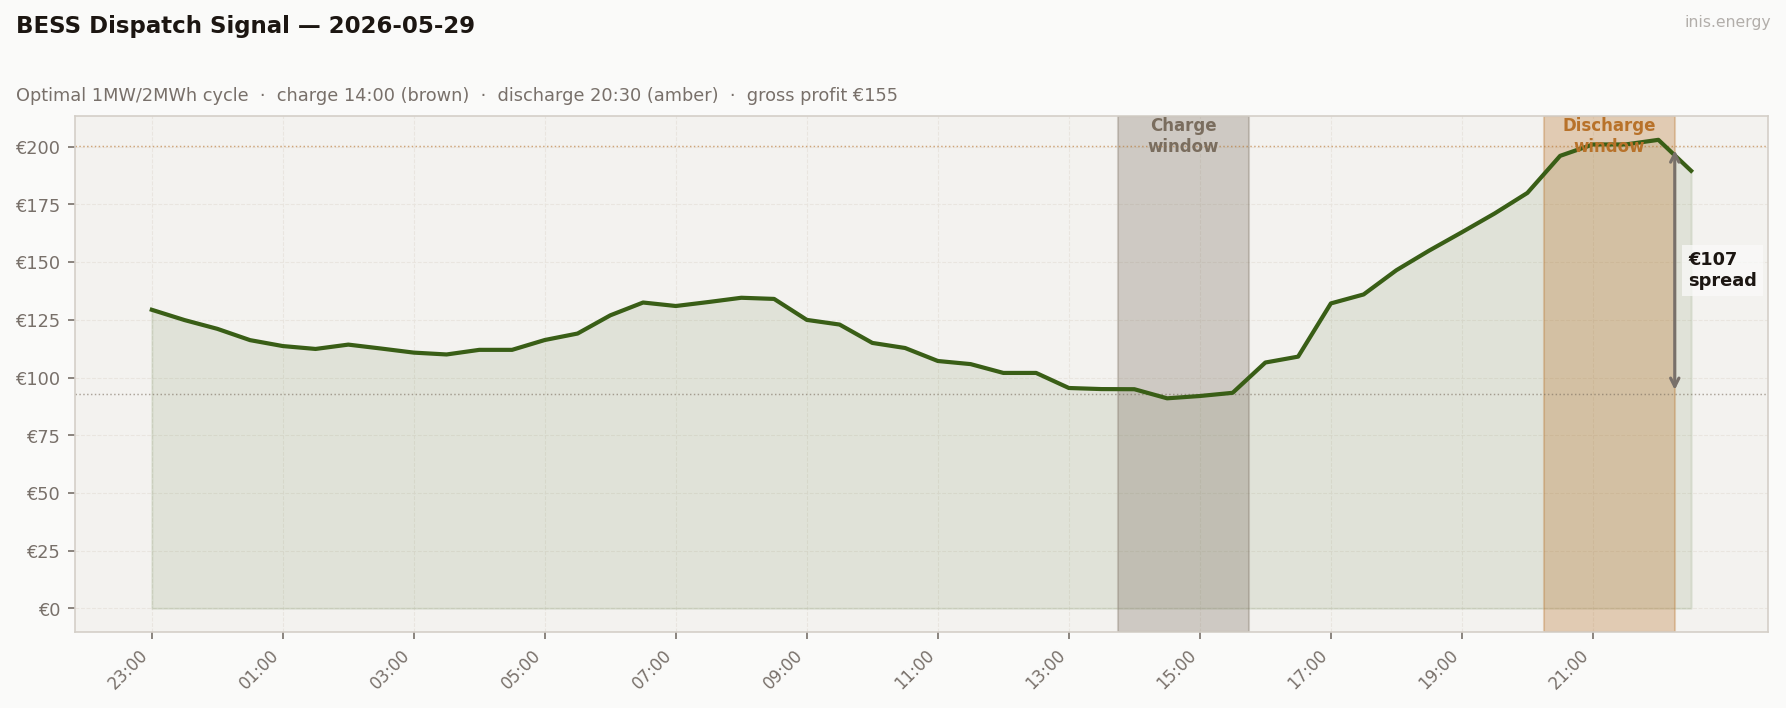
€155 gross — a strong day. ROI 83.4%.
Charge €93 at the deep midday trough (14:00–15:30 at €93 avg). Discharge €200 at the late-evening scarcity block (20:30–22:00 at €200 avg). Captured spread €107.
Commentary #
The day that hid a top-5 BESS event inside an unremarkable daily mean. Mean €128.35 is essentially identical to yesterday’s €128.37 — and yet the day delivered 3 scarcity prints in the late evening (€201–203 from 21:00 to 22:00), a captured BESS spread of €107, and gross BESS revenue of €155. Std dev jumped from €20 yesterday to €31 today on the same mean.
The structural cause is the wind shape — and specifically the widest wind range of the 26-day run (14% to 64%, 50 percentage points). Wind held 53–64% across the entire overnight and early morning. Then drained steadily through the day to bottom at 13.8% at 21:30 — exactly inside the late-evening demand window. From 19:30 to 22:00 wind ran at 14–22% while demand was at its evening peak, and the merit order climbed into scarcity. Mean wind 39% on the day; effective wind during the late-evening peak window 16%. Mean wind is uninformative.
For storage, the captured spread €107 unlocks gross €155. Charge €93 in the deep midday trough, discharge €200 in the scarcity block. ROI 83.4%. The single best predictor for BESS revenue in the data so far is not the day of the week; it is the wind decline rate into the day’s demand peak window.
Half-hourly data — 2026-05-29
| Period | Time | Price (€/MWh) | Wind % |
|---|---|---|---|
| 1 | 23:00 | 129.36 | 19.9% |
| 2 | 23:30 | 124.90 | 22.6% |
| 3 | 00:00 | 121.11 | 53.5% |
| 4 | 00:30 | 116.21 | 53.6% |
| 5 | 01:00 | 113.64 | 54.1% |
| 6 | 01:30 | 112.39 | 57.4% |
| 7 | 02:00 | 114.27 | 56.5% |
| 8 | 02:30 | 112.57 | 61.7% |
| 9 | 03:00 | 110.80 | 61.8% |
| 10 | 03:30 | 110.00 | 61.6% |
| 11 | 04:00 | 112.00 | 63.9% |
| 12 | 04:30 | 112.00 | 62.9% |
| 13 | 05:00 | 116.27 | 62.6% |
| 14 | 05:30 | 119.07 | 59.0% |
| 15 | 06:00 | 126.96 | 55.3% |
| 16 | 06:30 | 132.51 | 48.9% |
| 17 | 07:00 | 131.00 | 45.8% |
| 18 | 07:30 | 132.73 | 41.7% |
| 19 | 08:00 | 134.57 | 42.2% |
| 20 | 08:30 | 134.07 | 43.5% |
| 21 | 09:00 | 124.98 | 43.1% |
| 22 | 09:30 | 122.96 | 43.0% |
| 23 | 10:00 | 115.00 | 42.2% |
| 24 | 10:30 | 112.80 | 40.2% |
| 25 | 11:00 | 107.17 | 38.8% |
| 26 | 11:30 | 105.82 | 38.3% |
| 27 | 12:00 | 102.00 | 37.2% |
| 28 | 12:30 | 102.00 | 37.8% |
| 29 | 13:00 | 95.47 | 35.2% |
| 30 | 13:30 | 95.00 | 34.2% |
| 31 | 14:00 | 94.94 | 33.6% |
| 32 | 14:30 | 91.00 | 31.8% |
| 33 | 15:00 | 92.00 | 32.3% |
| 34 | 15:30 | 93.38 | 34.9% |
| 35 | 16:00 | 106.51 | 33.5% |
| 36 | 16:30 | 109.06 | 32.8% |
| 37 | 17:00 | 132.12 | 34.6% |
| 38 | 17:30 | 136.01 | 33.6% |
| 39 | 18:00 | 146.50 | 30.9% |
| 40 | 18:30 | 155.00 | 29.0% |
| 41 | 19:00 | 162.96 | 26.0% |
| 42 | 19:30 | 171.10 | 22.5% |
| 43 | 20:00 | 180.00 | 18.4% |
| 44 | 20:30 | 196.06 | 16.5% |
| 45 | 21:00 | 201.00 | 14.7% |
| 46 | 21:30 | 201.00 | 13.8% |
| 47 | 22:00 | 203.00 | 14.5% |
| 48 | 22:30 | 189.58 | 17.5% |
Compare your business electricity and gas rates in minutes with INIS Energy Brokers.
Compare rates