I-SEM Daily Briefing — 30 May 2026
Table of Contents
Market Snapshot
| Metric | Value |
|---|---|
| Mean DAM Price | €129.46/MWh |
| Median Price | €125.14/MWh |
| Std Dev | €17.5/MWh |
| Peak Price | €172.98/MWh (23:00) |
| Min Price | €104.61/MWh (14:30) |
| Price Range | €68.37/MWh |
| Periods above €150 | 7 of 48 (15%) |
| Periods above €200 | 0 of 48 (0%) |
| Peak Avg (07–22) | €124.36/MWh |
| Off-peak Avg (22–07) | €137.95/MWh |
| BESS Captured Spread | €57/MWh |
| Wind % of Demand | 37.2% |
| Wind Range | 23.9%–46.5% |
| Mean Demand | 3567 MW |
Price Profile #
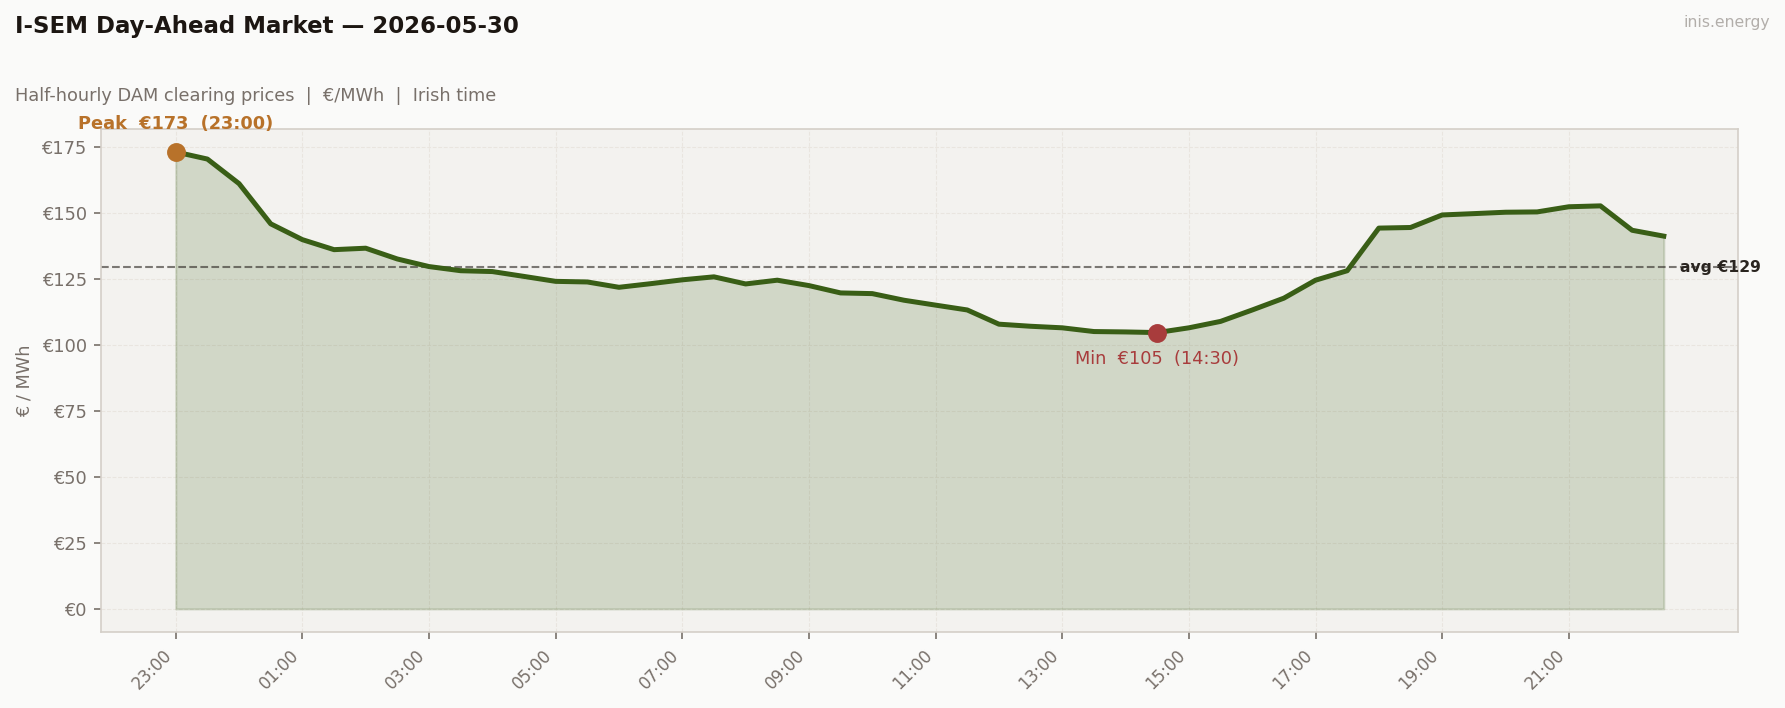
Std dev €17.5/MWh · Median €125.14/MWh · Periods above €150: 7 of 48 (15%)
A boundary-distorted Saturday. The headline peak (€172.98 at 23:00) is Friday’s late-evening scarcity tail spilling into Saturday’s file — the same SEM day boundary problem that has appeared on May 12, May 16, and other high-volatility transitions.
The “real” Saturday begins at 00:00 with €161 and falls cleanly: €146 at 00:30, €140 at 01:00, into a smooth overnight floor of €121–140 through 06:30. Wind held 24–44% across overnight — modest. The morning ramp barely existed: €124 at 07:00 → €126 at 07:30 → fell back to €123 by 08:00. No morning peak — Saturday demand softened the ramp out of existence.
Midday belly held €105–117 from 10:30 to 16:00 — six and a half hours of shallow trough, with the floor at €104.61 at 14:30. Evening built a contained climb — €106 at 15:00 → €152 at 21:30. The actual Saturday evening peak topped at €152.58, not the €173 the headline shows. Late evening faded to €141.
Strip the boundary periods and Saturday’s real range is €121 to €153 — barely €32 of intra-day variation. The flattest underlying day of the working week with no morning peak, a contained evening peak, and a long shallow trough.
7 of 48 periods cleared above €150 (4 of those are the Friday spillover); 0 above €200.
Price vs Wind #
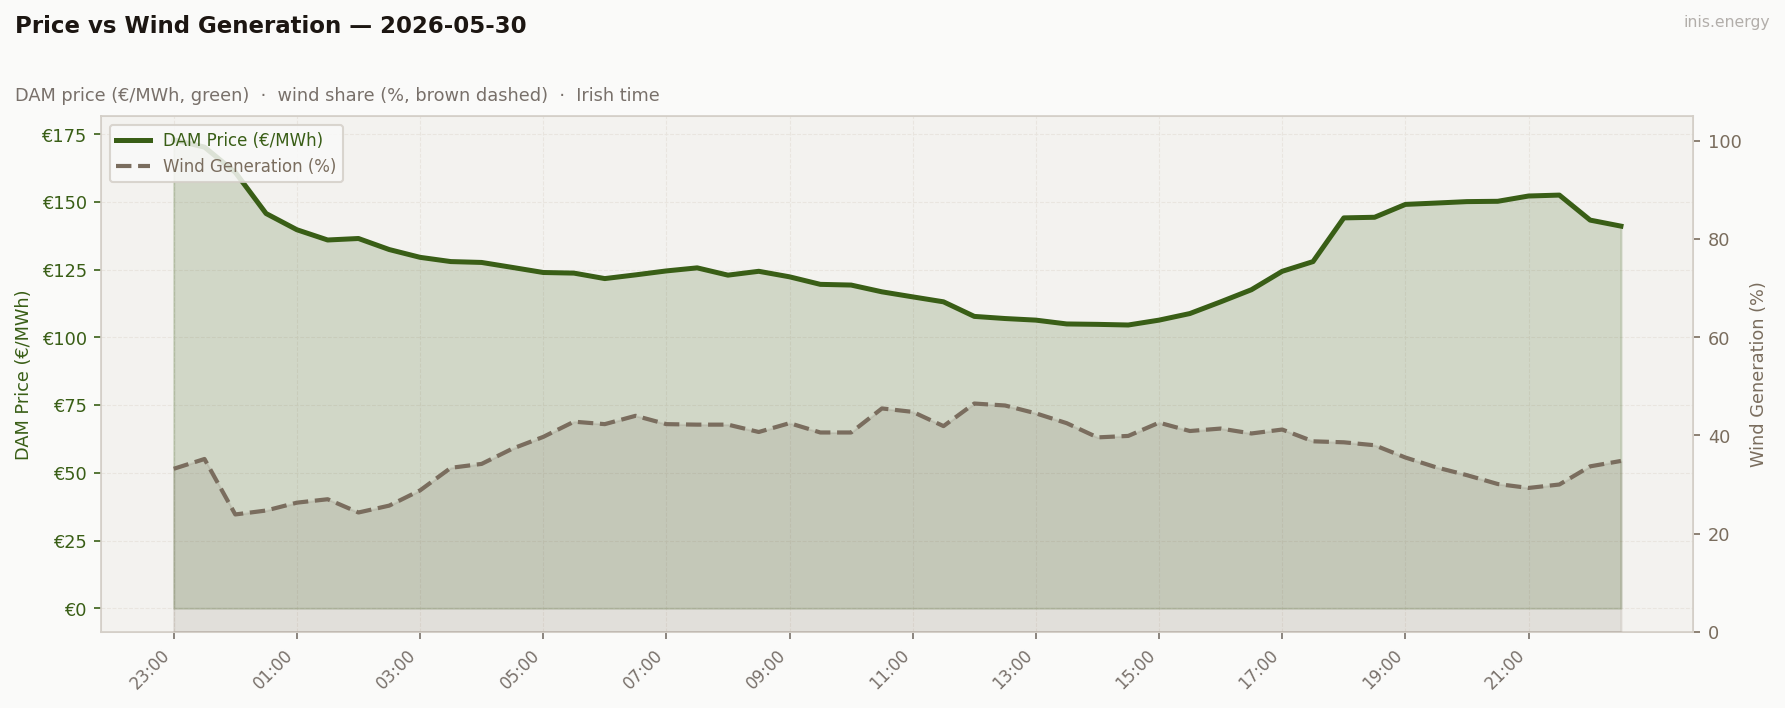
Mean wind: 37.2% · Range: 23.9%–46.5%
Steady, mid-range wind across the entire day. Wind held 24–47% with no major shortfalls. Overnight (after the period 3 wind glitch) ran 24–34%, morning rose to 42–44%, midday held 39–47%, and evening drifted down to 29–34%. The narrow band (23-point range) is the third-narrowest wind range of the 27-day run.
With wind reliably present and demand at a weekend-low 3,567 MW, the merit order found gas-marginal at low load across virtually all 48 half-hours. No periods needed peakers; no periods saw surplus; clearing prices stayed in the €105–155 band that gas at moderate load produces.
This is the genuinely-calm Saturday archetype — what May 23 might have looked like with slightly less wind. May 23 broke through to €78 at the trough because 31% wind into 3,511 MW demand produced surplus at midday. May 30’s 39% wind into 3,567 MW demand stayed gas-marginal — the surplus condition never quite materialised. The 6-percentage-point wind increase from May 23 to May 30, combined with steadier wind timing, lifted the trough by €26 (€78 → €105). A small change in wind shape produces large changes in trough depth at the surplus threshold.
Week in Context #
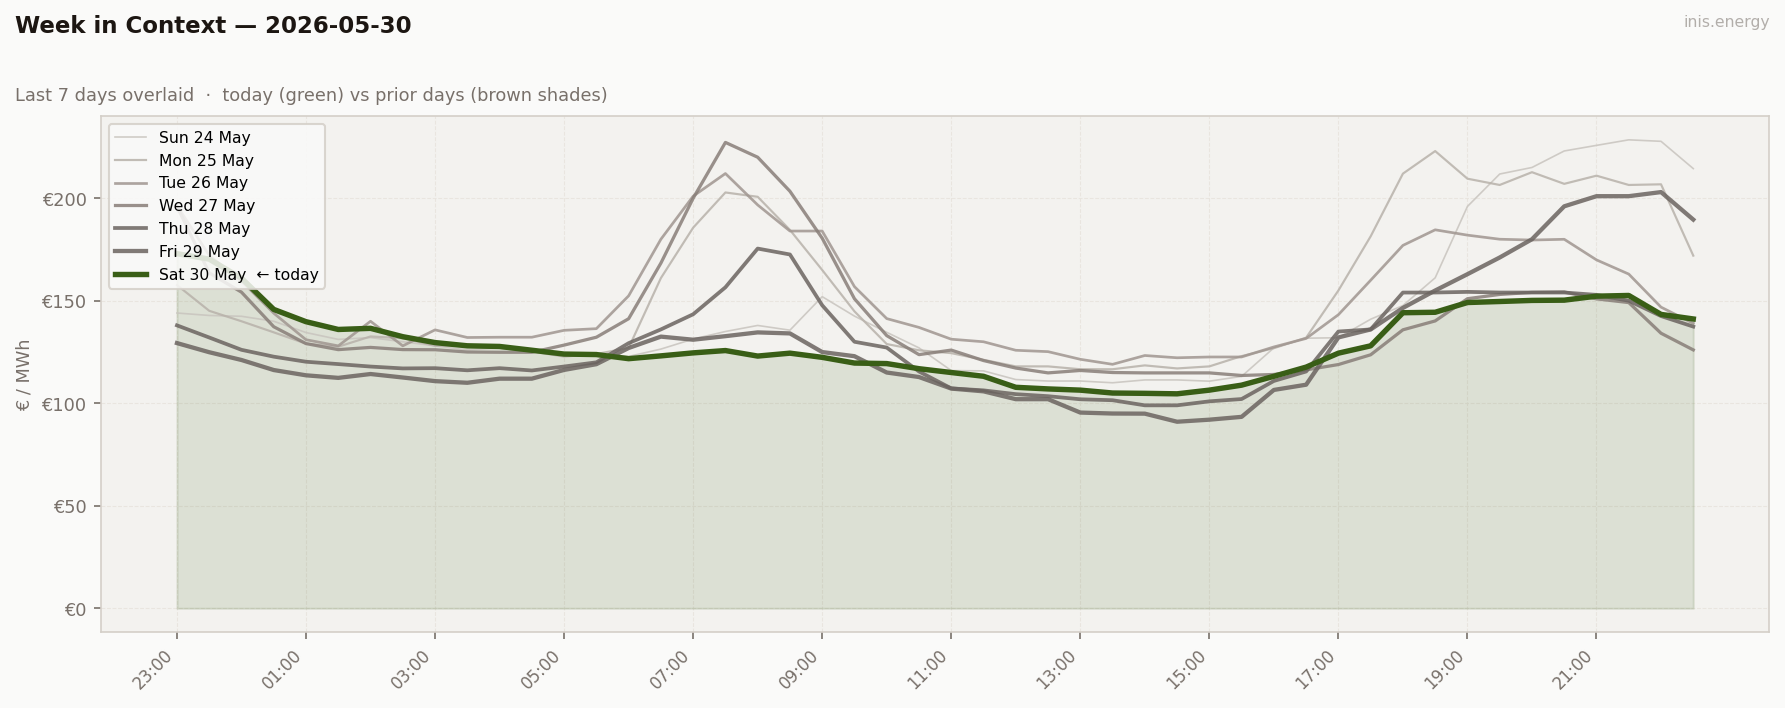
Three consecutive days of wind-shape variation: May 28 V-out-of-evening, May 29 V-into-late-evening, May 30 wind-flat-all-day. The dispatch outcomes track the shape: €77, €155, €66.
Price Duration Curve #
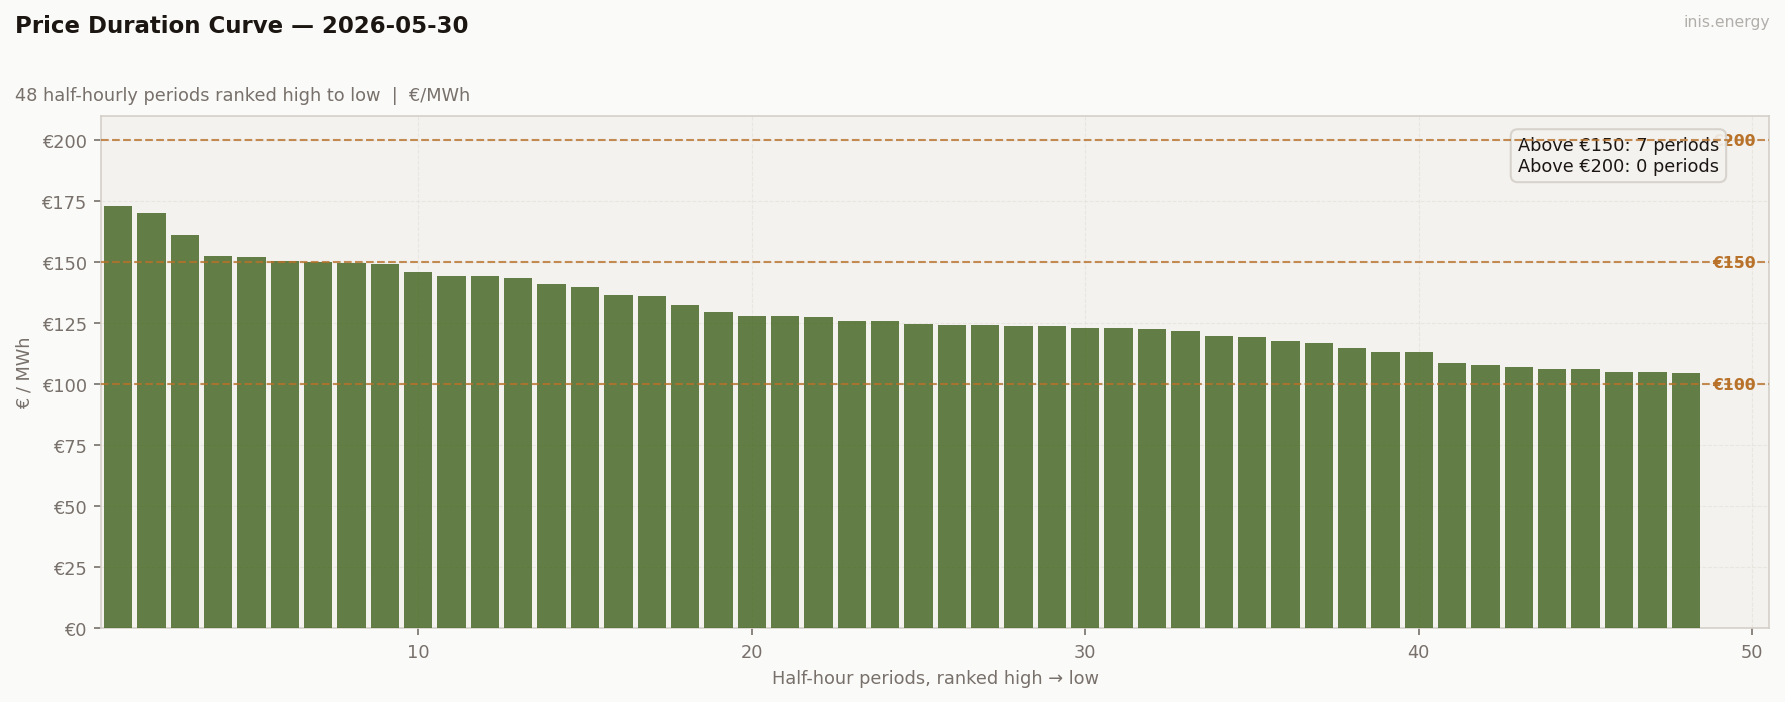
Periods above €150: 7 (15% of day) · Above €200: 0 (0% of day)
Today’s PDC has the cleanest “low-and-narrow” shape of the run — even more contained than May 13’s calm Wednesday. Forty-one of 48 periods cleared below €150; the bottom 12 averaged €110; the top 7 are heavily boundary-distorted.
Strip the boundary periods and the underlying Saturday PDC is essentially flat: 46 periods within €120–155. This is what the wind-rich weekend with no morning peak looks like in its purest form. A consumer’s dream, a flexibility operator’s nightmare.
Price Spread #
Captured spread: €46/MWh · Charge: €105/MWh (13:00) · Discharge: €151/MWh (20:00)
BESS Dispatch Signal #
| Price | Time | Energy | Value | |
|---|---|---|---|---|
| Charge | €105/MWh | 13:00 | 2 MWh | −€210 |
| Discharge | €151/MWh | 20:00 | 1.7 MWh (85% RTE) | +€257 |
| Gross profit | €47 | |||
| Price spread | €46/MWh | ROI: 22.2% |
Simulated 1MW/2MWh battery, one optimal DAM cycle. Gross before network charges and capacity costs.
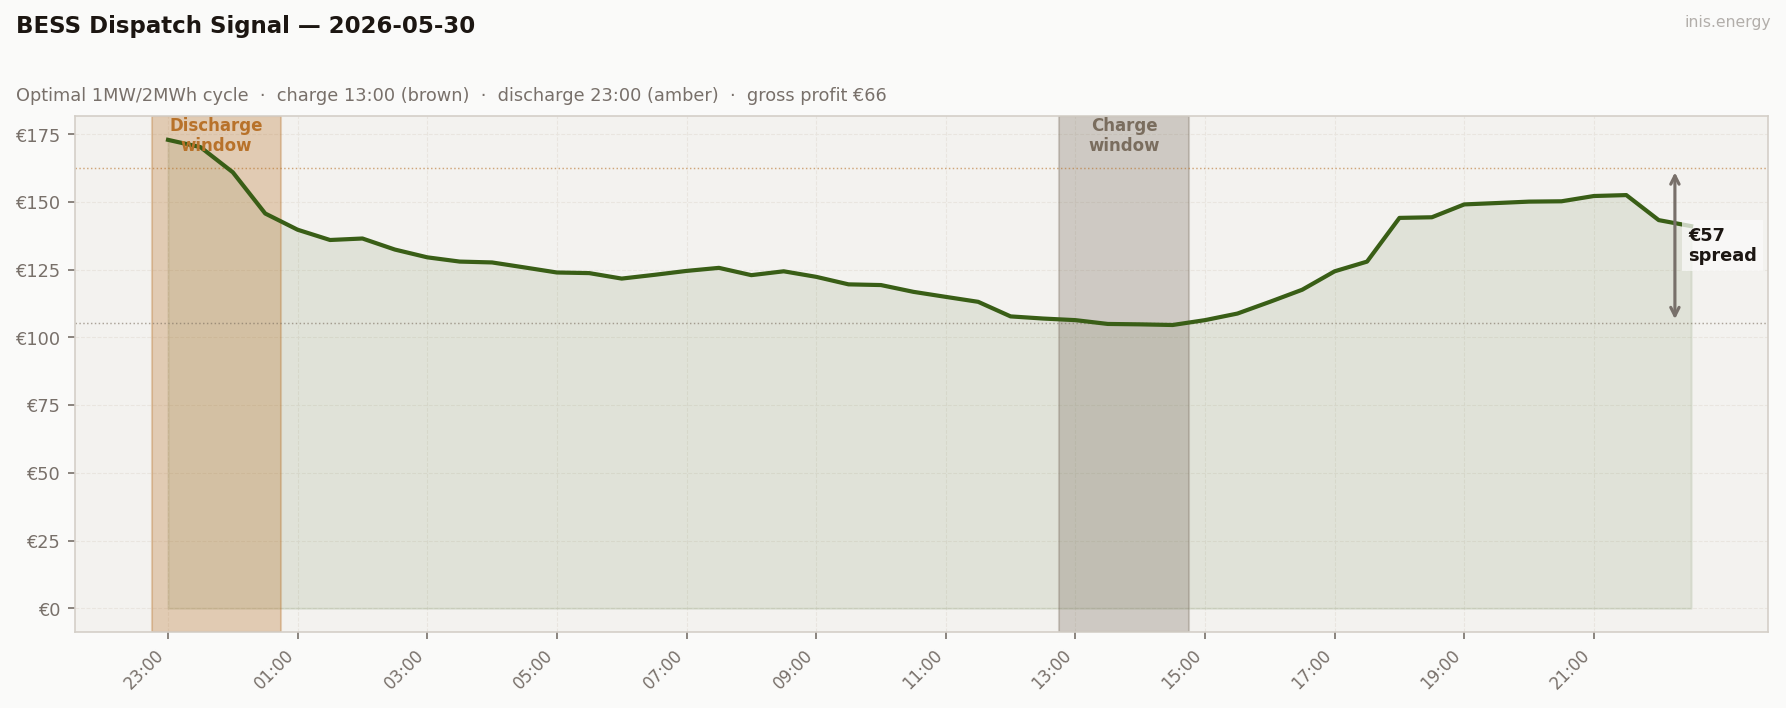
Updated 2026-08-27: the BESS simulation previously allowed the discharge window to occur before the charge window ended, which is physically impossible for a battery — in this case, by picking periods 1–4 (23:00–00:30), which are Friday’s evening peak crossing the SEM day boundary and sit before Saturday’s own 13:00 charge. Recalculated enforcing charge-before-discharge; gross profit corrected from €66 to €47.
€47 gross — one of the run’s weaker BESS days on its own terms. The four consecutive highest-priced half-hours in Saturday’s file are actually periods 1–4 (23:00–00:30, €162.50 avg), Friday’s evening peak spilling across the SEM day boundary — but those precede the 13:00 charge, so they’re out of reach. The real, causally-valid discharge is Saturday’s own evening window (20:00, €151 avg), €13 lower than the boundary block. Saturday was a genuinely calm underlying day, and the corrected number reflects that rather than an artefact of the SEM day’s 23:00 boundary.
Commentary #
A boundary-distorted Saturday on a genuinely calm underlying day. The headline peak (€172.98 at 23:00) is Friday’s late-evening scarcity spilling into Saturday’s file — the SEM day boundary problem returning. Strip those periods and Saturday’s real intra-day range is just €121–153, the flattest underlying day of the working week. Wind held 24–47% with no shortfall, demand was at a weekend-low 3,567 MW, and the merit order ran gas-marginal at moderate load across virtually all 48 half-hours.
The boundary effect is the second major distortion on this Saturday. The off-peak window (22:00–07:00) caught Friday’s late-evening scarcity tail at the start and Saturday’s own elevated overnight at the end — producing a technically elevated overnight average on a day where the real cheap hours were midday. On a genuinely calm Saturday, the cheap hours are in the middle of the day, not overnight; a rolling 24h window would read this correctly where the SEM-DA window cannot.
For storage, €47 gross — the genuinely reachable trade, once the Friday-spillover block (periods 1–4, averaging €163) is correctly excluded as pre-charge. The real discharge is Saturday’s own evening peak (€151 at 20:00). It’s a smaller number than the boundary block would have suggested, and a more honest one: today’s real dispatch opportunity was thin, on a calm underlying day.
Half-hourly data — 2026-05-30
| Period | Time | Price (€/MWh) | Wind % |
|---|---|---|---|
| 1 | 23:00 | 172.98 | 33.2% |
| 2 | 23:30 | 170.30 | 35.2% |
| 3 | 00:00 | 161.00 | 23.9% |
| 4 | 00:30 | 145.78 | 24.7% |
| 5 | 01:00 | 139.79 | 26.3% |
| 6 | 01:30 | 136.00 | 27.0% |
| 7 | 02:00 | 136.55 | 24.3% |
| 8 | 02:30 | 132.47 | 25.7% |
| 9 | 03:00 | 129.60 | 28.8% |
| 10 | 03:30 | 128.03 | 33.4% |
| 11 | 04:00 | 127.71 | 34.2% |
| 12 | 04:30 | 125.87 | 37.3% |
| 13 | 05:00 | 124.00 | 39.7% |
| 14 | 05:30 | 123.77 | 42.8% |
| 15 | 06:00 | 121.75 | 42.3% |
| 16 | 06:30 | 123.12 | 44.0% |
| 17 | 07:00 | 124.58 | 42.3% |
| 18 | 07:30 | 125.71 | 42.2% |
| 19 | 08:00 | 123.02 | 42.2% |
| 20 | 08:30 | 124.44 | 40.7% |
| 21 | 09:00 | 122.40 | 42.5% |
| 22 | 09:30 | 119.62 | 40.6% |
| 23 | 10:00 | 119.36 | 40.6% |
| 24 | 10:30 | 116.86 | 45.5% |
| 25 | 11:00 | 115.00 | 44.8% |
| 26 | 11:30 | 113.17 | 41.9% |
| 27 | 12:00 | 107.79 | 46.5% |
| 28 | 12:30 | 107.00 | 46.1% |
| 29 | 13:00 | 106.41 | 44.5% |
| 30 | 13:30 | 105.00 | 42.5% |
| 31 | 14:00 | 104.85 | 39.6% |
| 32 | 14:30 | 104.61 | 39.9% |
| 33 | 15:00 | 106.41 | 42.6% |
| 34 | 15:30 | 108.84 | 40.9% |
| 35 | 16:00 | 113.16 | 41.4% |
| 36 | 16:30 | 117.64 | 40.4% |
| 37 | 17:00 | 124.44 | 41.2% |
| 38 | 17:30 | 128.02 | 38.8% |
| 39 | 18:00 | 144.16 | 38.6% |
| 40 | 18:30 | 144.39 | 38.0% |
| 41 | 19:00 | 149.14 | 35.5% |
| 42 | 19:30 | 149.64 | 33.5% |
| 43 | 20:00 | 150.17 | 31.9% |
| 44 | 20:30 | 150.29 | 30.1% |
| 45 | 21:00 | 152.24 | 29.3% |
| 46 | 21:30 | 152.58 | 30.0% |
| 47 | 22:00 | 143.34 | 33.7% |
| 48 | 22:30 | 141.12 | 34.8% |
Compare your business electricity and gas rates in minutes with INIS Energy Brokers.
Compare rates