I-SEM Daily Briefing — 31 May 2026
Table of Contents
Market Snapshot
| Metric | Value |
|---|---|
| Mean DAM Price | €136.99/MWh |
| Median Price | €126.9/MWh |
| Std Dev | €24.9/MWh |
| Peak Price | €196.68/MWh (18:30) |
| Min Price | €114.0/MWh (14:30) |
| Price Range | €82.68/MWh |
| Periods above €150 | 10 of 48 (21%) |
| Periods above €200 | 0 of 48 (0%) |
| Peak Avg (07–22) | €140.93/MWh |
| Off-peak Avg (22–07) | €130.42/MWh |
| BESS Captured Spread | €76/MWh |
| Wind % of Demand | 32.3% |
| Wind Range | 21.6%–52.4% |
| Mean Demand | 3430 MW |
Price Profile #
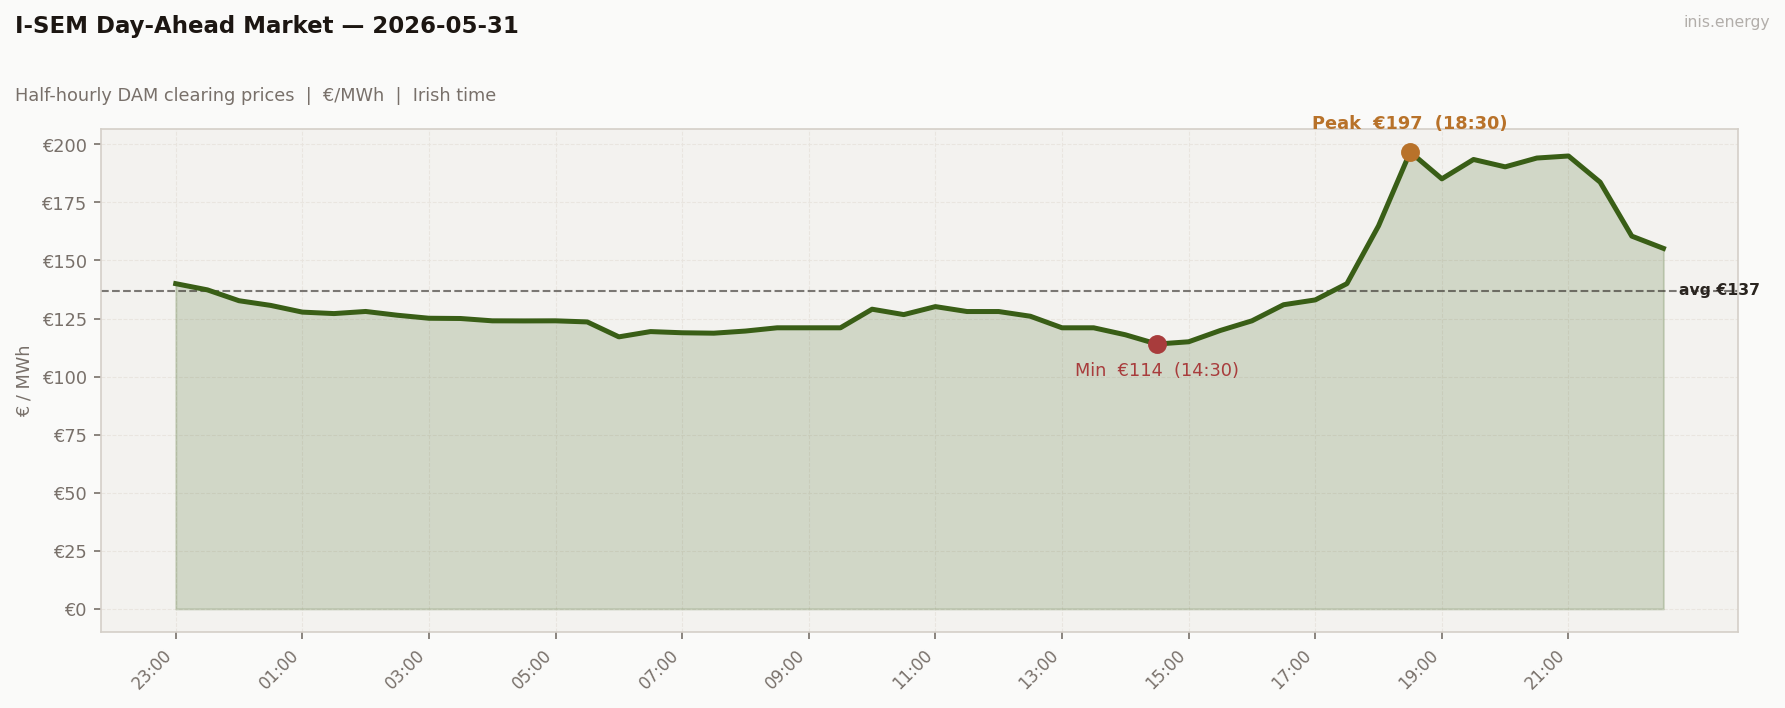
Std dev €24.9/MWh · Median €126.9/MWh · Periods above €150: 10 of 48 (21%)
Sunday, a near-scarcity event without quite breaking €200. Mean €136.99, peak €196.68 at 18:30, range €82.68. The evening peak built sharply but topped just below the scarcity threshold — three periods cleared €193–197 but none crossed €200.
Periods 1–2 (€140, €137 at 23:00–23:30 with wind at 52%) look real this time — Saturday’s tail faded to €141 at 22:30, and the €140 at 23:00 fits the trend. The wind boundary glitch is in period 3 only (54% → 36%).
Overnight ran €123–140 from 01:00 to 06:30. Morning ramp barely existed — €117 at 06:00 → €121 at 07:00 to 09:30 (flat), no morning peak. Wind held 22–28% through the working day (relatively low) but Sunday’s softened demand kept midday prices contained at €114–130 from 10:00 to 16:00, with the floor at €114.00 at 14:30.
Then the evening built: €117 at 15:00 → €131 at 16:30 → €165 at 18:00 → €197 at 18:30 (one-period spike), holding €185–195 across 19:00–21:00 before fading to €155 at 22:30.
10 of 48 periods cleared above €150; 0 above €200. Near-miss scarcity.
Price vs Wind #
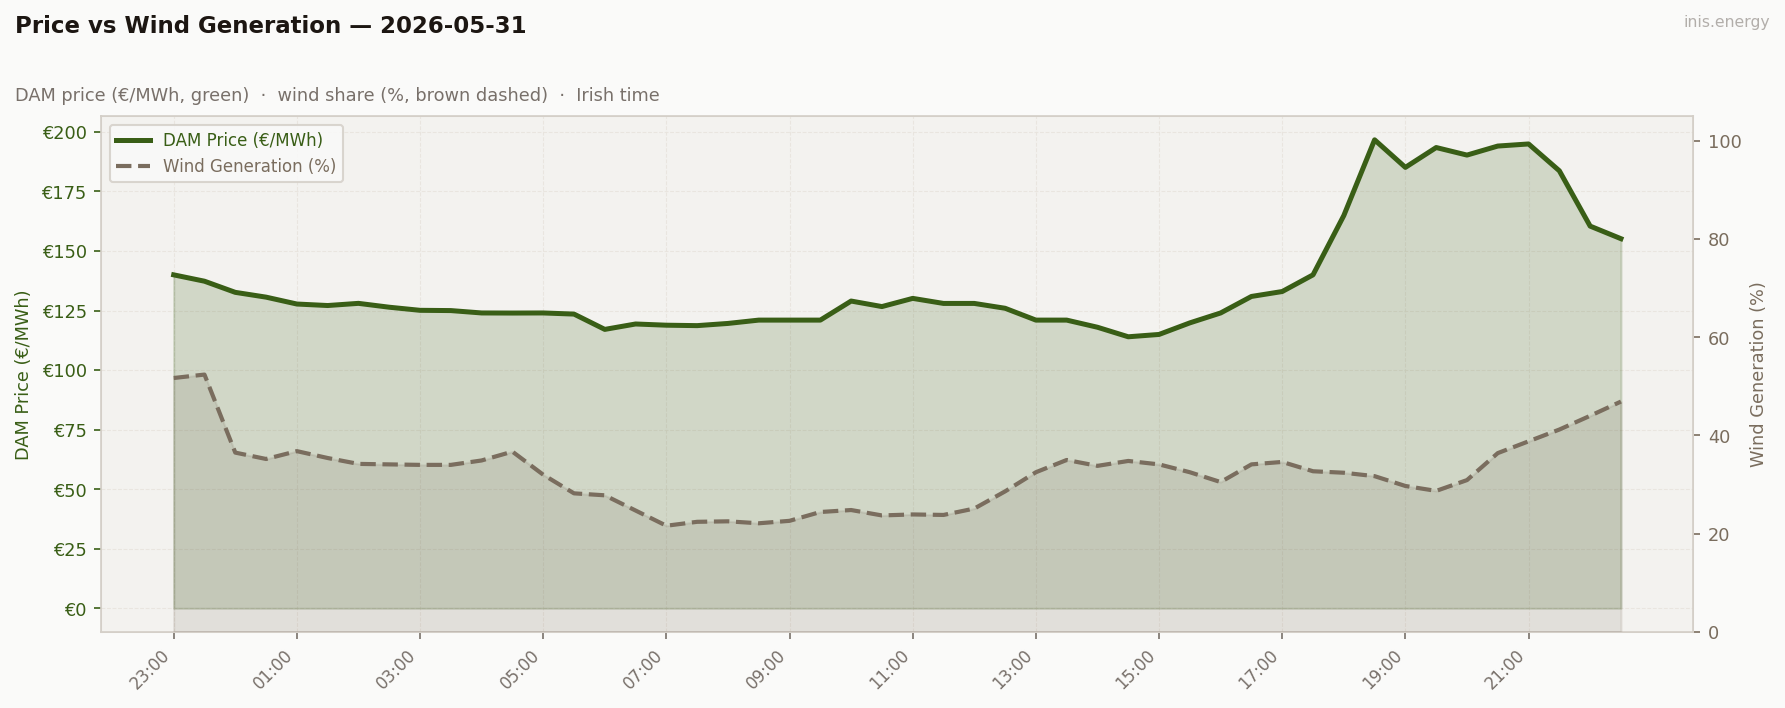
Mean wind: 32.3% · Range: 21.6%–52.4%
V-into-evening wind shape, modest depth. Wind held 35–52% overnight (peak at 04:00–05:30), drained through the morning to 24% by 06:30, held 22–28% through the working day (the day’s lowest sustained wind window), and then drifted back up through the evening — 30% at 18:30, 38% at 21:00, 47% by 22:30.
The evening recovery is what kept this off the scarcity board. From 18:30 (the €197 peak), wind climbed from 32% to 41% over the next 2 hours. That recovery is what capped the peak at €197 rather than letting it climb through €200 like May 29’s evening did. Wind recovery during a peak window is the difference between a near-scarcity day and a scarcity day.
Compare to May 29: same V-into-evening shape, similar wind levels, but May 29’s wind kept falling (35% → 14%) while May 31’s wind started recovering (32% → 41%). Net result: May 29’s evening cleared €200+ for 3 periods; May 31’s evening cleared at €197 but never crossed.
Week in Context #
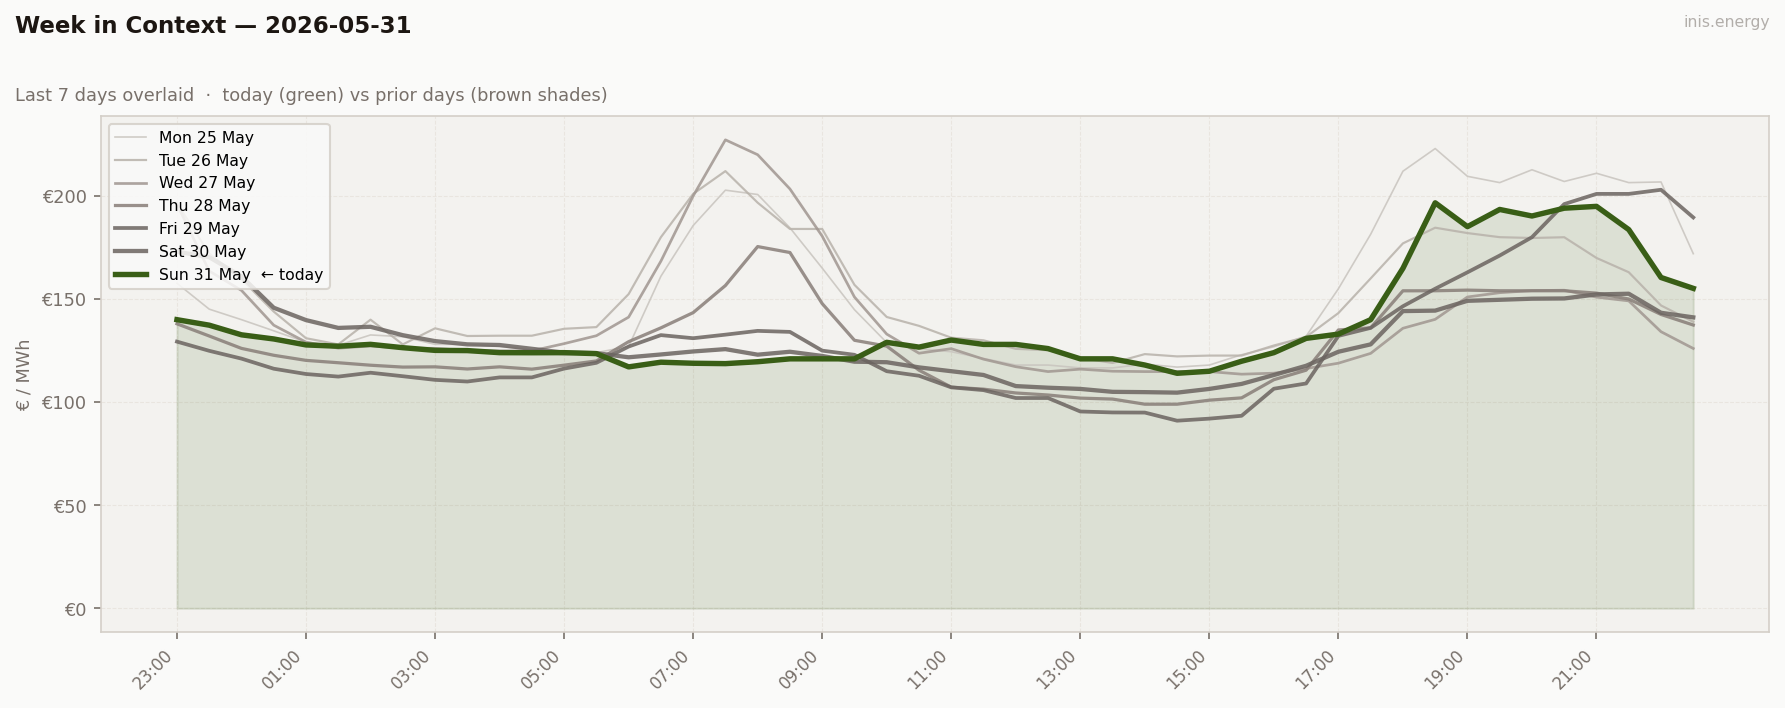
Three weekend days (May 30, 31, June 1) bookending the wind-shape variance week. Sunday’s near-miss is the bridge: the wind shape was right for scarcity but the wind recovery saved the merit order from climbing into peakers.
Price Duration Curve #
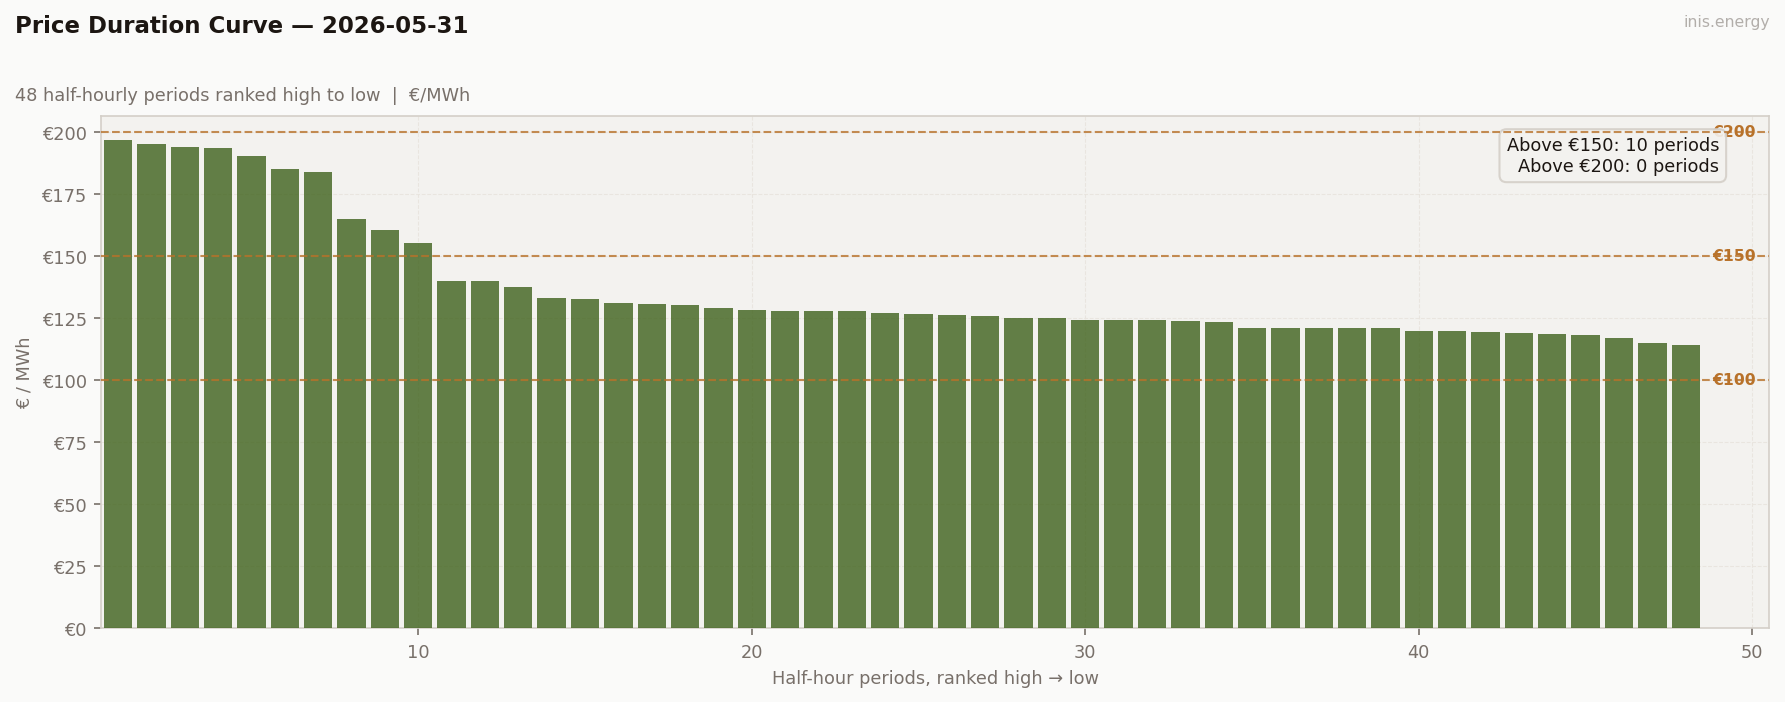
Periods above €150: 10 (21% of day) · Above €200: 0 (0% of day)
The PDC has a sharp single-peak top (1 period at €197) followed by a smooth descending shelf through the evening cluster (9 more periods €152–195) and a long gradual mid-section through the working-day prices. No real flat trough — the cheapest 4 periods averaged €115.
The shape signals “shaped day, no scarcity.” A real evening peak that’s worth capturing but doesn’t break into peakers. From a BESS perspective, a clean spread-capture day in the wider €80 range.
Price Spread #
Captured spread: €76/MWh · Charge: €117/MWh (14:00) · Discharge: €193/MWh (19:30)
BESS Dispatch Signal #
| Price | Time | Energy | Value | |
|---|---|---|---|---|
| Charge | €117/MWh | 14:00 | 2 MWh | −€233 |
| Discharge | €193/MWh | 19:30 | 1.7 MWh (85% RTE) | +€328 |
| Gross profit | €95 | |||
| Price spread | €76/MWh | ROI: 40.7% |
Simulated 1MW/2MWh battery, one optimal DAM cycle. Gross before network charges and capacity costs.
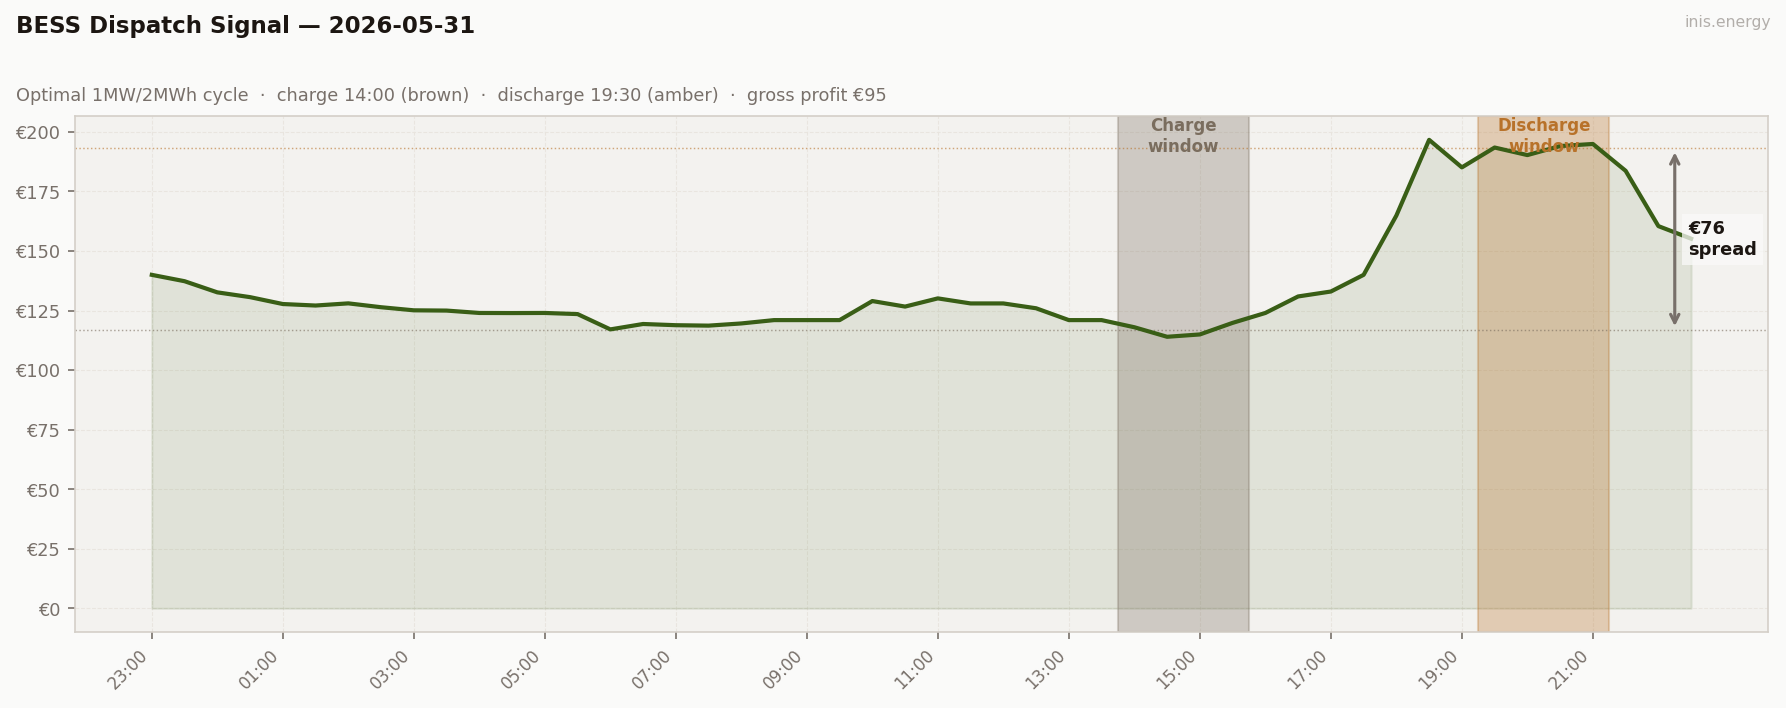
€95 gross — solid mid-range Sunday. Charge €117 in the midday trough (14:00–15:30 at €117 avg), discharge €193 in the evening peak (19:30–21:00 at €193 avg). Captured spread €76, ROI 40.7% on the €233 charge cost.
The dispatch picked the evening cleanly — the morning had no peak to compete with. The captured spread €76 is reasonable; what matters analytically is that the spread failed to enter top-tier territory because the evening peak failed to break €200. One more percentage point of wind drainage during the 18:00–19:00 window and today would have been a top-5 day at ~€130 gross. The threshold for top-tier BESS revenue sits around the €200 line — and today missed it by €3.
Commentary #
Sunday, a near-scarcity event with the evening peak topping at €196.68 — three euros short of the scarcity threshold. Wind held 22–28% through the working day (the day’s lowest sustained wind window), but recovered through the evening from 30% to 47% as the peak built. That recovery was the difference between a near-miss and a top-5 BESS day. Compare to May 29: same V-into-evening wind shape, similar wind levels, but May 29’s wind kept falling while May 31’s wind started climbing — and May 29 cleared €203, May 31 cleared €197.
The structural reading: there’s a discontinuous reward function at the €200/MWh threshold. Peakers price in at €200+; gas at high load prices at €175–195. The merit order doesn’t smoothly climb through €200 — it steps into peaker bids. A day that climbs to €197 and stops looks similar to a day that climbs to €203 in everyday statistics; for BESS revenue they differ by ~€30–40 gross on a single cycle. Forecasting the scarcity threshold (binary) matters more than forecasting the peak price (continuous).
For storage, €95 gross — solid Sunday in the mid-range, captured spread €76. The day failed to break into top-tier BESS revenue by 3 euros on the discharge price. Top-tier BESS days are scarcity days; near-miss days are mid-range days; the binary distinction is the €200 threshold. That’s the structural rule emerging from the data — a useful one for any operator modelling BESS revenue distributions.
Half-hourly data — 2026-05-31
| Period | Time | Price (€/MWh) | Wind % |
|---|---|---|---|
| 1 | 23:00 | 140.00 | 51.7% |
| 2 | 23:30 | 137.33 | 52.4% |
| 3 | 00:00 | 132.65 | 36.5% |
| 4 | 00:30 | 130.64 | 35.2% |
| 5 | 01:00 | 127.75 | 36.8% |
| 6 | 01:30 | 127.12 | 35.4% |
| 7 | 02:00 | 128.03 | 34.2% |
| 8 | 02:30 | 126.41 | 34.1% |
| 9 | 03:00 | 125.11 | 34.0% |
| 10 | 03:30 | 125.00 | 34.0% |
| 11 | 04:00 | 124.00 | 34.9% |
| 12 | 04:30 | 123.96 | 36.7% |
| 13 | 05:00 | 124.00 | 32.0% |
| 14 | 05:30 | 123.53 | 28.2% |
| 15 | 06:00 | 117.10 | 27.8% |
| 16 | 06:30 | 119.37 | 24.7% |
| 17 | 07:00 | 118.86 | 21.6% |
| 18 | 07:30 | 118.68 | 22.4% |
| 19 | 08:00 | 119.60 | 22.5% |
| 20 | 08:30 | 121.00 | 22.1% |
| 21 | 09:00 | 121.00 | 22.6% |
| 22 | 09:30 | 121.00 | 24.4% |
| 23 | 10:00 | 129.00 | 24.8% |
| 24 | 10:30 | 126.68 | 23.7% |
| 25 | 11:00 | 130.12 | 23.9% |
| 26 | 11:30 | 128.00 | 23.8% |
| 27 | 12:00 | 128.00 | 25.1% |
| 28 | 12:30 | 125.97 | 28.6% |
| 29 | 13:00 | 121.00 | 32.5% |
| 30 | 13:30 | 121.00 | 35.0% |
| 31 | 14:00 | 118.00 | 33.8% |
| 32 | 14:30 | 114.00 | 34.8% |
| 33 | 15:00 | 114.98 | 34.1% |
| 34 | 15:30 | 119.84 | 32.5% |
| 35 | 16:00 | 124.00 | 30.5% |
| 36 | 16:30 | 130.93 | 34.1% |
| 37 | 17:00 | 133.00 | 34.6% |
| 38 | 17:30 | 140.00 | 32.7% |
| 39 | 18:00 | 164.90 | 32.4% |
| 40 | 18:30 | 196.68 | 31.7% |
| 41 | 19:00 | 185.12 | 29.7% |
| 42 | 19:30 | 193.45 | 28.7% |
| 43 | 20:00 | 190.28 | 30.9% |
| 44 | 20:30 | 194.07 | 36.4% |
| 45 | 21:00 | 194.95 | 38.8% |
| 46 | 21:30 | 183.68 | 41.2% |
| 47 | 22:00 | 160.46 | 44.0% |
| 48 | 22:30 | 155.18 | 46.9% |
Compare your business electricity and gas rates in minutes with INIS Energy Brokers.
Compare rates