I-SEM Daily Briefing — 1 June 2026
Table of Contents
Market Snapshot
| Metric | Value | |———————-|————— ——| | Mean DAM Price | €131.68/MWh | | Median Price | €124.01/MWh | | Std Dev | €20.71/MWh | | Peak Price | €174.29/MWh (19:30) | | Min Price | €106.54/MWh (15:00) | | Price Range | €67.75/MWh | | Periods above €150 | 10 of 48 (21%) | | Periods above €200 | 0 of 48 (0%) | | Peak Avg (07–22) | €133.24/MWh | | Off-peak Avg (22–07) | €129.07/MWh | | BESS Captured Spread | €63/MWh | | Wind % of Demand | 36.1% | | Wind Range | 14.8%–55.7% | | Mean Demand | 3553 MW |
Price Profile #
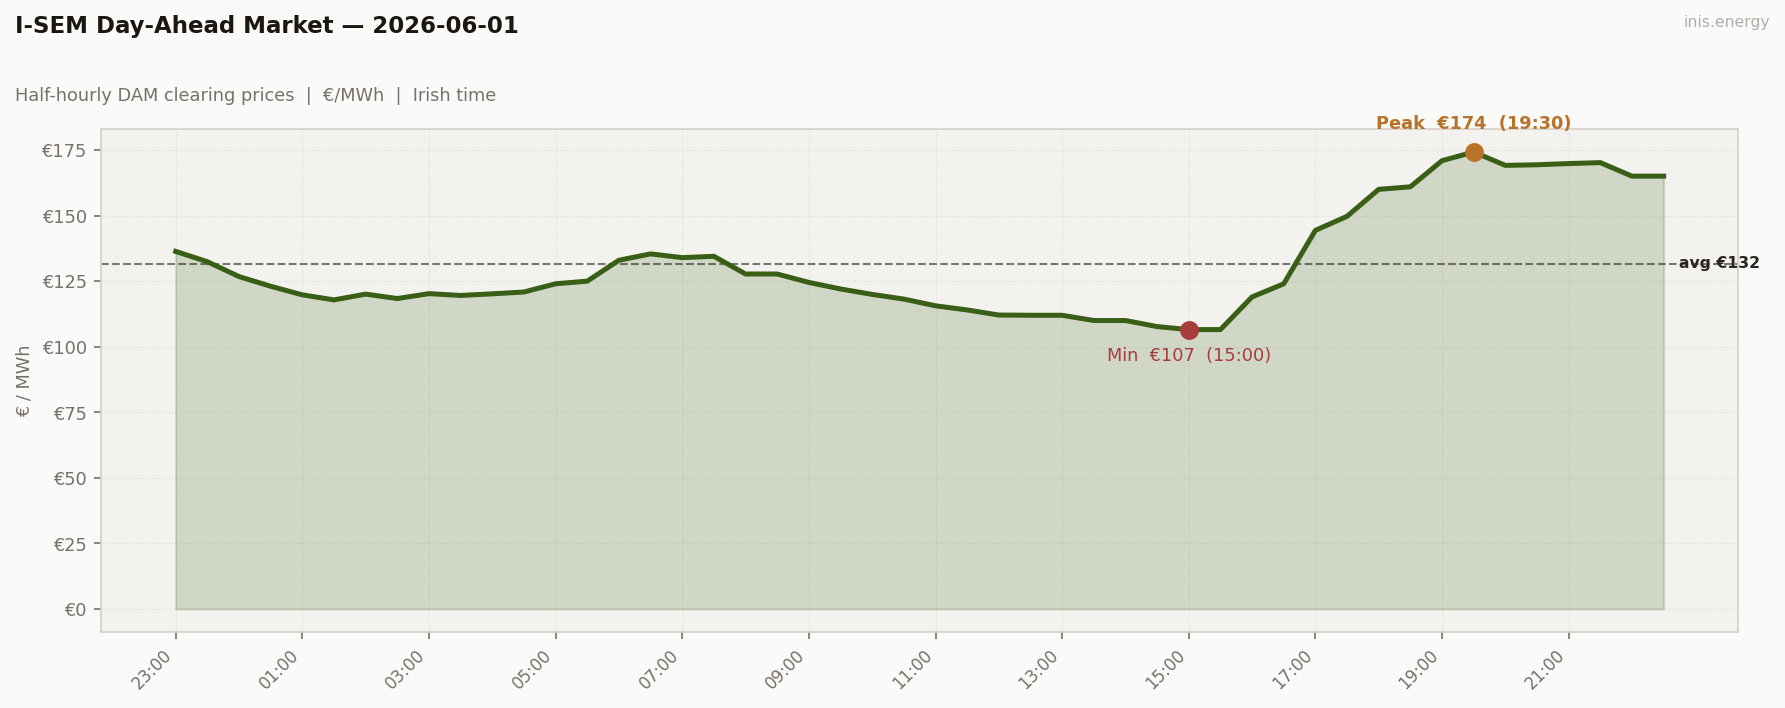
Std dev €20.71/MWh · Median €124.01/MWh · Periods above €150: 10 of 48 (21%)
Irish June bank holiday Monday. Mean €131.68, peak €174.29 at 19:30, range €67.75. A calm bank holiday with moderate-to-high wind and no scarcity — the third bank holiday in the series, and the third distinct wind regime.
Periods 1–2 (€136, €132 at 23:00–23:30 with wind at 15%) carry Sunday’s evening tail across the boundary — wind data is glitched (period 3 jumps to 53%), but the prices are continuous with Sunday’s fade. The “real” June 1 starts at 00:00 with €127 and falls cleanly: €120 by 01:30, €118 by 02:30, into a soft overnight floor of €118–125 through 05:30. Wind held 47–56% across overnight.
The morning was almost non-existent. €133 at 06:00 → €135 at 06:30 → fell to €128 by 08:00 → bottom of €118 at 10:30. Bank holiday demand softened the ramp out of existence entirely — there’s no morning peak feature in the chart at all.
Midday belly held €107–127 from 09:30 to 16:00 — six and a half hours of shallow trough, with the floor at €106.54 at 15:00–15:30. Evening built smoothly: €119 at 16:00 → €145 at 17:00 → €174 at 19:30. Then held €165–175 across 20:00 to 22:30 — a sustained four-and-a-half-hour evening plateau.
10 of 48 periods cleared above €150; zero above €200.
Price vs Wind #
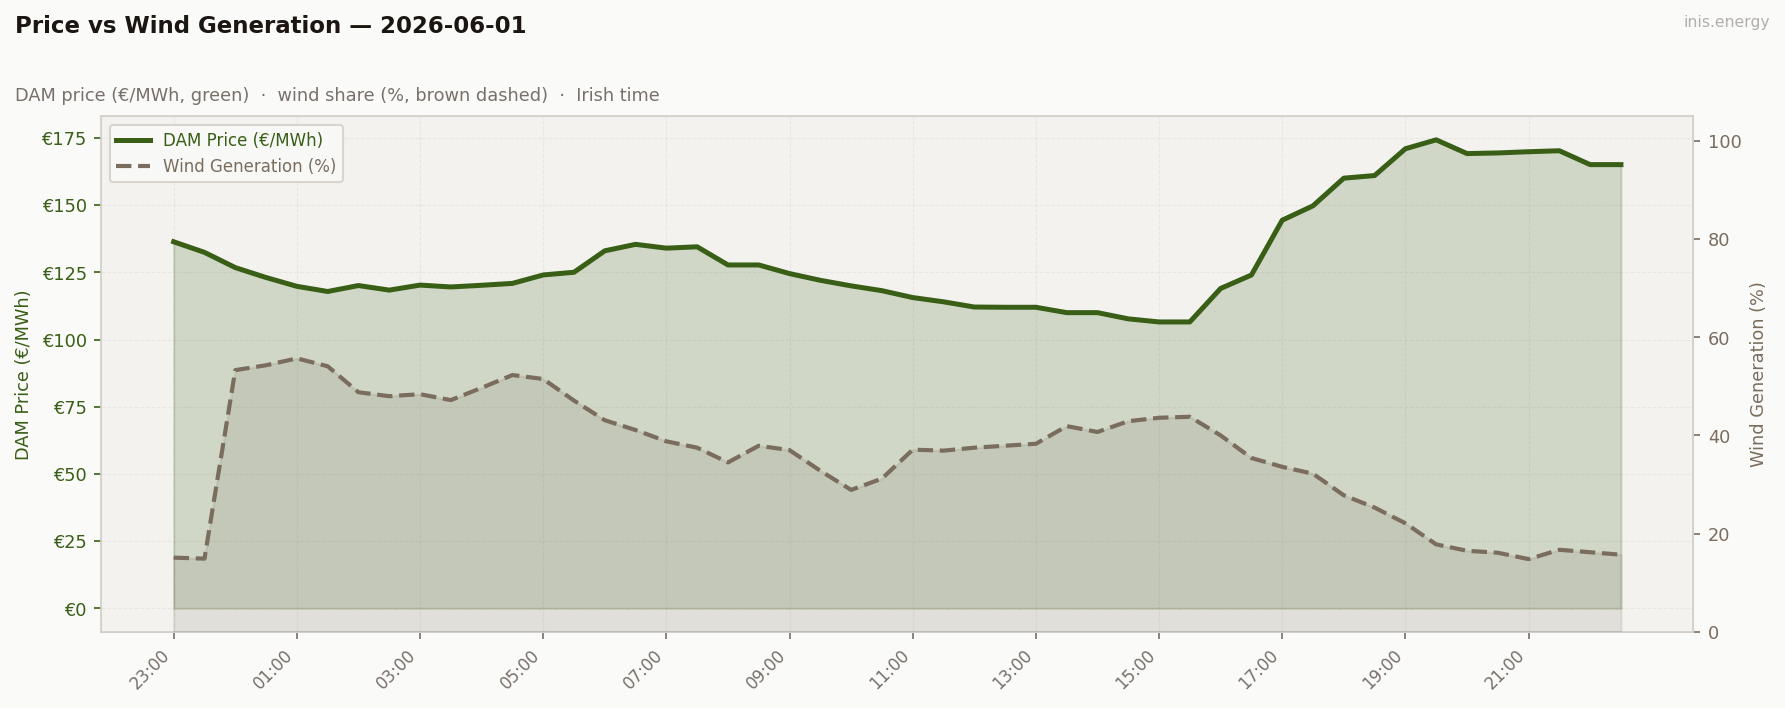
Mean wind: 36.1% · Range: 14.8%–55.7%
V-into-evening wind shape, but with a different signature than yesterday’s. Wind started at 47–56% overnight, declined through the morning to ~30% (at 08:00–10:00), recovered slightly to 37–43% through the midday belly, then drained sharply through the evening: 38% at 17:00 → 28% at 18:00 → 18% at 20:00 → 14.8% at 21:00 (the day’s minimum), recovered marginally to 17% by 22:30.
The evening shortfall was real (14.8% is genuinely low — comparable to the May 29 evening) — but bank holiday demand suppression (3,553 MW, ~400 MW below working-week levels) prevented the merit order from climbing into scarcity. Same wind level as May 29’s evening (where €200+ printed), but ~400 MW less demand — and the peak topped at €174 rather than €203.
This is the bank holiday × low evening wind combination, and it’s the cleanest test of the demand-vs-wind balance in the entire series. May 29: ~3,675 MW demand at 14% evening wind → €203 peak (scarcity). Jun 1: 3,553 MW at 14.8% wind → €174 peak (no scarcity). 120 MW of demand suppression on otherwise-identical wind conditions removed the scarcity event. A useful slope estimate: roughly €30 of peak price per 120 MW of demand at low-wind conditions.
Week in Context #
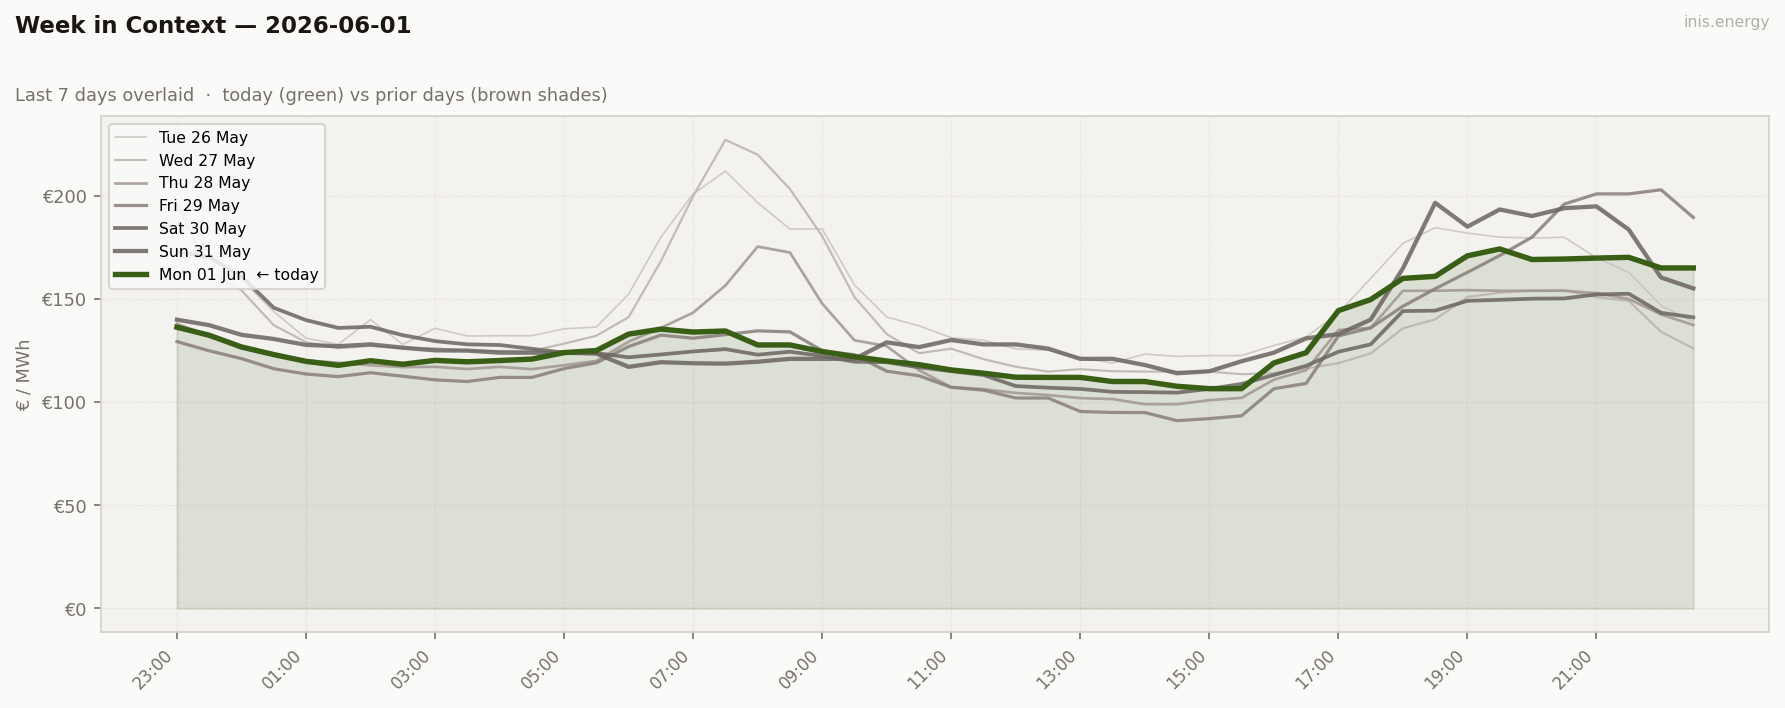
The third bank holiday in the run, third wind regime, third price outcome:
| Wind | Demand | Mean | Peak | Scarcity | |
|---|---|---|---|---|---|
| May 4 (May Day) | 13% | 3,633 | €152 | €213 | 0 |
| May 25 (Spring) | 3.7% | 3,706 | €152 | €223 | 11 |
| Jun 1 (June) | 36% | 3,553 | €132 | €174 | 0 |
Same demand range across all three; wind explains everything. May 25’s scarcity event came from the wind drought; May 4 had moderate wind and a contained day; June 1 has high wind and the calmest of the three. Bank holidays carry the same demand signature; the wind regime determines the price outcome.
Price Duration Curve #
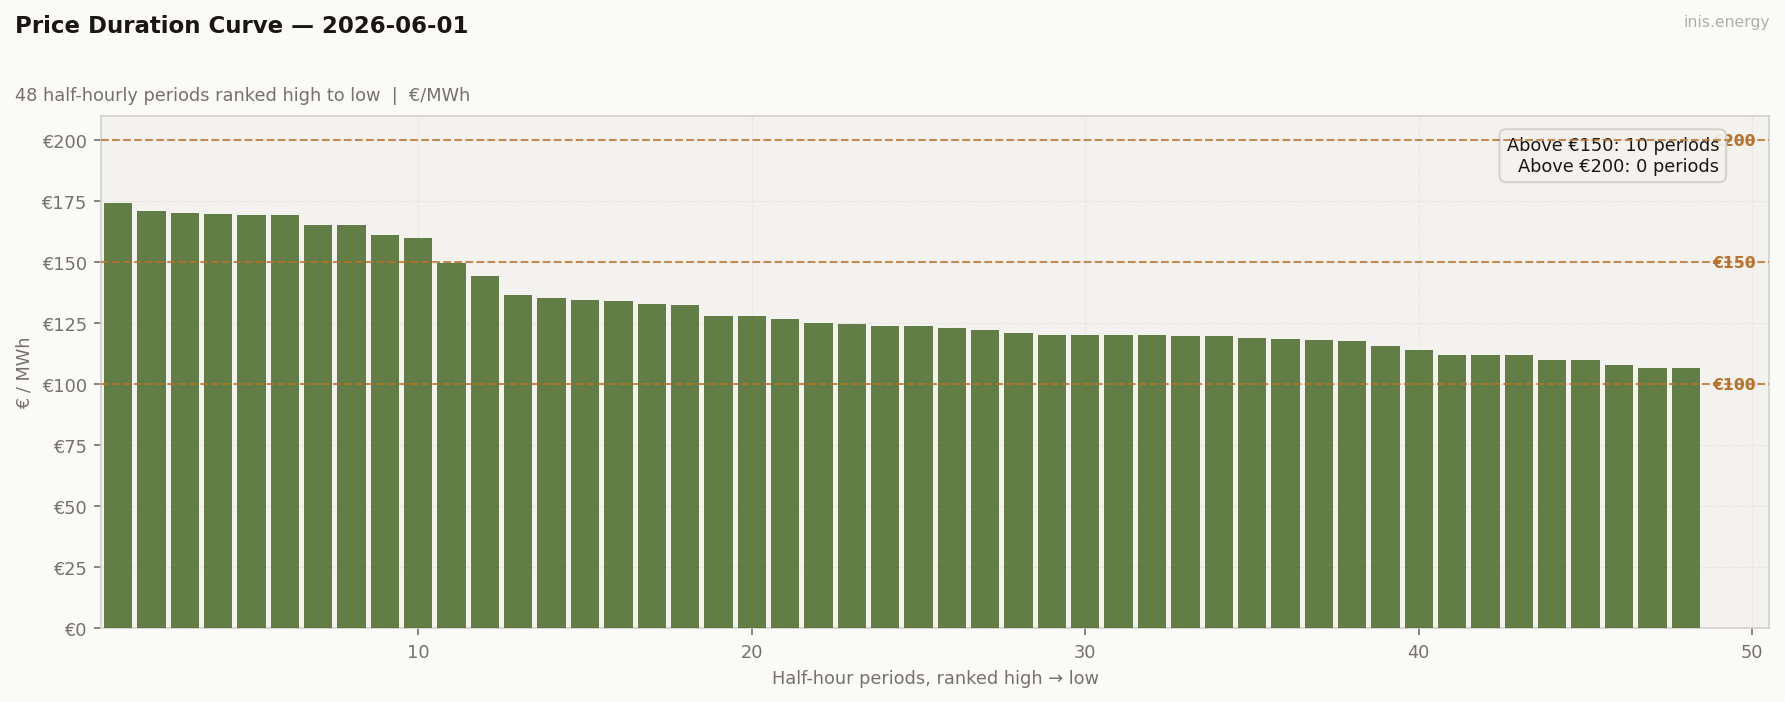
Periods above €150: 10 (21% of day) · Above €200: 0 (0% of day)
A clean two-tier PDC: a sustained top shelf (10 periods €152–174 — the evening plateau), a moderate mid-section (15 periods €127–149 — the overnight floor plus shoulders), and a cheap tail (10 periods below €120). The shape is similar to May 28’s PDC — both have a moderate top shelf with no scarcity spike.
The curve signals “moderate-spread day with reliable evening peak” — a forecastable shape for an operator. The BESS captured spread (€63) is exactly what this PDC promises.
Price Spread #
Captured spread: €63/MWh · Charge: €108/MWh (14:00) · Discharge: €171/MWh (19:00)
BESS Dispatch Signal #
| Price | Time | Energy | Value | |
|---|---|---|---|---|
| Charge | €108/MWh | 14:00 | 2 MWh | −€215 |
| Discharge | €171/MWh | 19:00 | 1.7 MWh (85% RTE) | +€291 |
| Gross profit | €75 | |||
| Price spread | €63/MWh | ROI: 34.9% |
Simulated 1MW/2MWh battery, one optimal DAM cycle. Gross before network charges and capacity costs.
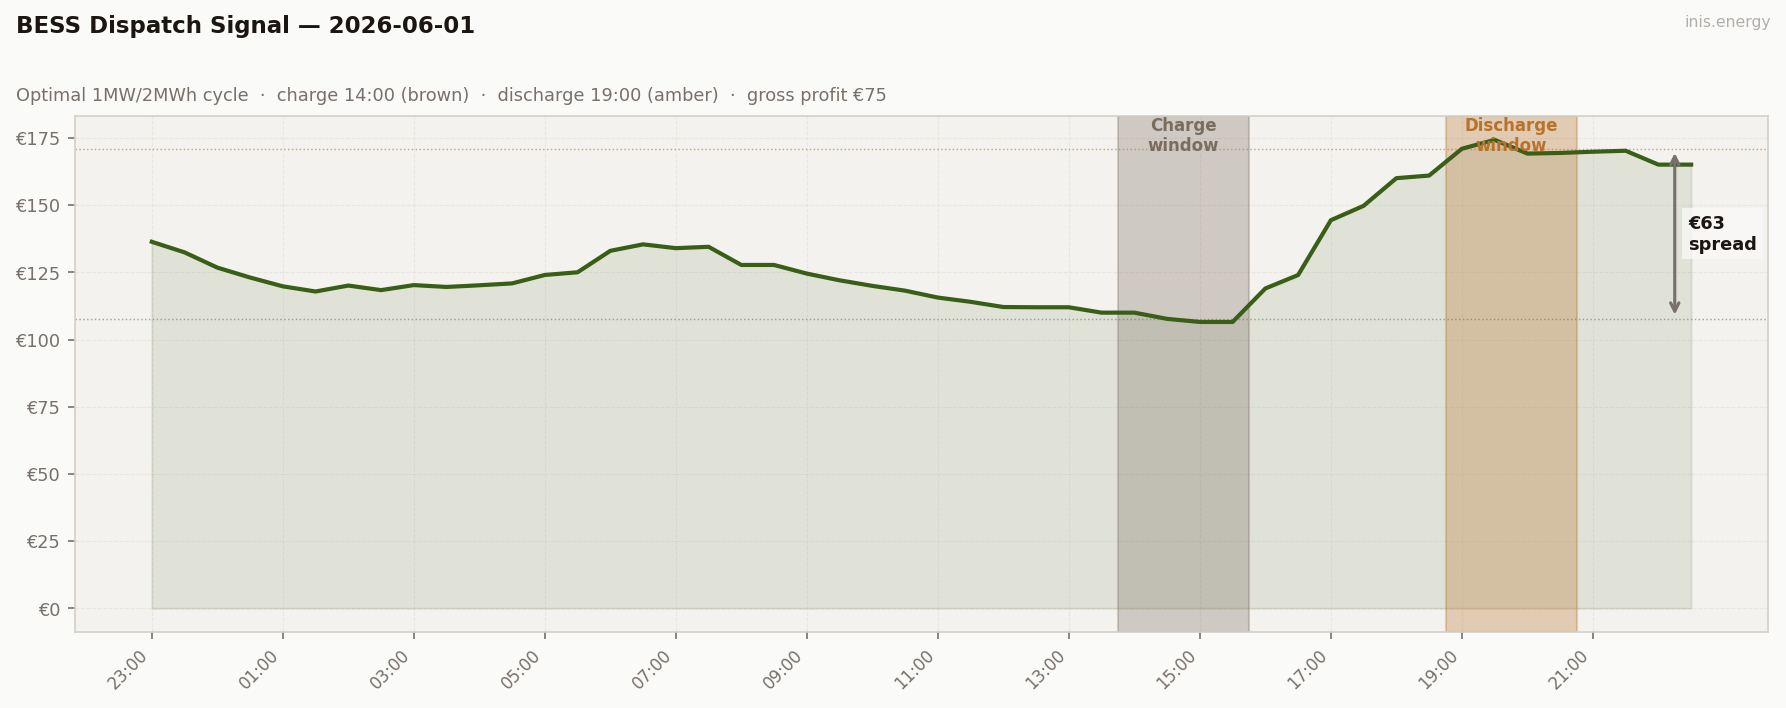
€75 gross — mid-range BESS, third-best of the six-day arc after May 29 (€155) and May 31 (€95).
Charge €108 in the midday trough (14:00–15:30 at €108 avg), discharge €171 in the evening plateau (19:00–20:30 at €171 avg). Captured spread €63, ROI 34.9% on the €215 charge cost. Standard wind-recovered weekend-shaped dispatch.
Commentary #
The Irish June bank holiday. Mean €131.68, no scarcity, evening peak at €174.29 — and the cleanest data point yet for the bank-holiday-times-wind interaction. Three bank holidays in the run now, three distinct wind regimes, three different price outcomes: May 4 (13% wind, €152 mean, no scarcity), May 25 (3.7% wind, €152 mean, 11 scarcity prints), June 1 (36% wind, €132 mean, no scarcity). Bank holidays themselves don’t drive prices — wind does. The demand suppression is a constant; the wind regime is the variable.
The day’s structural learning sits in the comparison to May 29. Same evening wind shortfall — 14.8% at 21:00 today vs ~14% during May 29’s late evening — but May 29 cleared €203, today cleared €174. The difference is ~120 MW of demand suppression. At low-wind conditions, roughly €30 of peak price moves per 120 MW of demand. The merit-order slope is now measurable at the scarcity threshold — which is exactly the analytical neighbourhood where flexibility assets earn most of their revenue.
For storage, €75 gross — mid-range, captured spread €63. Three structural conclusions worth surfacing: (1) mean wind doesn’t predict daily revenue; the morning or evening wind shortfall does. (2) Top-tier BESS days cluster on Fridays and weekends, not working-week peaks. (3) BESS revenue follows a binary threshold at €200/MWh — days that print scarcity are top-tier; days that don’t are mid-range, regardless of how close they came.
A note on the six-day arc #
The cleanest single observation for the period:
May 27–June 1: six consecutive days, six different wind shapes, six different BESS outcomes. Mean wind ranged 32–39% across all six (a 7-percentage-point band); BESS revenue ranged €32–€155 (nearly a 5× range). Wind level was effectively constant; wind shape drove almost a 5× variation in flexibility revenue. The salary-signal version: forecasting the next 24h mean wind is solved; forecasting the next 24h wind shape — specifically the depth and timing of the day’s worst half-hour — is where the value lives.
A note on the spread metric #
From today, this series retires the peak/off-peak spread and replaces it with the BESS captured spread as the primary price spread metric.
What the peak/off-peak spread was supposed to measure
The peak/off-peak spread takes the average DAM price during the day (07:00–22:00) and subtracts the average overnight price (22:00–07:00). The idea is simple: a large spread means electricity is much more expensive during the day than overnight, which is good for storage. A small spread means the market is flat, which is bad for storage.
That logic works in a simple, stable market. It breaks down in the Irish market most of the time.
Three ways the metric fails
1. The SEM day boundary problem
The I-SEM Day-Ahead Market runs from 23:00 to 22:30 — not midnight to midnight. That means the first two half-hours of every SEM day file (23:00 and 23:30) belong to the previous calendar day’s evening. When the previous evening was expensive, those high prices land in the current day’s off-peak window and push the off-peak average up — compressing or even inverting the spread.
May 30 is the clearest example. The previous evening (May 29) had three periods above €200 in the late evening. The first two of those crossed the SEM boundary into May 30’s file at 23:00 (€173) and 23:30 (€170). They inflated May 30’s off-peak average to €137.95, while the actual Saturday day — flat, wind-steady, no scarcity — averaged €124.36 in the peak window. Subtract them and the off-peak appears more expensive than the peak by fourteen euros. The market wasn’t inverted. The boundary was the problem. The same issue appeared on May 27 (Tuesday’s tail at €196, €164 crossing into Wednesday) and on multiple earlier days in the series.
2. Within-window dilution
The peak window (07:00–22:00) covers 30 half-hours. On shaped days, those 30 half-hours contain both the cheapest and the most expensive prices of the entire day — and the average of both extremes is a number that describes neither.
On May 29, the peak window contained: a gentle morning (€127–135), a deep midday trough (€91–122 — the second-cheapest trough of the 29-day run), and three late-evening scarcity prints (€201–203). Average: €129.47. The overnight window averaged €126.48. Reported spread: three euros. On a day with €112 of price range, three scarcity prints, and a BESS captured spread of €107. The metric reported “essentially flat” on one of the five most valuable flexibility days of the entire series.
3. Inverted-shape days
The metric assumes the cheap hours are overnight. On wind-rich weekend and bank holiday days, they aren’t — they’re midday. When high wind and low weekend demand push midday prices to €91–110, those hours sit inside the peak window and drag the peak average down. The peak window becomes cheaper than the off-peak window, and the spread inverts. This is a structural feature of the Irish market under high wind penetration, not a data error.
The numbers across the six days
| Day | Peak/Off-Peak Spread | BESS Captured Spread | Difference |
|---|---|---|---|
| May 27 | €3.88 | €39 | 10× |
| May 28 | €6.05 | €54 | 9× |
| May 29 | €2.99 | €107 | 36× |
| May 30 | −€13.59 | €46 | wrong sign |
| May 31 | €10.51 | €76 | 7× |
| Jun 1 | €4.17 | €63 | 15× |
On four of six days the peak/off-peak spread understates the actual BESS opportunity by an order of magnitude. On one day it reports the wrong sign entirely. The ratio ranges from 7× to 36×. There is no consistent relationship between the two numbers across different market shapes — which means the peak/off-peak spread can’t even be used as a rough scaling factor.
What the captured spread actually measures
The BESS captured spread is the price difference between the optimal discharge window and the optimal charge window, after accounting for the 85% round-trip efficiency of the battery. It’s the number that determines gross revenue directly: captured spread × 1.7 MWh = gross profit.
Unlike the peak/off-peak spread, the captured spread follows the actual price shape. On a morning-discharge day it measures the morning peak against the midday trough. On a scarcity evening it measures the scarcity block against the midday cheap window. It doesn’t get confused by the SEM boundary, by where the cheap hours fall in the calendar, or by averaging across a window that spans both extremes.
What changes
From today: the BESS captured spread is the primary spread metric. It appears in the Market Snapshot table and in the Price Spread section. The peak/off-peak chart is retired. The peak-window average (07:00–22:00) and off-peak average (22:00–07:00) remain in the Market Snapshot as raw reference numbers — they’re real data, occasionally worth looking at, just not worth combining into a spread.
Half-hourly data — 2026-06-01
| Period | Time | Price (€/MWh) | Wind % |
|---|---|---|---|
| 1 | 23:00 | 136.36 | 15.1% |
| 2 | 23:30 | 132.43 | 14.9% |
| 3 | 00:00 | 126.76 | 53.3% |
| 4 | 00:30 | 123.07 | 54.3% |
| 5 | 01:00 | 119.79 | 55.7% |
| 6 | 01:30 | 117.87 | 54.1% |
| 7 | 02:00 | 120.08 | 48.8% |
| 8 | 02:30 | 118.38 | 48.0% |
| 9 | 03:00 | 120.25 | 48.4% |
| 10 | 03:30 | 119.56 | 47.2% |
| 11 | 04:00 | 120.18 | 49.7% |
| 12 | 04:30 | 120.88 | 52.3% |
| 13 | 05:00 | 124.02 | 51.5% |
| 14 | 05:30 | 125.02 | 47.1% |
| 15 | 06:00 | 133.00 | 43.1% |
| 16 | 06:30 | 135.41 | 41.1% |
| 17 | 07:00 | 133.99 | 38.8% |
| 18 | 07:30 | 134.50 | 37.5% |
| 19 | 08:00 | 127.74 | 34.5% |
| 20 | 08:30 | 127.74 | 37.9% |
| 21 | 09:00 | 124.53 | 37.0% |
| 22 | 09:30 | 122.03 | 32.8% |
| 23 | 10:00 | 119.96 | 28.9% |
| 24 | 10:30 | 118.18 | 31.2% |
| 25 | 11:00 | 115.61 | 37.1% |
| 26 | 11:30 | 114.03 | 36.9% |
| 27 | 12:00 | 112.09 | 37.5% |
| 28 | 12:30 | 112.00 | 37.9% |
| 29 | 13:00 | 112.00 | 38.3% |
| 30 | 13:30 | 110.00 | 41.9% |
| 31 | 14:00 | 110.00 | 40.7% |
| 32 | 14:30 | 107.69 | 42.9% |
| 33 | 15:00 | 106.54 | 43.6% |
| 34 | 15:30 | 106.54 | 43.8% |
| 35 | 16:00 | 119.00 | 40.0% |
| 36 | 16:30 | 124.00 | 35.4% |
| 37 | 17:00 | 144.39 | 33.6% |
| 38 | 17:30 | 149.75 | 32.2% |
| 39 | 18:00 | 160.03 | 27.8% |
| 40 | 18:30 | 161.00 | 25.3% |
| 41 | 19:00 | 170.97 | 22.1% |
| 42 | 19:30 | 174.29 | 17.8% |
| 43 | 20:00 | 169.18 | 16.5% |
| 44 | 20:30 | 169.41 | 16.1% |
| 45 | 21:00 | 169.87 | 14.8% |
| 46 | 21:30 | 170.23 | 16.7% |
| 47 | 22:00 | 165.07 | 16.2% |
| 48 | 22:30 | 165.07 | 15.7% |
Compare your business electricity and gas rates in minutes with INIS Energy Brokers.
Compare rates