I-SEM Daily Briefing — 2 June 2026
Table of Contents
Market Snapshot
| Metric | Value |
|---|---|
| Mean DAM Price | €160.47/MWh |
| Median Price | €163.17/MWh |
| Std Dev | €30.81/MWh |
| Peak Price | €225.0/MWh (07:30) |
| Min Price | €113.0/MWh (13:30) |
| Price Range | €112.0/MWh |
| Periods above €150 | 33 of 48 (69%) |
| Periods above €200 | 6 of 48 (12%) |
| Peak Avg (07–22) | €153.89/MWh |
| Off-peak Avg (22–07) | €171.43/MWh |
| Peak/Off-Peak Spread | €-17.54/MWh |
| Wind % of Demand | 31.4% |
| Wind Range | 14.3%–52.9% |
| Mean Demand | 3775 MW |
Price Profile #
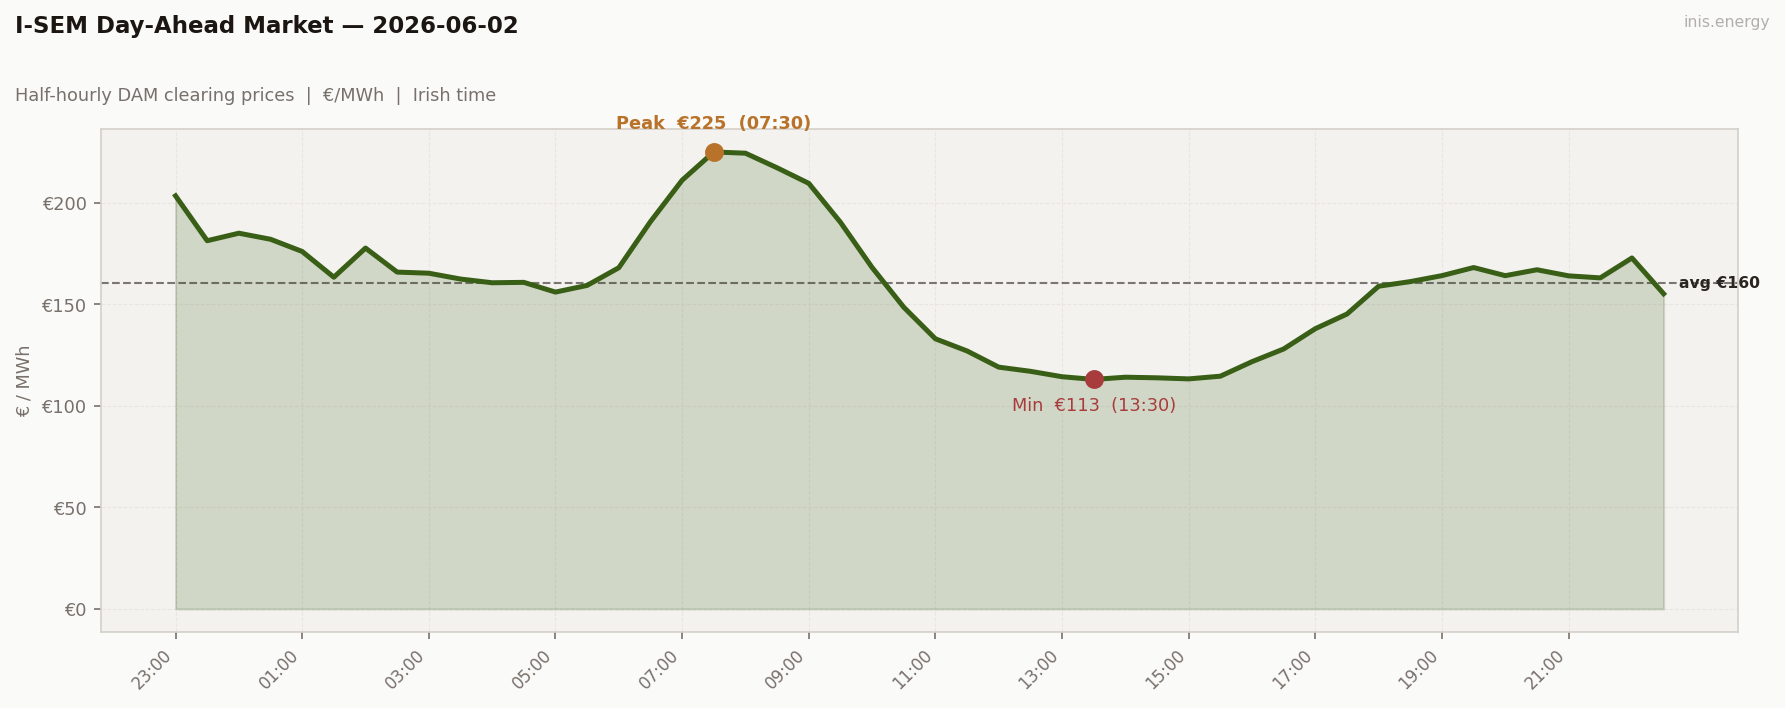
Std dev €30.81/MWh · Median €163.17/MWh · Periods above €150: 33 of 48 (69%)
The post-holiday Tuesday surge — and the second-highest daily mean of the entire 30-day run, after May 7’s €174. Mean €160.47, peak €225 at 07:30, 33 of 48 periods cleared above €150, and 6 above €200.
Periods 1–2 (€203, €181 at 23:00–23:30 with wind at 17–18%) are the start of the post-holiday scarcity event — and uniquely, the boundary spillover here works with the day rather than against it. June 1’s evening tail closed at €165 with wind at 16%. The €203 at 23:00 on June 2’s file is escalation, not spillover — the merit order had already climbed into peakers by the boundary and didn’t come back down until mid-morning.
The overnight floor never appeared. Prices ran €156–190 from 01:00 to 06:30 — the highest sustained overnight band of the run, with even the cheapest overnight half-hour (€156 at 05:00) above the previous run’s morning peaks. Wind held just 14–27% across overnight, demand was returning post-holiday, and gas at high load was the marginal plant continuously.
Morning ramp climbed €168 at 06:00 → €225 at 07:30: +€57 in 90 minutes. Five consecutive periods from 07:00 to 09:00 cleared above €200, averaging €217 across that block. By 10:30 prices had fallen to €148 — the first sub-€150 print in 12 hours.
Midday belly held €113–122 from 12:30 to 16:30 (the floor at €113.00 at 13:30) — a real deep trough that wind partially restored as it recovered to 39–53%. Evening rebuilt to €172 at 22:00 — a high finish that will partially spill into Wednesday’s file.
Price vs Wind #
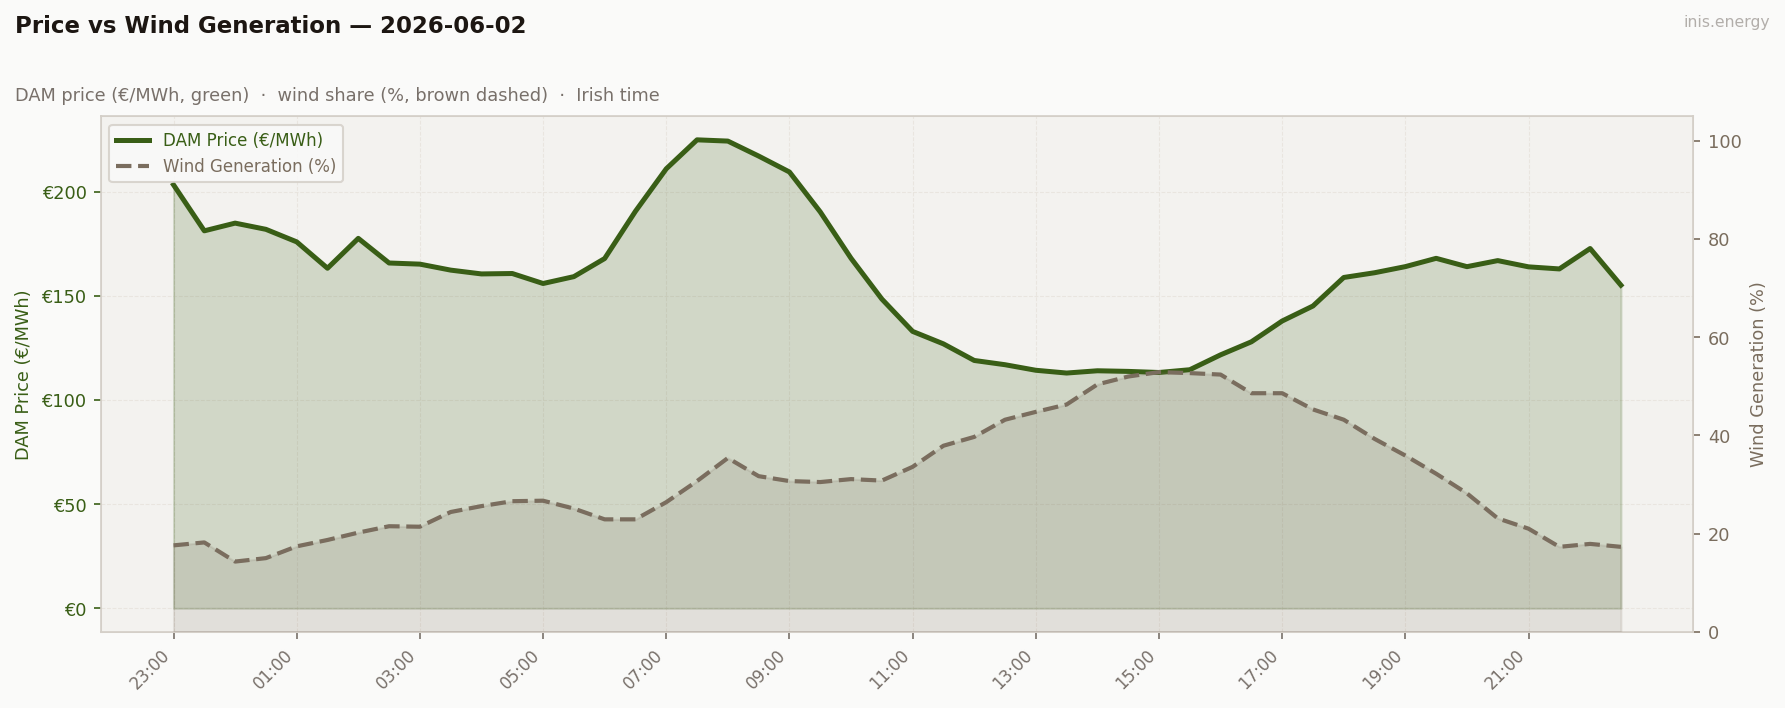
Mean wind: 31.4% · Range: 14.3%–52.9%
A contained V-into-morning-peak wind shape — but with a critical wrinkle. Wind started at 17–18% (boundary periods, low — consistent with June 1’s evening), dropped to 14.3% at 00:00 (the day’s minimum), held 17–26% across overnight, then actually recovered through the morning ramp: 22% at 06:30 → 31% at 07:30 → 35% at 08:00. Wind was climbing during the price ramp.
The cleanest read of “scarcity inertia” in the data so far. The merit order had already climbed into peakers during the overnight (wind 14–24% combined with returning demand). By the time wind began recovering in the morning, the marginal plant was already in peaker territory at €200+. Wind recovery from 22% to 35% during the ramp didn’t reverse the climb — once the merit order is in peakers, you stay there until demand falls, not until wind rises. The morning peak at €225 happened despite improving wind.
This is the structural counterpoint to May 18 (where wind was at 1% during the morning peak and produced €255) and May 29 (where wind drained from 35% to 14% during the evening peak and produced €203). On June 2 the wind shortfall was over by the time of the actual peak — but the merit order’s prior climb determined the day’s outcome. Scarcity has inertia. The half-hour with the lowest wind matters; the half-hour just before it matters more.
The post-holiday demand return is the amplifier. Tuesday demand at 3,775 MW — almost full working-day level — meeting an overnight wind shortfall that hadn’t cleared by the demand surge. Compare to May 26 (Tuesday post-bank-holiday, 6.6% wind, 3,789 MW demand, €212 morning peak): June 2 had higher mean wind (31% vs 6.6%) but the overnight tightness combined with returning demand produced a higher peak (€225 vs €212).
Week in Context #
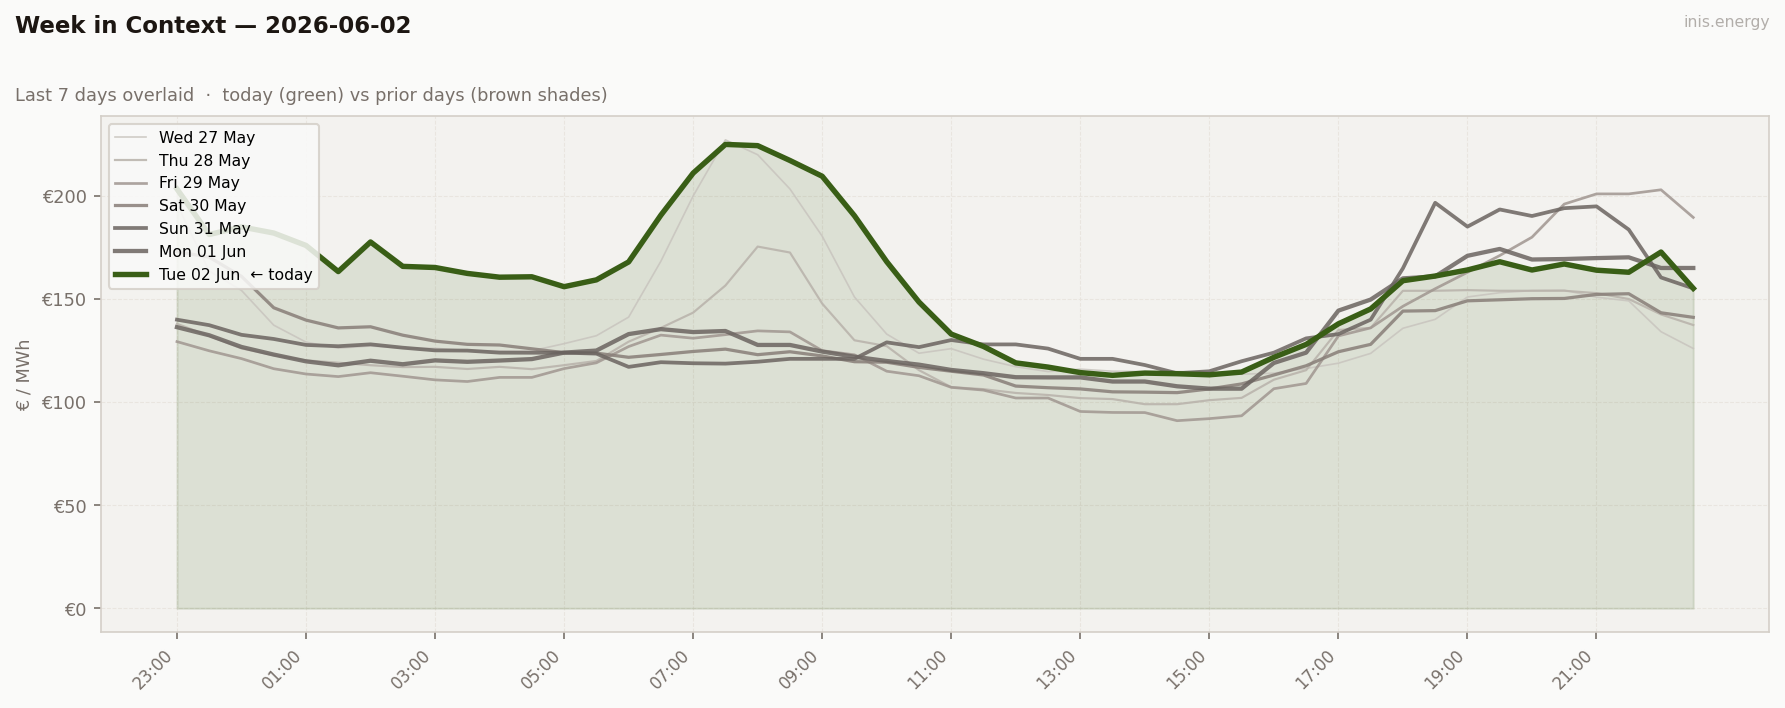
The post-holiday Tuesday surge re-emerges. Of three post-bank-holiday Tuesdays in the run, two have shown major mean-price surges (May 5 +€21 vs May 4; June 2 +€28 vs June 1). The third (May 26) was lost inside the wind drought. The bank-holiday-then-working-day transition is a structural pricing event worth flagging in the calendar.
Price Duration Curve #
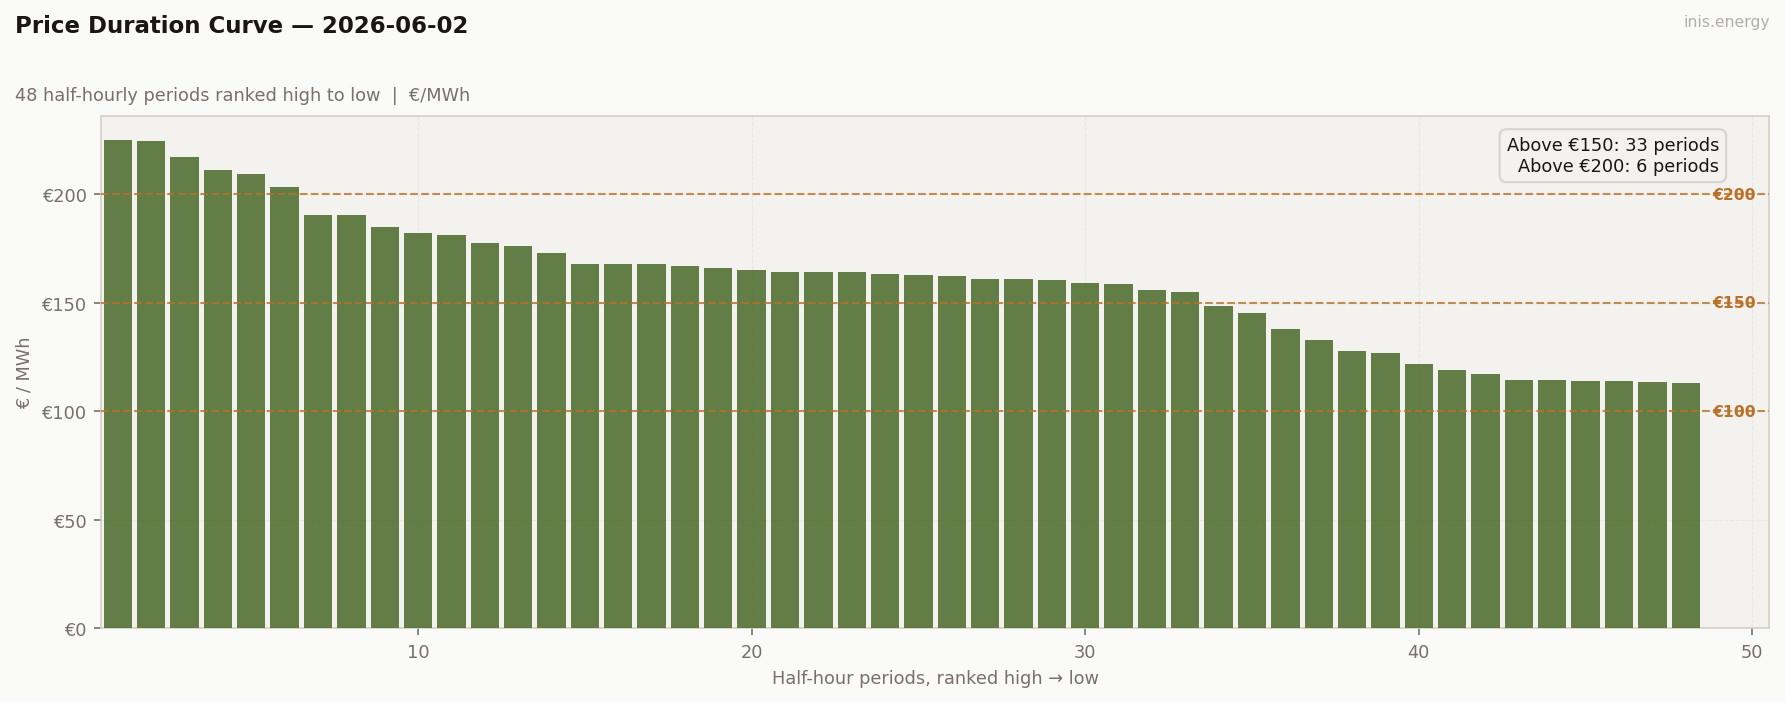
Periods above €150: 33 (69% of day) · Above €200: 6 (12% of day)
The curve has the unusual shape of an “elevated belly with two scarcity events” — the top 6 periods cluster around €203–225 (the morning peak plus the boundary), the next 25 periods sit in the €156–195 band (the overnight floor that wasn’t a floor), and the cheapest 17 periods cluster at €113–148 (the midday belly).
This is the “high-floor with morning spike” archetype — markedly different from May 18’s “broad scarcity plateau” or May 7’s “high-and-flat.” Today’s PDC is what you get when overnight is gas-marginal at high load and the morning produces real peaker bids on top. 33 periods above €150 is the second-highest count of the run after May 7 (33 also), but the shape is different — May 7 was high-and-flat at €169 median, June 2 is high-volatility around €163 median with a real scarcity spike.
Peak / Off-Peak Spread #
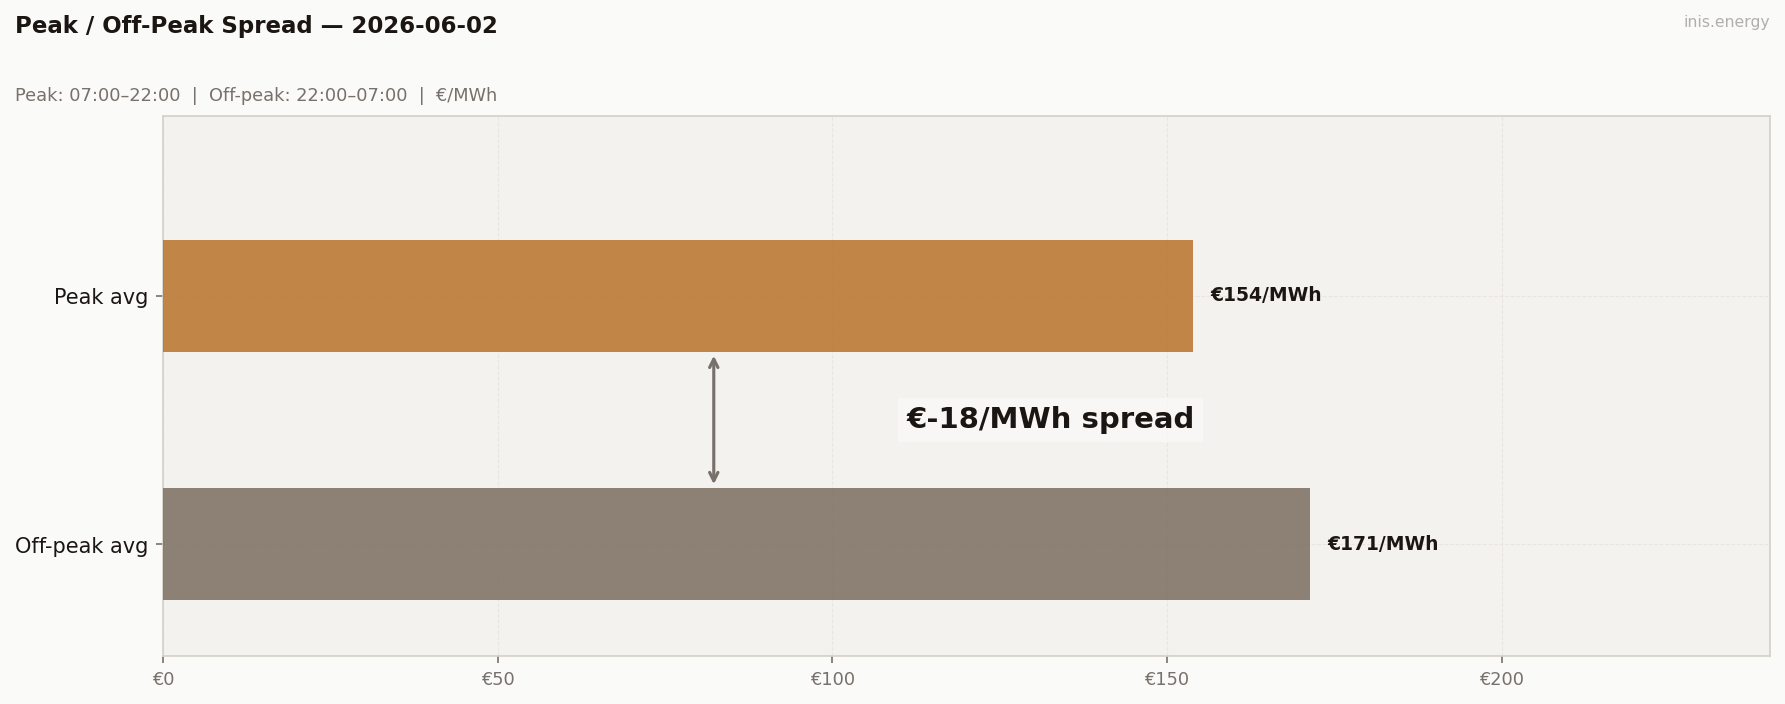
Spread −€17.54 — the most negative of the run, beating May 30’s −€13.59. Peak avg €153.89, off-peak avg €171.43.
The off-peak window (22:00–07:00) catches the boundary scarcity (€203 → €176) plus the elevated overnight floor (€156–190) — averaging €171. The peak window (07:00–22:00) catches the morning scarcity (€225 → €209 across 5 periods, averaging €218) and the deep midday belly (€113–122 across 8 periods, averaging €117) — averaging €154.
The midday trough sits inside the peak window and pulls the peak average below the off-peak average, even though the day produced 6 scarcity prints during peak hours. The metric reports “off-peak is more expensive than peak” while the chart shows two of the highest morning-peak prints of the entire run.
This is now the fifth negative peak/off-peak day in 31 days (after May 7, May 14, May 23, May 30). The rule of thumb solidifies: a negative peak/off-peak metric in I-SEM signals the metric has failed, not that the market is inverted. The captured spread (€106) is over 6× the absolute value of the headline.
Peak avg (07:00–22:00): €153.89/MWh · Off-peak avg: €171.43/MWh · Spread: €-17.54/MWh
BESS Dispatch Signal #
| Price | Time | Energy | Value | |
|---|---|---|---|---|
| Charge | €114/MWh | 13:30 | 2 MWh | −€227 |
| Discharge | €167/MWh | 20:30 | 1.7 MWh (85% RTE) | +€283 |
| Gross profit | €56 | |||
| Price spread | €53/MWh | ROI: 24.8% |
Simulated 1MW/2MWh battery, one optimal DAM cycle. Gross before network charges and capacity costs.
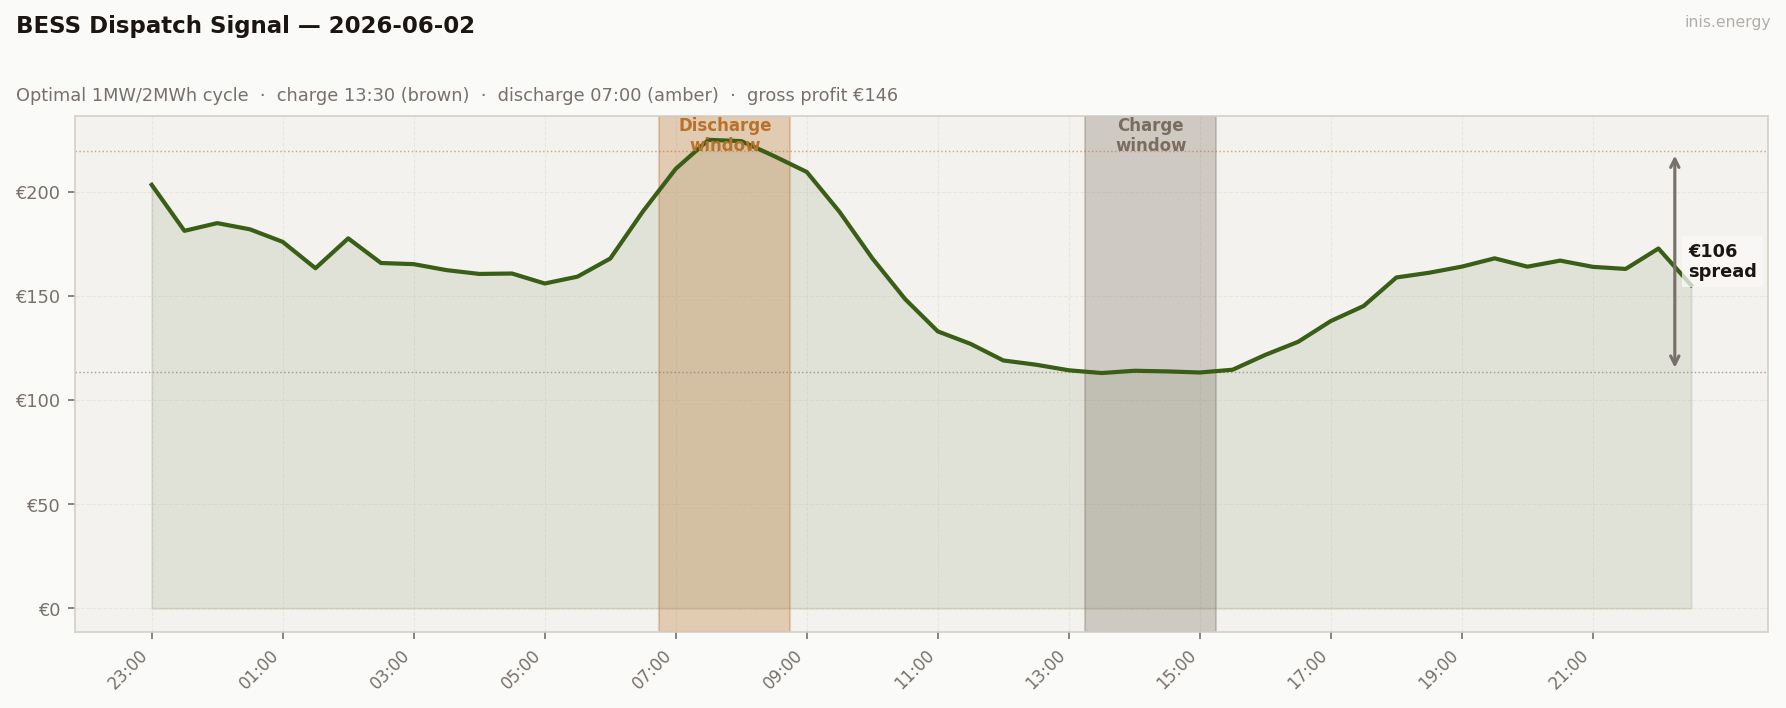
€56 gross on a €53 captured spread. Charge €114 in the midday belly (13:30–15:00 at €113.5 avg), discharge €167 in the evening peak (20:30–22:00 at €167 avg). ROI 24.8% on the €227 charge cost — a modest trade; the midday trough was shallow and the evening peak, while the day’s highest reachable window after charging, didn’t offer much spread to capture.
Commentary #
The post-holiday Tuesday surge — and the second-highest daily mean of the 31-day run at €160.47. Tuesday demand returned after the bank holiday (3,775 MW, +220 MW versus Monday), and met an overnight that had never cleared into gas-marginal-low-load territory: 14–18% wind across the boundary period and into the early hours, with prices anchored €156–190 across the entire overnight window. The morning ramp then climbed into peakers and produced 5 consecutive periods averaging €217, topping at €225 at 07:30.
The structural read is scarcity inertia. Wind was actually recovering during the morning ramp (22% → 35% from 06:30 to 08:00) — yet prices climbed regardless. Once the merit order had climbed into peakers during the overnight (when both wind was lowest and demand was returning), the marginal plant remained in peaker territory through the demand surge. Reversing a scarcity climb requires a fall in demand, not a rise in wind. The half-hour with the lowest wind matters; the half-hour just before the demand peak matters more. Compare to May 18: 1% wind during the morning peak produced €255; today’s 31% wind during the morning peak produced €225. Different wind levels at the peak hour, similar outcomes — because both days had insufficient overnight wind to clear the merit order out of peakers before demand surged.
The negative peak/off-peak spread (−€17.54) is now the run’s most negative reading. The pattern is consistent across five negative spreads in 31 days: the metric breaks on scarcity-spillover or wind-rich-weekend days where the cheap window isn’t where the metric assumes it is. A negative peak/off-peak metric should be read as a flag that the metric has failed, not as a signal about the market.
For storage, a modest day: €56 gross on a €53 captured spread, ROI 24.8%. The midday trough was shallow and the evening peak was the best window reachable after charging — not a standout trade, but a clean one.
Half-hourly data — 2026-06-02
| Period | Time | Price (€/MWh) | Wind % |
|---|---|---|---|
| 1 | 23:00 | 203.40 | 17.6% |
| 2 | 23:30 | 181.30 | 18.2% |
| 3 | 00:00 | 185.00 | 14.3% |
| 4 | 00:30 | 182.02 | 15.0% |
| 5 | 01:00 | 176.00 | 17.4% |
| 6 | 01:30 | 163.33 | 18.7% |
| 7 | 02:00 | 177.68 | 20.2% |
| 8 | 02:30 | 165.85 | 21.5% |
| 9 | 03:00 | 165.30 | 21.4% |
| 10 | 03:30 | 162.43 | 24.4% |
| 11 | 04:00 | 160.60 | 25.6% |
| 12 | 04:30 | 160.80 | 26.6% |
| 13 | 05:00 | 156.00 | 26.7% |
| 14 | 05:30 | 159.30 | 25.1% |
| 15 | 06:00 | 168.00 | 22.9% |
| 16 | 06:30 | 190.69 | 22.9% |
| 17 | 07:00 | 211.09 | 26.4% |
| 18 | 07:30 | 225.00 | 30.7% |
| 19 | 08:00 | 224.40 | 35.4% |
| 20 | 08:30 | 217.21 | 31.7% |
| 21 | 09:00 | 209.56 | 30.7% |
| 22 | 09:30 | 190.40 | 30.5% |
| 23 | 10:00 | 168.12 | 31.1% |
| 24 | 10:30 | 148.55 | 30.8% |
| 25 | 11:00 | 133.00 | 33.6% |
| 26 | 11:30 | 127.01 | 37.9% |
| 27 | 12:00 | 119.04 | 39.7% |
| 28 | 12:30 | 117.00 | 43.2% |
| 29 | 13:00 | 114.33 | 44.8% |
| 30 | 13:30 | 113.00 | 46.3% |
| 31 | 14:00 | 114.09 | 50.4% |
| 32 | 14:30 | 113.79 | 52.0% |
| 33 | 15:00 | 113.26 | 52.9% |
| 34 | 15:30 | 114.59 | 52.7% |
| 35 | 16:00 | 121.74 | 52.4% |
| 36 | 16:30 | 128.00 | 48.6% |
| 37 | 17:00 | 137.99 | 48.6% |
| 38 | 17:30 | 145.20 | 45.3% |
| 39 | 18:00 | 158.90 | 43.2% |
| 40 | 18:30 | 161.17 | 39.3% |
| 41 | 19:00 | 164.11 | 35.9% |
| 42 | 19:30 | 168.09 | 32.2% |
| 43 | 20:00 | 164.09 | 28.2% |
| 44 | 20:30 | 167.00 | 23.1% |
| 45 | 21:00 | 164.00 | 21.0% |
| 46 | 21:30 | 163.00 | 17.3% |
| 47 | 22:00 | 172.80 | 17.9% |
| 48 | 22:30 | 155.19 | 17.3% |
Compare your business electricity and gas rates in minutes with INIS Energy Brokers.
Compare rates