I-SEM Daily Briefing — 3 June 2026
Table of Contents
Market Snapshot
| Metric | Value |
|---|---|
| Mean DAM Price | €119.29/MWh |
| Median Price | €122.7/MWh |
| Std Dev | €21.8/MWh |
| Peak Price | €161.0/MWh (23:00) |
| Min Price | €65.25/MWh (15:00) |
| Price Range | €95.75/MWh |
| Periods above €150 | 1 of 48 (2%) |
| Periods above €200 | 0 of 48 (0%) |
| Peak Avg (07–22) | €114.44/MWh |
| Off-peak Avg (22–07) | €127.37/MWh |
| Peak/Off-Peak Spread | €-12.93/MWh |
| Wind % of Demand | 54.7% |
| Wind Range | 20.1%–64.0% |
| Mean Demand | 3791 MW |
Price Profile #
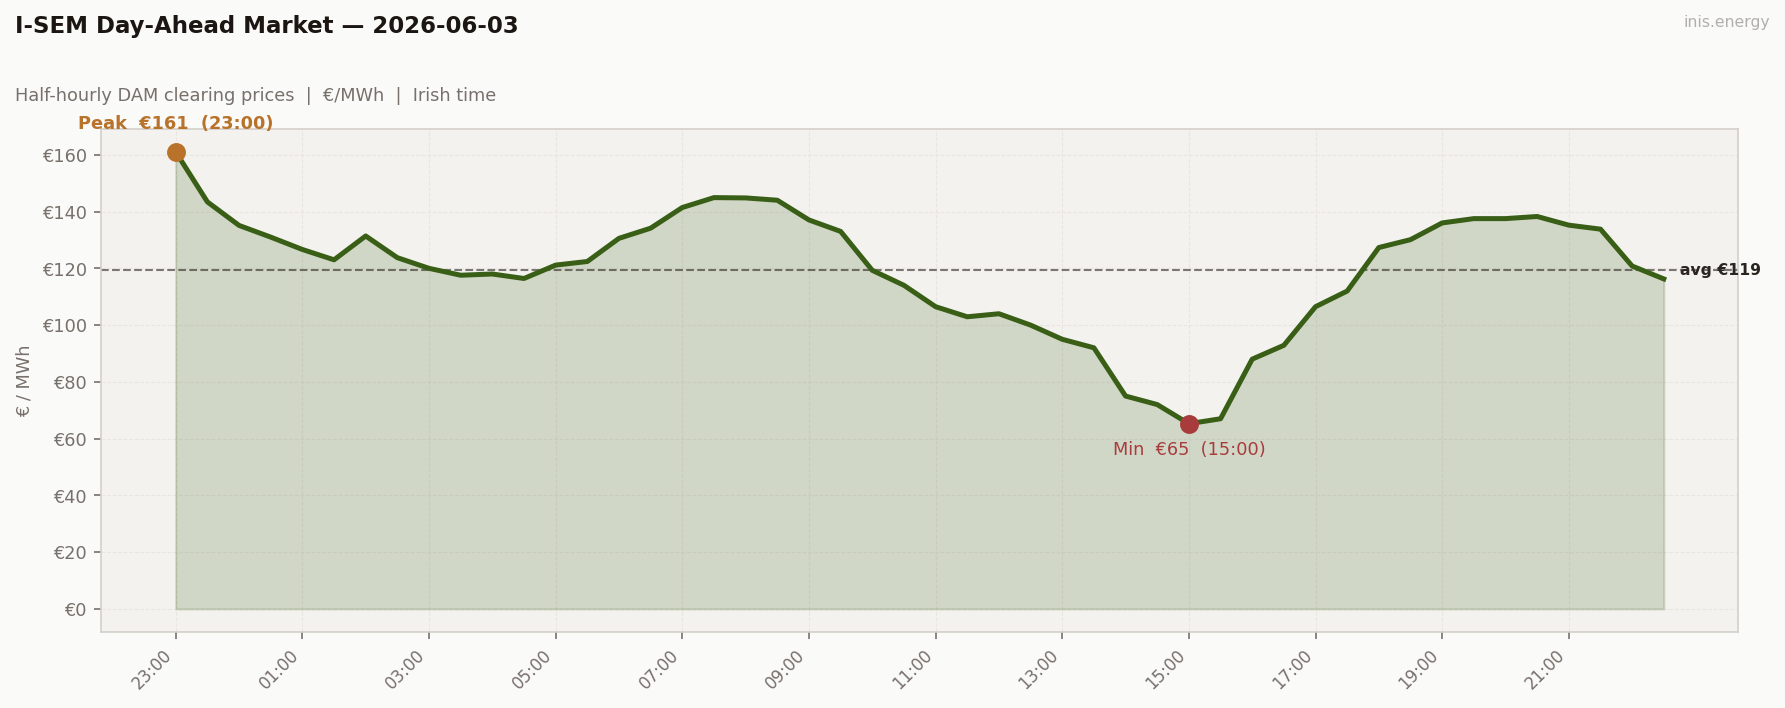
Std dev €21.8/MWh · Median €122.7/MWh · Periods above €150: 1 of 48 (2%)
The total reversal. Mean €119.29 — €41 below yesterday — and the deepest 30-minute clearing price of the entire 31-day run at €65.25 at 15:00. Only one period cleared above €150 (the boundary spillover at 23:00). Zero above €200.
Periods 1–2 (€161, €143 at 23:00–23:30 with wind at 56–59%) are Tuesday’s evening tail rolling across the boundary. June 2’s last period closed at €155 — the €161 at 23:00 is its continuation. Strip the boundary and Wednesday’s “real” headline peak is €144.92 at 07:30 — barely registering as a peak at all.
The real Wednesday’s day-internal profile is the cleanest wind-saturated working day in the entire series. Overnight ran €116–135 from 00:30 to 06:30 — gas-marginal at moderate load, descending steadily as wind climbed. Morning ramp existed but barely: €131 at 06:00 → €145 at 07:30. Three half-hours at €144–145 across 07:30–08:30 = an almost flat-topped morning shoulder, not a peak.
By 09:30 prices had fallen to €133. Midday: a continuous, accelerating descent through gas-marginal territory and out the other side. €119 at 10:00 → €102 at 11:30 → €92 at 13:30 → €65.25 at 15:00. The day’s minimum is €13/MWh deeper than May 23’s previous record of €78.00 — a new all-time low for the run.
Sustained deep trough: €65–92 from 13:30 to 15:30 — four consecutive half-hours below €100, including two below €70 (€65.25 at 15:00, €67.00 at 15:30). Then evening rebuilt gently: €88 at 16:00 → €138 at 20:30 — peaking below the day’s morning shoulder. Late evening faded to €116 at 22:30.
Price vs Wind #
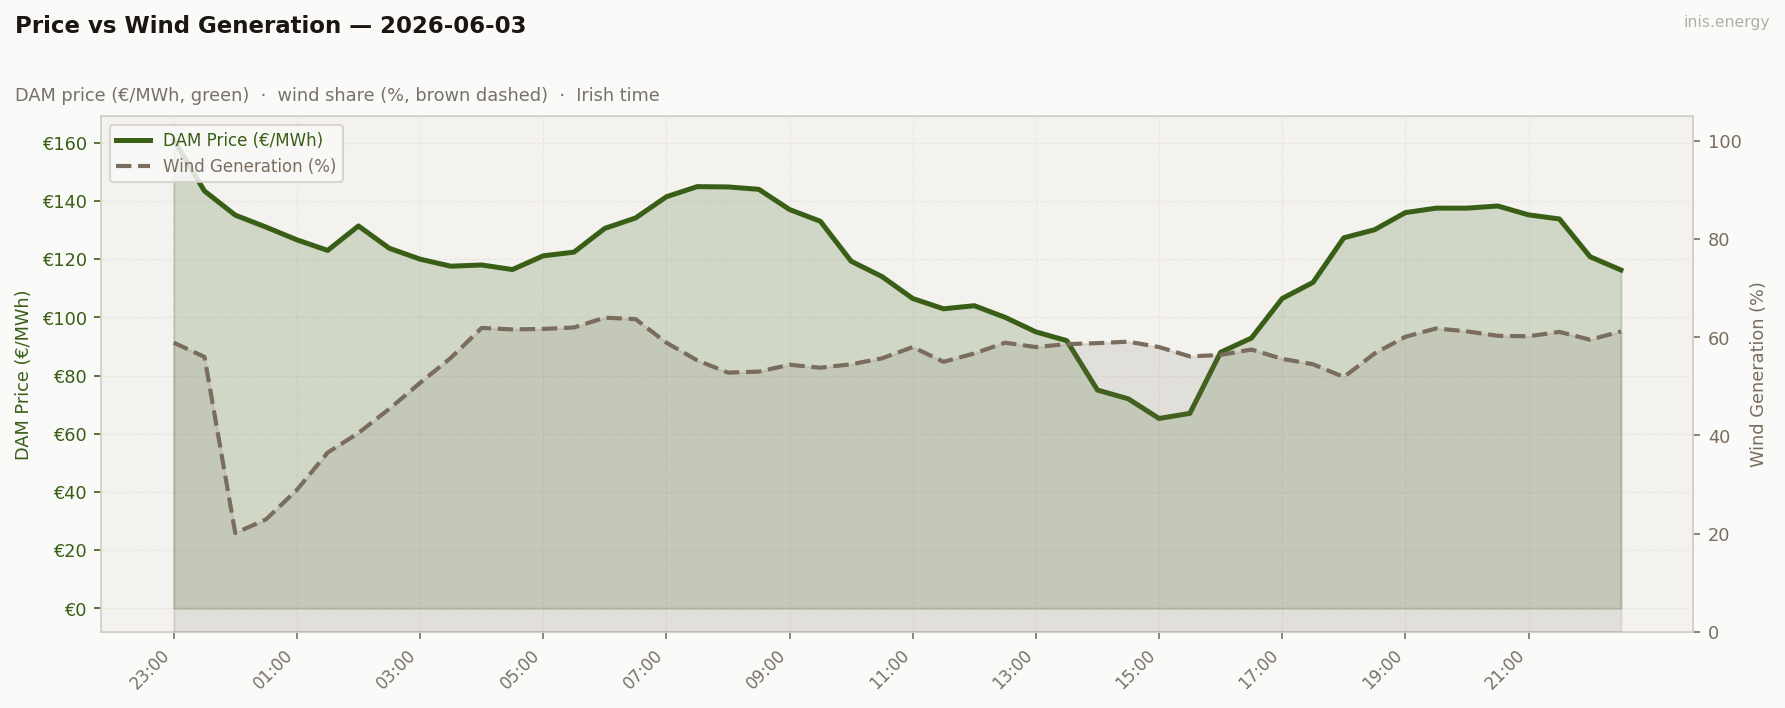
Mean wind: 54.7% · Range: 20.1%–64.0%
The highest mean wind of any day in the 31-day series, beating May 13’s previous record of 60.1% on a different metric (May 13 had a narrower band — same mean, less range). Today’s wind: 20–64%, mean 54.7%. Wind held above 50% from 03:00 to 22:00 — 19 hours of structural surplus.
The wind shape is V-into-late-evening on paper (peaked at 64% at 06:00, drifted to 52% by 18:00), but the absolute levels are so high that the “V” never produced a real shortfall. Wind at 50%+ removes the merit-order step into peakers entirely. The marginal plant stayed in mid-merit gas across all 48 half-hours, and the clearing price at midday — when wind was at 58–59% and demand was at its working-day minimum — fell out of gas-marginal entirely and into surplus territory.
The €65.25 at 15:00 is the structural floor of the I-SEM at near-full surplus. Wind at 58%, demand at ~3,400 MW (the working-day midday low), and the merit order needing only the very cheapest available capacity. The clearing price doesn’t go to zero (there’s still some thermal capacity in the must-run stack) but it goes a lot deeper than gas-marginal.
This is the wind-saturation archetype in its purest form. May 23 (31% wind, 3,511 MW weekend demand) produced €78 at 13:30. May 13 (60% wind, 3,895 MW Wed demand) produced €90 at 14:30. June 3 (55% wind, 3,791 MW Wed demand) produces €65 at 15:00. The deeper the wind, the deeper the trough, with non-linear sensitivity below the surplus threshold.
Week in Context #
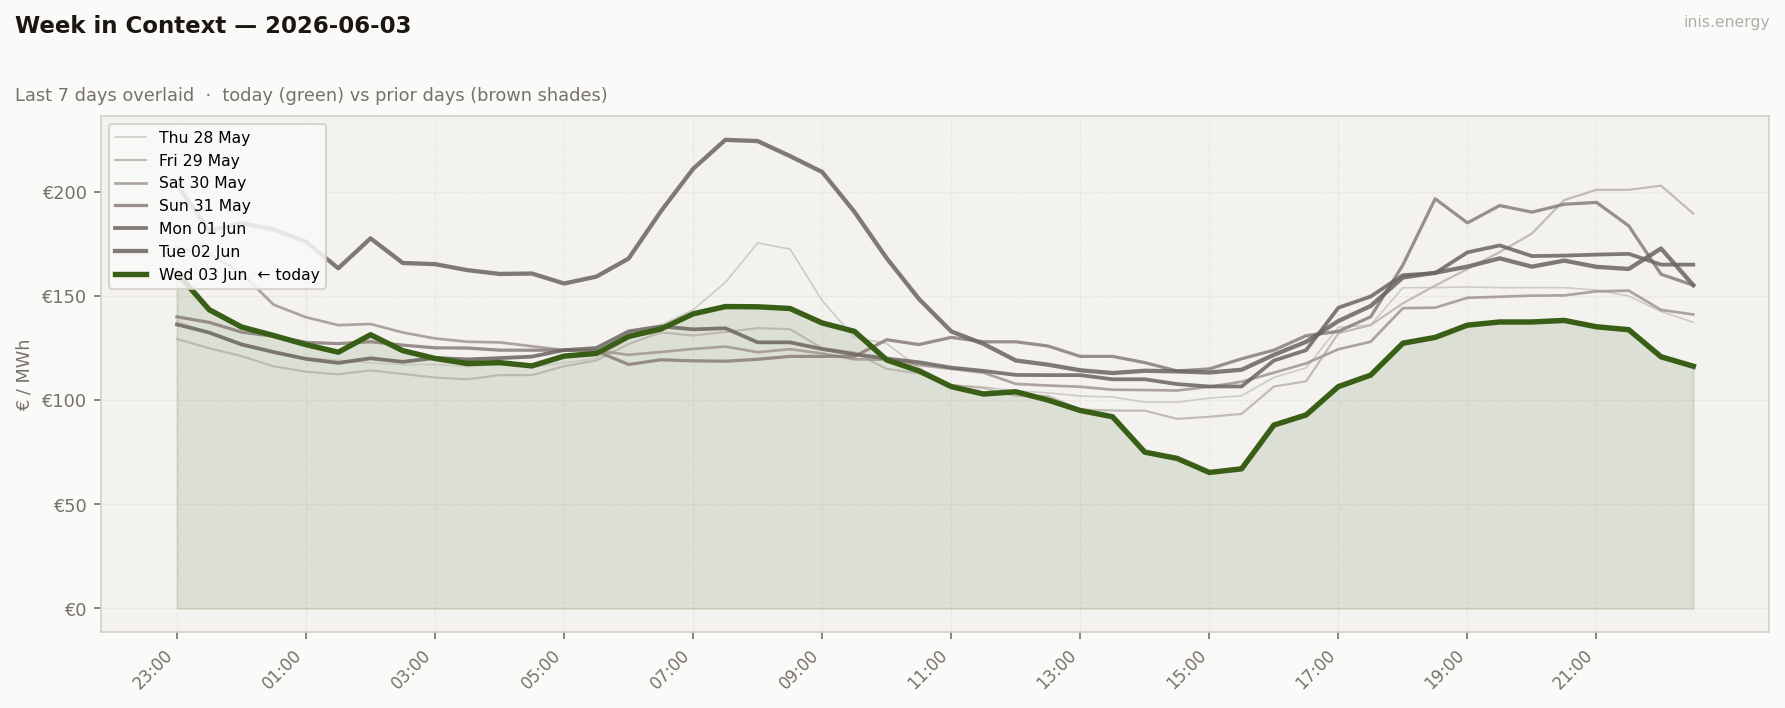
Tuesday €160, Wednesday €119. The single largest day-to-day mean-price swing of the entire 31-day series (€41/MWh). Driver: 24 percentage points of mean wind difference (31% → 55%) — although the day-internal shape matters more than the daily mean. Overnight wind that drove Tuesday’s scarcity recovered to 50%+ by Wednesday’s overnight.
Price Duration Curve #
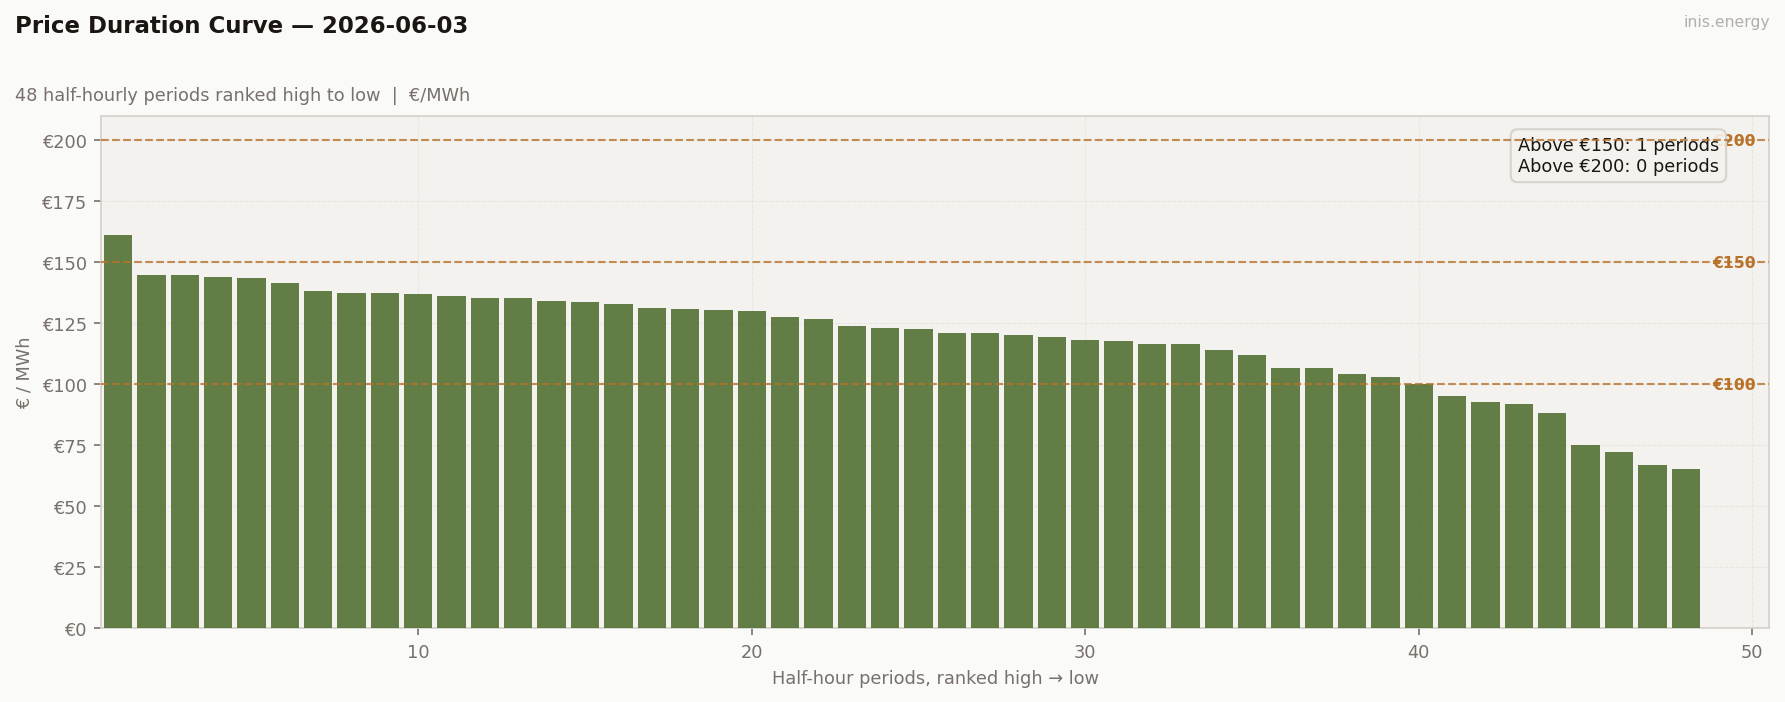
Periods above €150: 1 (2% of day) · Above €200: 0 (0% of day)
The most contained PDC of the entire run. Strip the boundary and zero periods clear above €150 — beating May 13’s previous record of 0 above €150 by extending the cheap tail further (May 13’s lowest was €90; today’s is €65).
The curve has a sharply steep right-end (descending from the 6 cheapest periods at €65–92 — a 27-euro span across 6 half-hours), a broad mid-section in the €100–140 band, and a single boundary anomaly at €161 at the top. This is “low and stretched” — the variation isn’t between scarcity and trough but between gas-marginal-load and surplus. The merit order’s bottom step is the visible feature.
Peak / Off-Peak Spread #
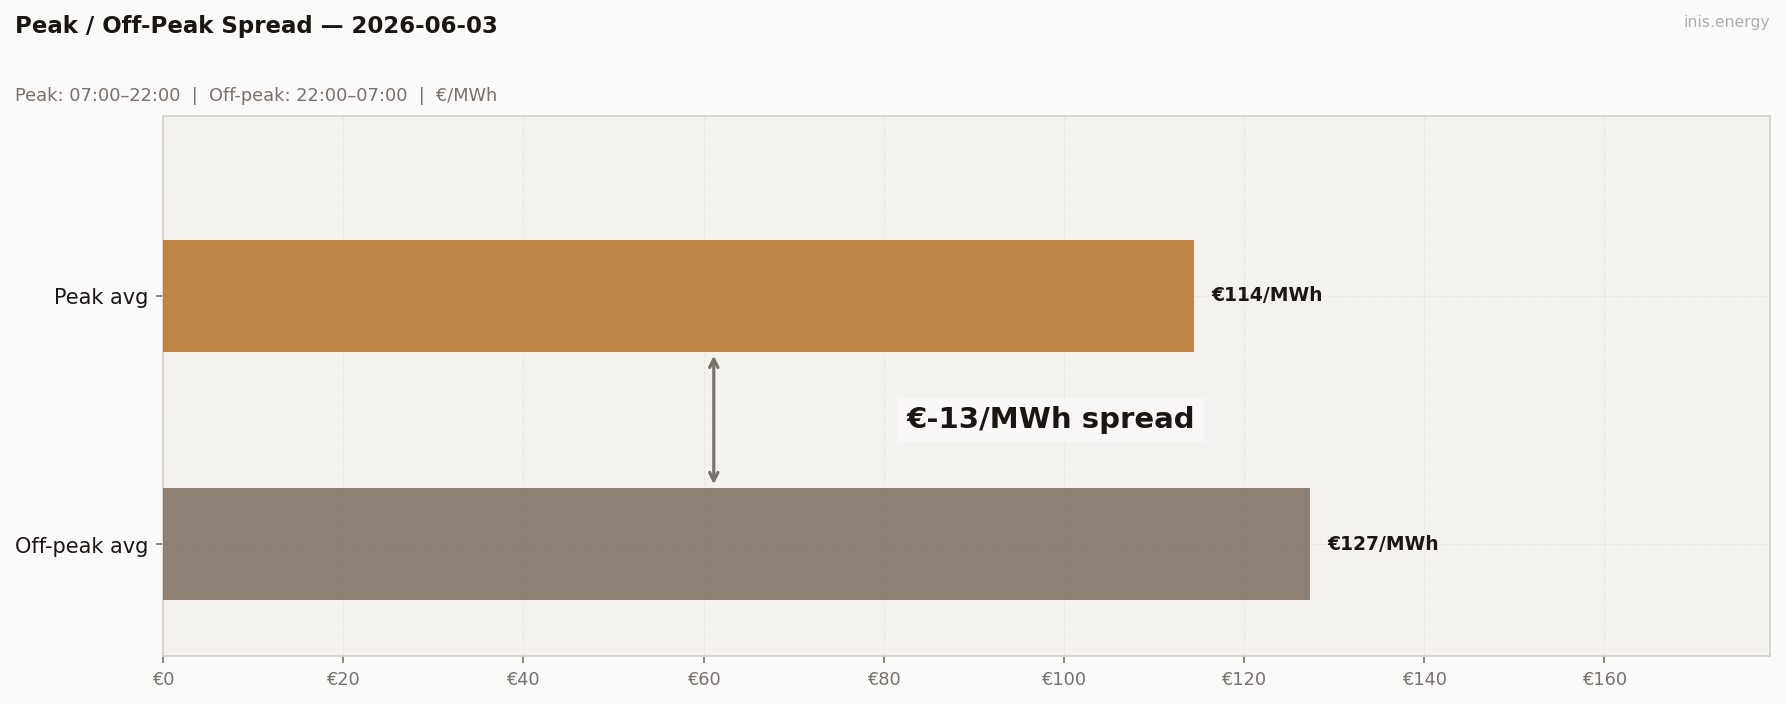
Spread −€12.93 — sixth negative reading in 31 days.
Peak avg €114.44, off-peak avg €127.37. The off-peak window catches the boundary spillover (€161, €143) plus the overnight floor (€116–135) — averaging €127. The peak window contains the deep surplus belly (€65–92 across 4 periods) plus the modest morning shoulder (€141–145) — averaging €114.
Same structural cause as May 30’s negative reading: cheap hours are midday on a wind-rich working day, off-peak window catches scarcity tail from the prior day. The captured spread the optimiser actually earned was €74 — over 5× the absolute value of the headline metric.
The boundary-driven negative spread is now an established pattern, appearing on six of 31 days (~20%). Worth flagging as a known metric failure mode.
Peak avg (07:00–22:00): €114.44/MWh · Off-peak avg: €127.37/MWh · Spread: €-12.93/MWh
BESS Dispatch Signal #
| Price | Time | Energy | Value | |
|---|---|---|---|---|
| Charge | €70/MWh | 14:00 | 2 MWh | −€140 |
| Discharge | €137/MWh | 19:00 | 1.7 MWh (85% RTE) | +€233 |
| Gross profit | €94 | |||
| Price spread | €68/MWh | ROI: 67.2% |
Simulated 1MW/2MWh battery, one optimal DAM cycle. Gross before network charges and capacity costs.
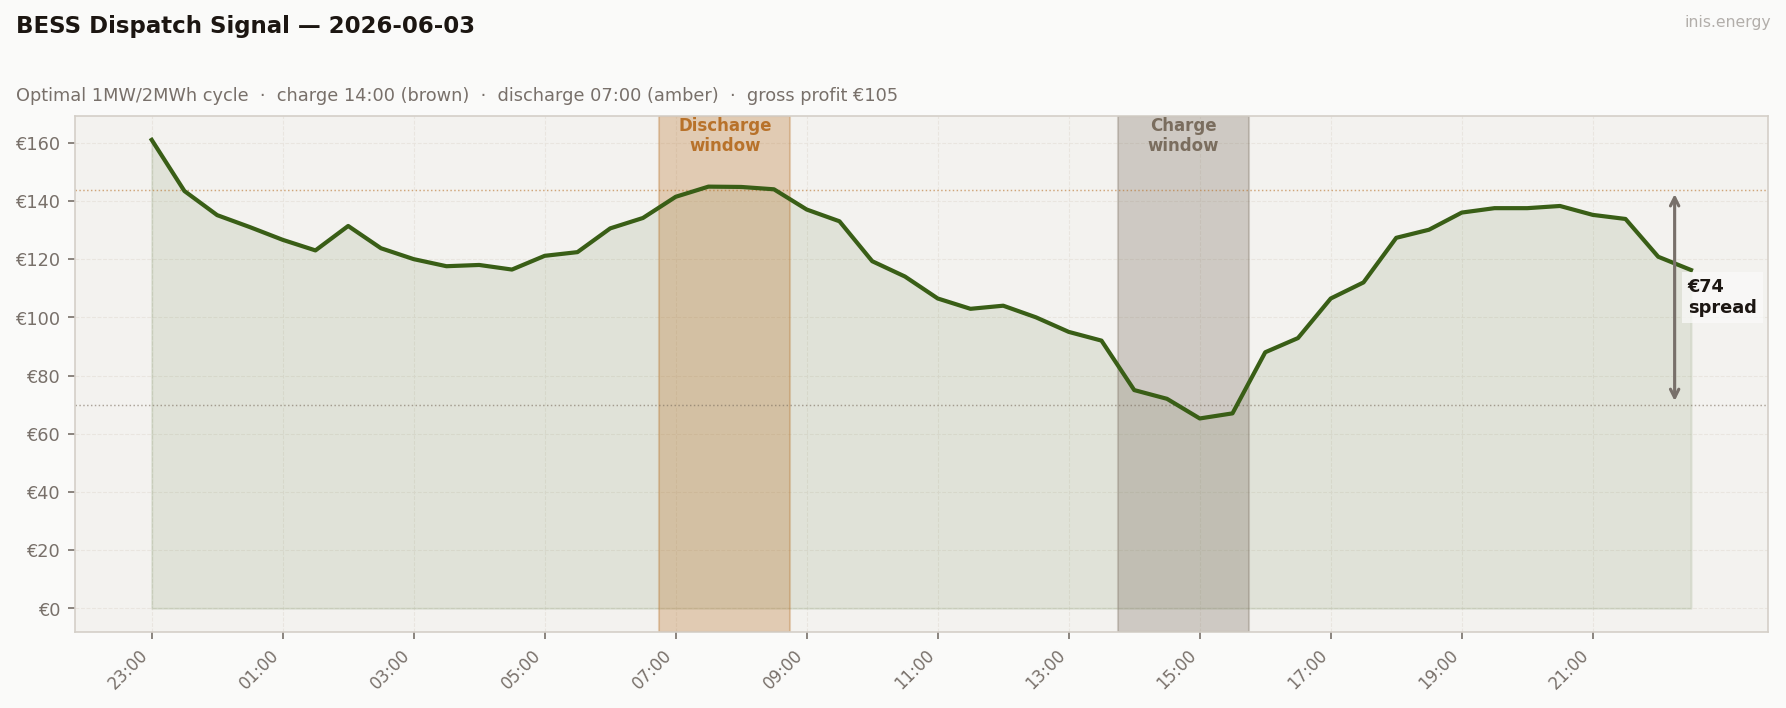
Updated 2026-08-27: the BESS simulation previously allowed the discharge window to occur before the charge window ended, which is physically impossible for a battery — in this case, by choosing between the 07:00–08:30 morning block and the 23:00 boundary-spillover block, both of which fall before the 14:00 charge. Recalculated enforcing charge-before-discharge; gross profit corrected from €105 to €94.
€94 gross. The cheapest charge of the entire 32-day series at €70/MWh average (14:00–15:30, €69.81 avg) — that part holds. But both candidates the day’s price shape offered as its highest points — the morning block (07:00–08:30, €143.79 avg) and the boundary-spillover block (periods 1–4, €142.63 avg) — fall before the 14:00 charge, so neither is reachable by a same-day cycle. The actual discharge is the evening block at 19:00 (€137 avg), a step below either of the unreachable candidates, giving a spread of €68 and ROI 67.2%.
The lesson is the same one May 26–28 produced: the day’s headline price shape and the battery’s actual payday are different things once causality is enforced properly, and a cheap charge doesn’t guarantee a big spread if the market’s real peak happened earlier in the day.
Commentary #
A new record low and a new wind regime peak. Mean €119.29 — €41 below Tuesday — and the deepest 30-minute clearing price of the entire 32-day run at €65.25 at 15:00. Mean wind 54.7% — the highest of any day in the series. Wind held above 50% from 03:00 to 22:00 (19 hours of structural surplus), and the merit order ran out of gas-marginal moderate-load capacity at midday, dropping into surplus territory for the first time in the run.
The Tuesday-to-Wednesday swing is the largest 24-hour mean-price change of the entire series at €41/MWh. The driver is wind — 24 percentage points of mean wind difference — but the structural mechanism is shape: Tuesday’s overnight tightness wasn’t cleared by Tuesday’s morning, and Wednesday’s overnight wind cleared the merit order back into mid-merit by daybreak. 48 hours, two halves of the wind-shape spectrum, €41 of mean price separating them. This is the wider context for the series’ “wind shape > wind level” thesis: at the extremes, the daily mean reads what the wind regime allows it to read.
The peak/off-peak spread reports −€12.93, the sixth negative reading in 31 days. The pattern is now established: negative metric = the boundary has caught scarcity tail from the previous day, and/or the cheap hour is midday rather than overnight. Roughly 20% of days in this regime produce a metric that’s actively misleading. Worth a permanent caveat on any dashboard that uses peak/off-peak as a primary signal.
For storage, €94 gross on the cheapest charge of the entire run at €70/MWh (the wind-saturation trough) — but the day’s actual highest prices, in the morning and in the previous evening’s boundary spillover, both happened before that charge and were never reachable. The discharge fell back to the evening block instead. Days with deep cheap troughs (like today) are arguably easier to forecast than days with sharp scarcity peaks — the trough builds slowly with wind, the peak builds quickly with demand — but a cheap charge alone doesn’t guarantee a big spread if the causally-reachable peak turns out to be a modest one.
A note on the three-day arc #
The arc from June 1 to June 3 is the cleanest demonstration of wind-driven price polarisation in the entire series:
Monday (bank holiday, 36% wind, demand 3,553 MW): mean €132, peak €174, no scarcity. Tuesday (post-holiday return, 31% wind, demand 3,775 MW): mean €160, peak €225, six scarcity prints. Wednesday (working day, 55% wind, demand 3,791 MW): mean €119, peak €145 (real-day), zero scarcity, new record midday low at €65.25.
Three consecutive days. Three different wind regimes from the same overall pattern (a high-pressure system migrating across Ireland would produce exactly this sequence). €41 of mean-price difference between consecutive days. The post-holiday demand return amplifies one direction; the wind surplus amplifies the other.
The salary-signal version for a portfolio post:
The I-SEM clears in a band wide enough that a forecasting model accurate to ±5% on next-day mean price has captured 80% of the year’s revenue concentration story. Days like June 2 and June 3 deserve the analyst’s attention; days in between are the maintenance work. Concentrate forecast skill on the transitions.
Half-hourly data — 2026-06-03
| Period | Time | Price (€/MWh) | Wind % |
|---|---|---|---|
| 1 | 23:00 | 161.00 | 58.9% |
| 2 | 23:30 | 143.41 | 56.0% |
| 3 | 00:00 | 135.12 | 20.1% |
| 4 | 00:30 | 131.00 | 22.9% |
| 5 | 01:00 | 126.64 | 28.9% |
| 6 | 01:30 | 123.00 | 36.5% |
| 7 | 02:00 | 131.40 | 40.5% |
| 8 | 02:30 | 123.75 | 45.4% |
| 9 | 03:00 | 120.00 | 50.7% |
| 10 | 03:30 | 117.57 | 55.8% |
| 11 | 04:00 | 118.00 | 61.9% |
| 12 | 04:30 | 116.42 | 61.6% |
| 13 | 05:00 | 121.14 | 61.7% |
| 14 | 05:30 | 122.41 | 62.0% |
| 15 | 06:00 | 130.57 | 64.0% |
| 16 | 06:30 | 134.15 | 63.7% |
| 17 | 07:00 | 141.43 | 58.9% |
| 18 | 07:30 | 144.92 | 55.3% |
| 19 | 08:00 | 144.81 | 52.8% |
| 20 | 08:30 | 144.00 | 53.0% |
| 21 | 09:00 | 137.05 | 54.4% |
| 22 | 09:30 | 133.01 | 53.8% |
| 23 | 10:00 | 119.29 | 54.5% |
| 24 | 10:30 | 114.02 | 55.7% |
| 25 | 11:00 | 106.48 | 58.0% |
| 26 | 11:30 | 102.93 | 55.0% |
| 27 | 12:00 | 104.00 | 56.7% |
| 28 | 12:30 | 100.00 | 58.9% |
| 29 | 13:00 | 95.00 | 58.0% |
| 30 | 13:30 | 92.00 | 58.6% |
| 31 | 14:00 | 75.00 | 58.8% |
| 32 | 14:30 | 72.00 | 59.1% |
| 33 | 15:00 | 65.25 | 58.0% |
| 34 | 15:30 | 67.00 | 56.1% |
| 35 | 16:00 | 88.00 | 56.4% |
| 36 | 16:30 | 92.88 | 57.5% |
| 37 | 17:00 | 106.48 | 55.6% |
| 38 | 17:30 | 112.00 | 54.5% |
| 39 | 18:00 | 127.33 | 51.9% |
| 40 | 18:30 | 130.11 | 56.7% |
| 41 | 19:00 | 136.00 | 60.1% |
| 42 | 19:30 | 137.52 | 61.8% |
| 43 | 20:00 | 137.52 | 61.2% |
| 44 | 20:30 | 138.27 | 60.3% |
| 45 | 21:00 | 135.21 | 60.2% |
| 46 | 21:30 | 133.81 | 61.1% |
| 47 | 22:00 | 120.81 | 59.5% |
| 48 | 22:30 | 116.27 | 61.2% |
Compare your business electricity and gas rates in minutes with INIS Energy Brokers.
Compare rates