I-SEM Daily Briefing — 4 June 2026
Table of Contents
Market Snapshot
| Metric | Value |
|---|---|
| Mean DAM Price | €82.3/MWh |
| Median Price | €74.83/MWh |
| Std Dev | €26.29/MWh |
| Peak Price | €125.79/MWh (20:30) |
| Min Price | €37.85/MWh (15:00) |
| Price Range | €87.94/MWh |
| Periods above €150 | 0 of 48 (0%) |
| Periods above €200 | 0 of 48 (0%) |
| Peak Avg (07–22) | €84.51/MWh |
| Off-peak Avg (22–07) | €78.61/MWh |
| Peak/Off-Peak Spread | €5.9/MWh |
| Wind % of Demand | 49.9% |
| Wind Range | 41.2%–59.8% |
| Mean Demand | 3730 MW |
Price Profile #
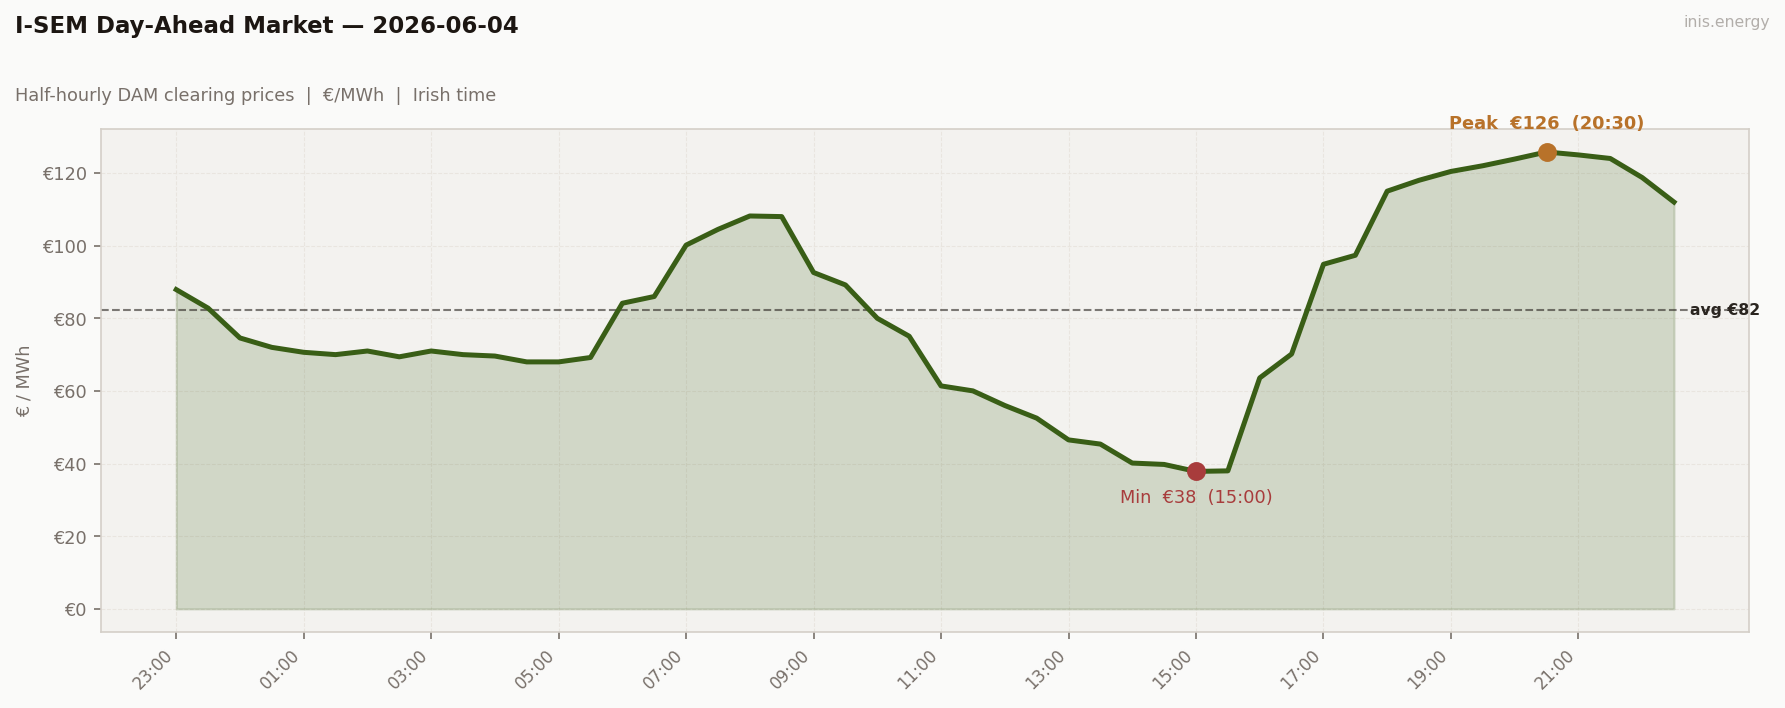
Std dev €26.29/MWh · Median €74.83/MWh · Periods above €150: 0 of 48 (0%)
The first day of the run where the I-SEM never cleared €150. Mean €82.30 — a new record low, €37 below the previous floor (May 13). Peak only €125.79 at 20:30 — barely above the working-week midday troughs of weeks ago.
The shape: a smooth descent from a contained morning bump (€100–108 from 07:00 to 08:30) into the deepest midday surplus the run has seen. €108 at 08:30 → €37.85 at 15:00. €70 of decline across 6.5 hours, all of it in wind-surplus territory.
Four half-hours below €50 from 14:00 to 15:30. Two below €40 (€39.77 at 14:30, €37.85 at 15:00). Then a gentle evening rebuild to €125 at 20:30 — a peak in name only.
Price vs Wind #
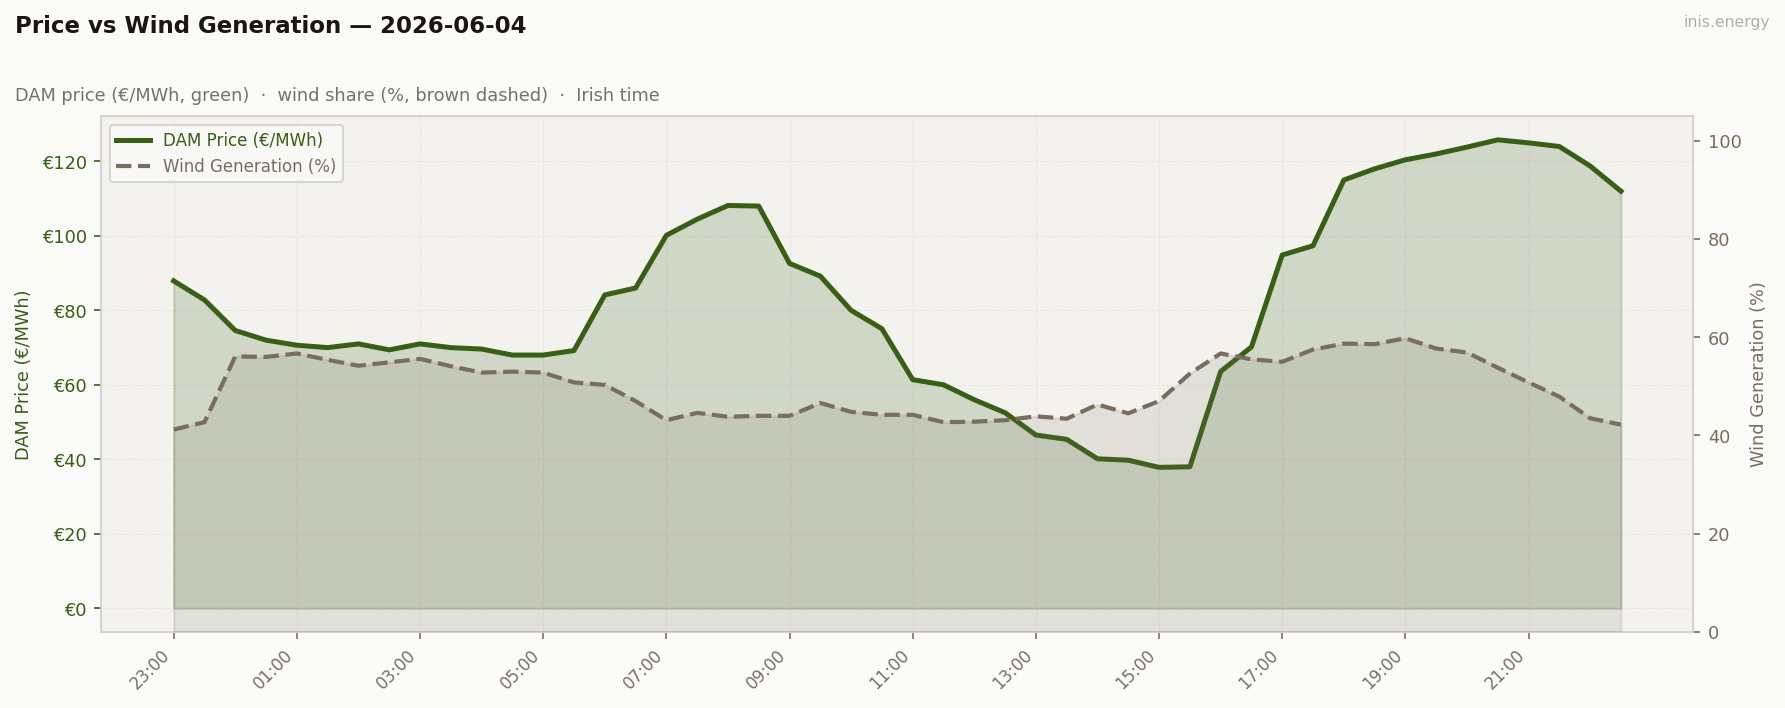
Mean wind: 49.9% · Range: 41.2%–59.8%
Wind held 50% all day with a 41–60% range — the steadiest wind day of the run. No real shortfall window, no real surplus spike, just sustained 50%+ from 23:00 the night before to 22:30 this evening.
What 50% wind does to gas: it removes it from the merit order at moderate-load conditions. The marginal plant at midday was the cheapest available unit on the system, not gas at any load point. €37.85 isn’t curtailment yet, but it’s close — another 3-4pp of wind and the marginal plant would be bidding negative.
Week in Context #
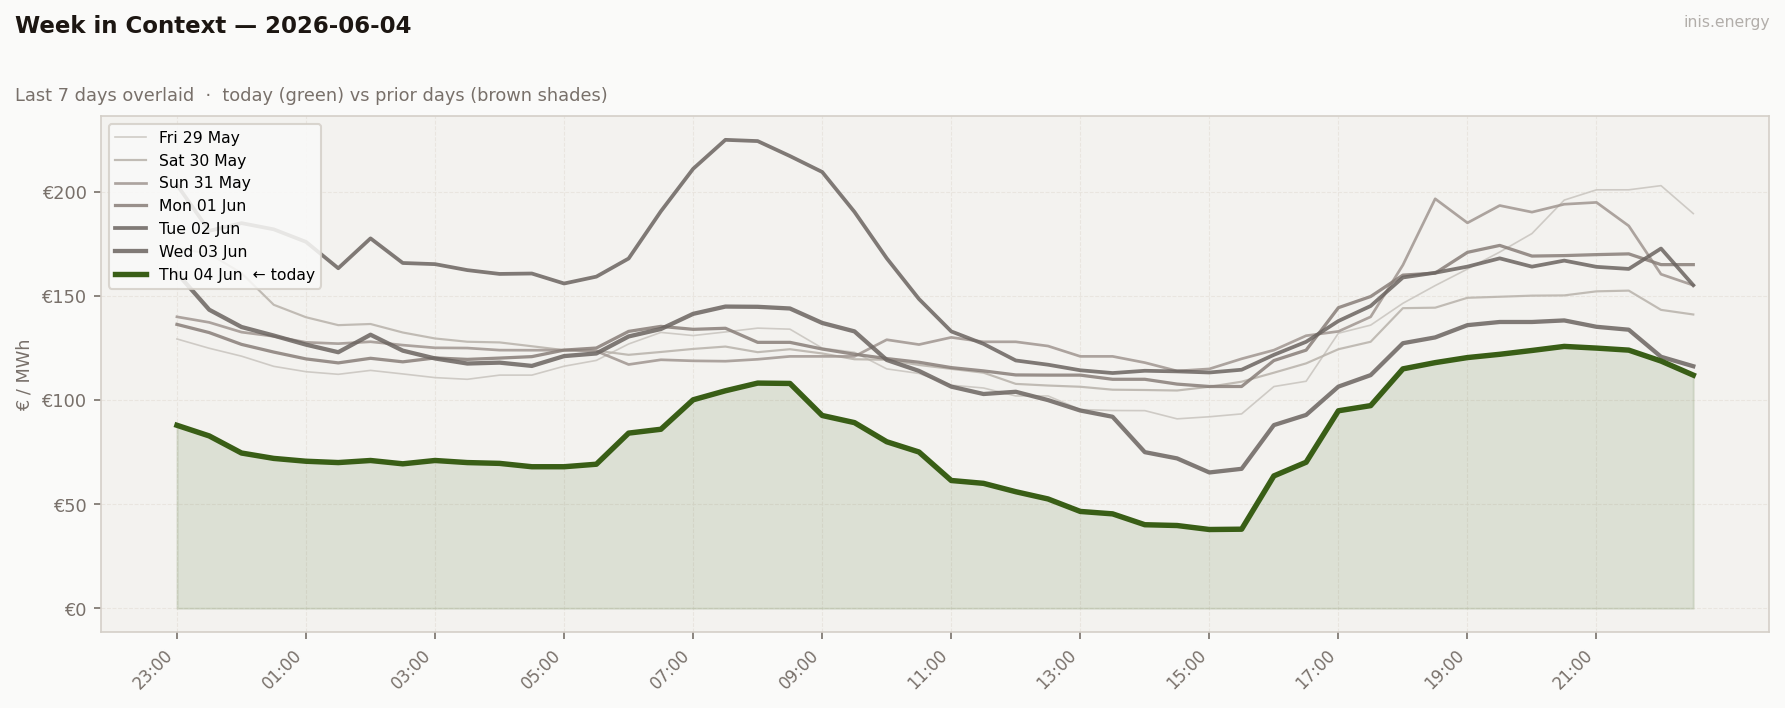
The Tuesday-Wednesday wind regime swing kept going. €160 mean Tue → €119 mean Wed → €82 mean Thu. Three days, €78/MWh of decline, all of it wind.
Price Duration Curve #
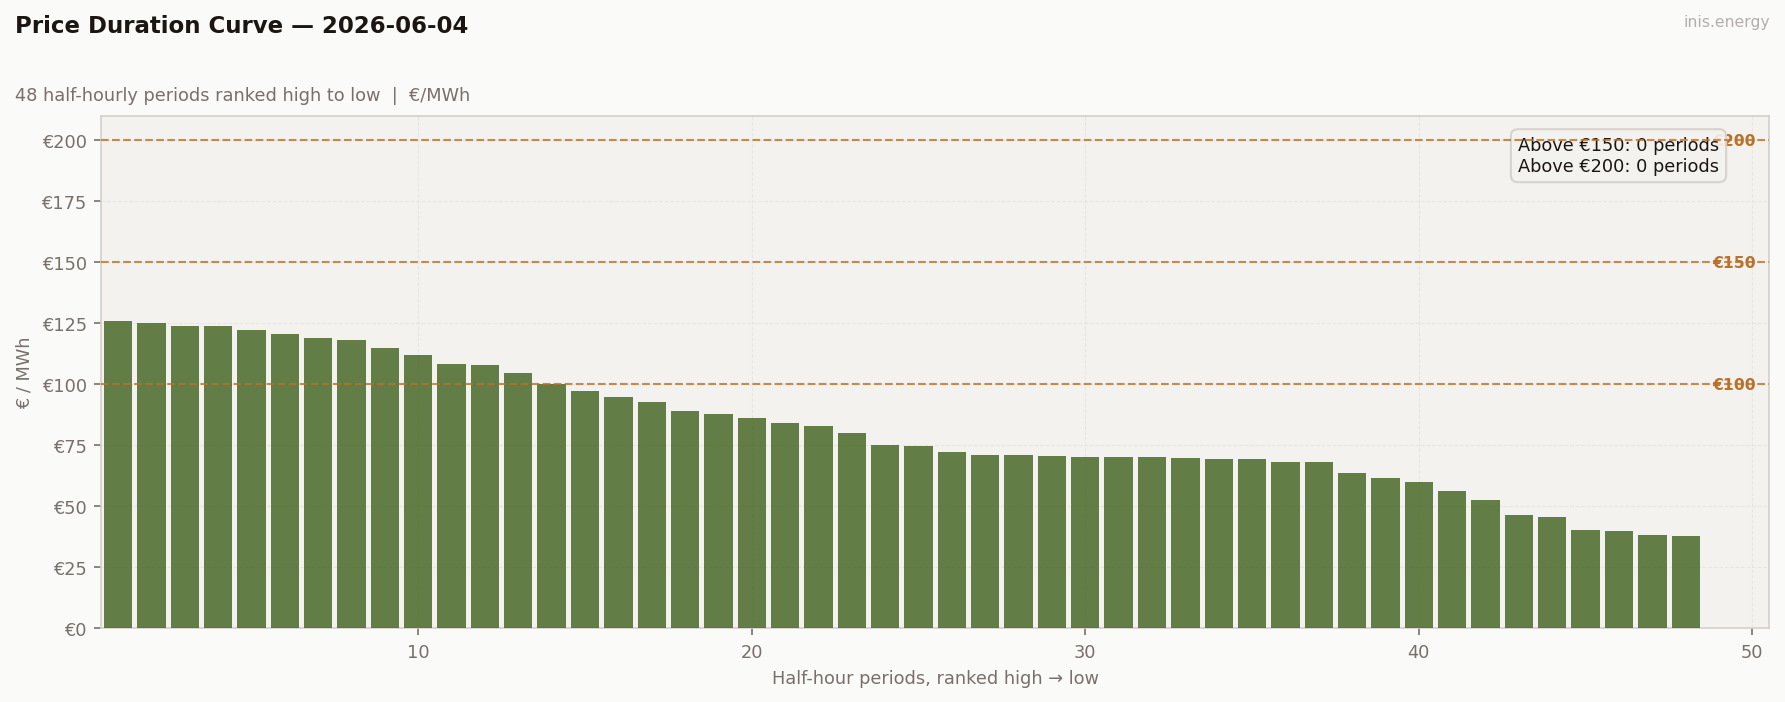
Periods above €150: 0 (0% of day) · Above €200: 0 (0% of day)
Zero above €150. Zero above €200. The first all-day-sub-€150 PDC of the run.
The shape is “low-and-stretched” — 6 periods below €50 at the cheap end, a broad mid-band around €70–110, and a soft top shoulder topping out at €126. A clean wind-saturation archetype.
Peak / Off-Peak Spread #
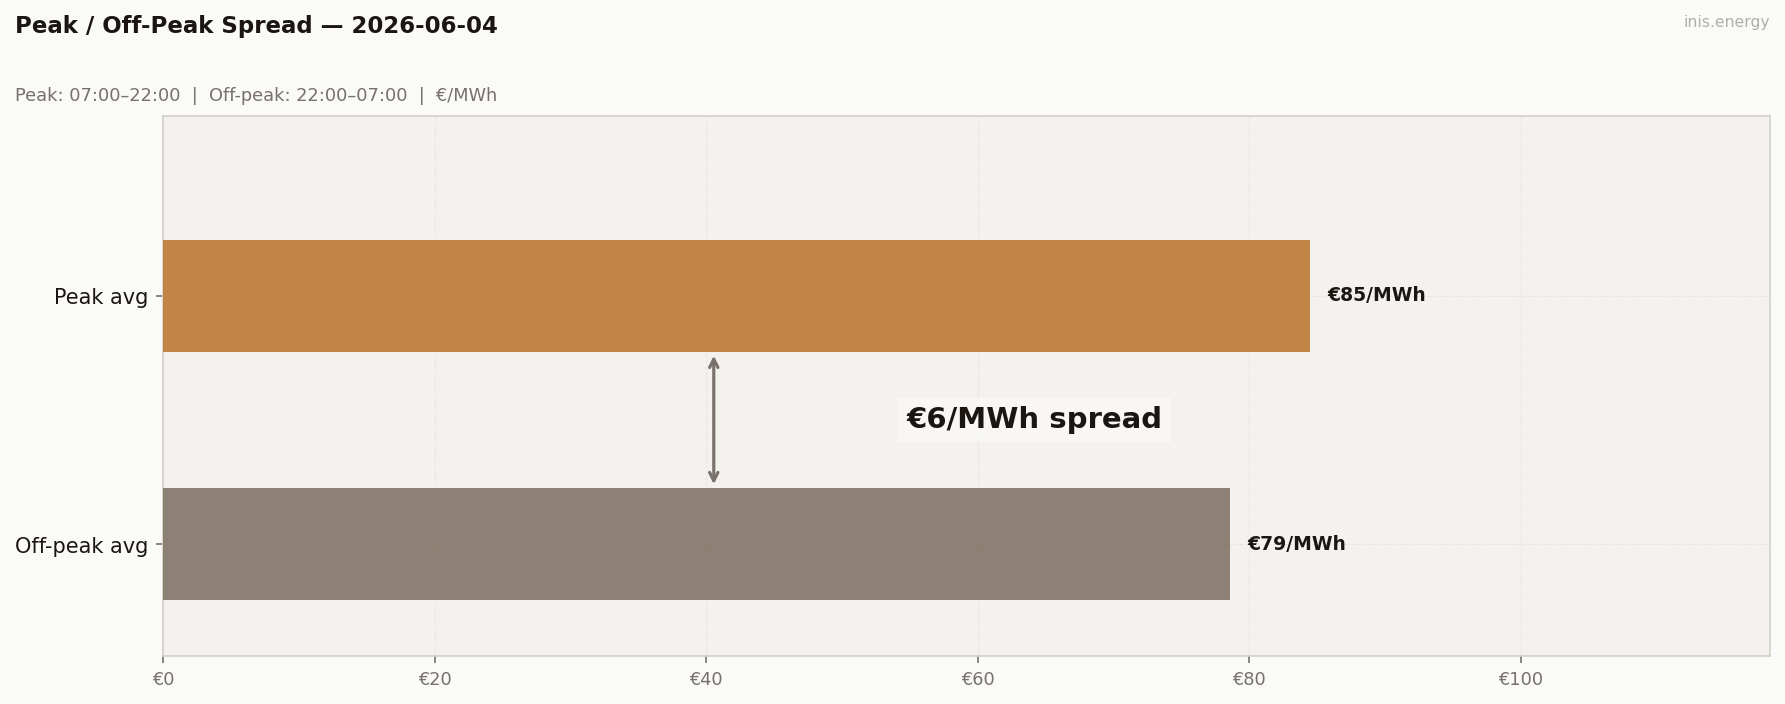
Peak avg (07:00–22:00): €84.51/MWh · Off-peak avg: €78.61/MWh · Spread: €5.9/MWh
€5.90. Honest territory — for once, no boundary spillover and no inverted shape. Peak avg €84.51, off-peak avg €78.61. The metric reports a modest positive spread on a flat-and-low day.
What’s interesting: the captured spread (€86) is over 14× the headline. On no-peak days the BESS still finds spread because the trough went so deep — the metric just doesn’t see it.
BESS Dispatch Signal #
| Price | Time | Energy | Value | |
|---|---|---|---|---|
| Charge | €39/MWh | 14:00 | 2 MWh | −€78 |
| Discharge | €125/MWh | 20:00 | 1.7 MWh (85% RTE) | +€212 |
| Gross profit | €134 | |||
| Price spread | €86/MWh | ROI: 172.1% |
Simulated 1MW/2MWh battery, one optimal DAM cycle. Gross before network charges and capacity costs.
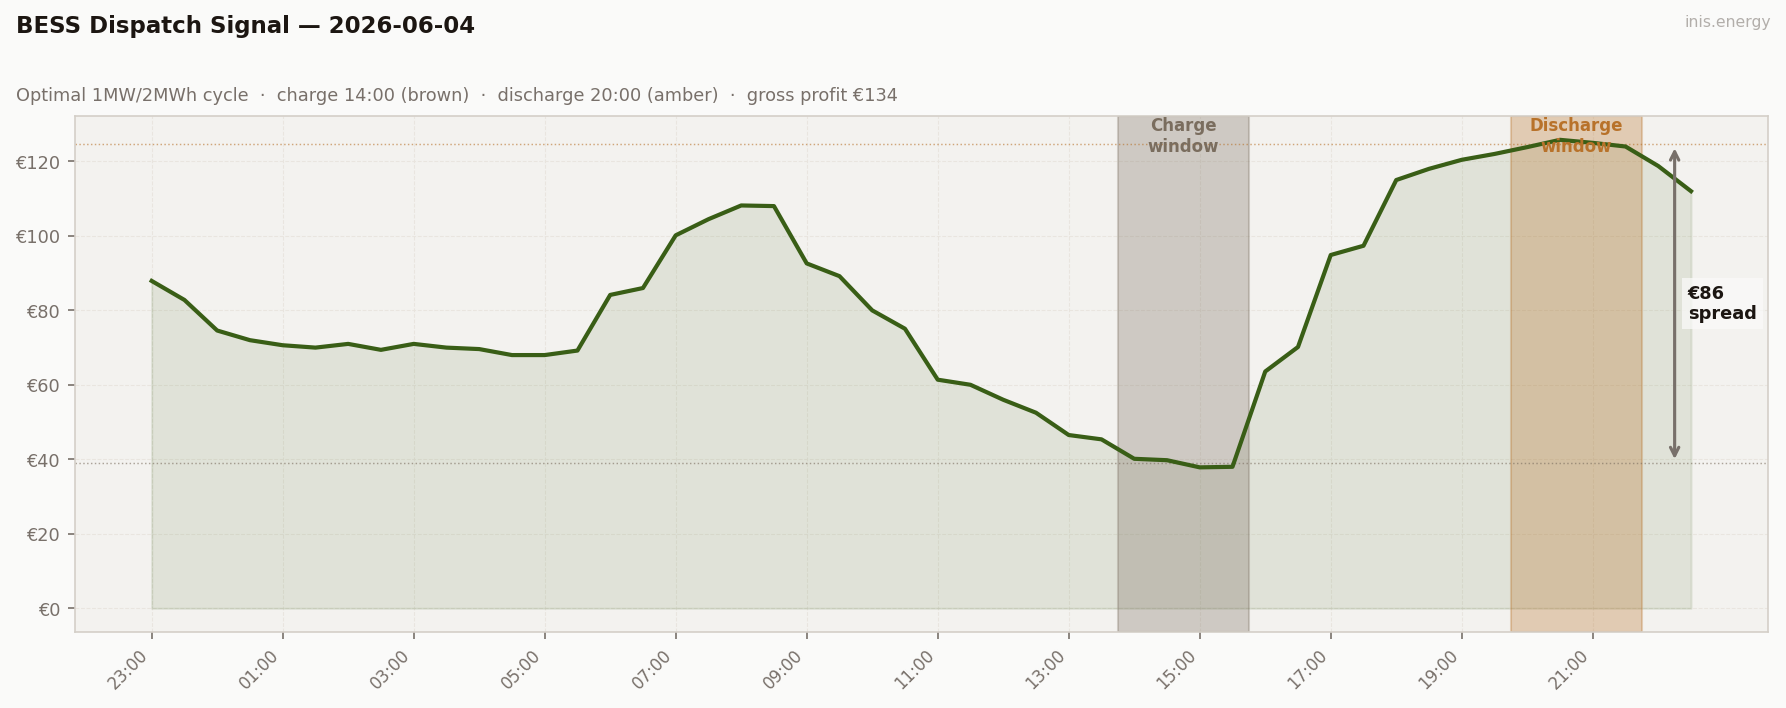
€134 gross — and the structural number is the ROI: 172%. Cheapest charge of the run by a wide margin (€39 vs the previous best €70 on June 3). Discharge into a €125 evening that’s barely a peak.
The day proves the symmetry of BESS revenue. The €86 spread three weeks ago would have come from a scarcity-peak discharge above an ordinary trough. Today it comes from a record-cheap charge below an ordinary peak. Same revenue from opposite ends of the curve.
Commentary #
A day with no peak. Mean €82.30, no period above €150, midday trough of €37.85 at 15:00 — the deepest 30-minute clearing price the run has seen by €27/MWh. Wind held 50% on a narrow 41–60% band all day. With wind that high and that steady, gas dropped out of the merit order at midday and the marginal plant was whatever cheaper unit was available.
The interesting BESS lesson today: the cheap end of the curve pays as much as the dear end. €39 charge, €125 discharge, €86 spread, €134 gross. Three weeks ago €134 days came from scarcity peaks above €200; today €134 comes from a sub-€40 trough below a €125 evening shoulder. Same number, opposite mechanism.
The wider point: BESS forecasting tends to focus on predicting peaks. Predicting troughs is the same problem. Today the dispatch model didn’t need to find a scarcity event — it just needed to identify when the wind was high enough to push gas out of the merit order at midday. That’s an arguably easier forecasting problem than next-day scarcity, and it pays the same.
Half-hourly data — 2026-06-04
| Period | Time | Price (€/MWh) | Wind % |
|---|---|---|---|
| 1 | 23:00 | 87.91 | 41.2% |
| 2 | 23:30 | 82.80 | 42.7% |
| 3 | 00:00 | 74.59 | 56.1% |
| 4 | 00:30 | 72.00 | 56.0% |
| 5 | 01:00 | 70.64 | 56.7% |
| 6 | 01:30 | 70.00 | 55.4% |
| 7 | 02:00 | 71.00 | 54.2% |
| 8 | 02:30 | 69.40 | 54.9% |
| 9 | 03:00 | 71.00 | 55.6% |
| 10 | 03:30 | 70.00 | 54.1% |
| 11 | 04:00 | 69.61 | 52.8% |
| 12 | 04:30 | 68.00 | 53.0% |
| 13 | 05:00 | 68.00 | 52.8% |
| 14 | 05:30 | 69.21 | 50.8% |
| 15 | 06:00 | 84.15 | 50.3% |
| 16 | 06:30 | 86.00 | 47.0% |
| 17 | 07:00 | 100.15 | 43.1% |
| 18 | 07:30 | 104.48 | 44.6% |
| 19 | 08:00 | 108.17 | 43.8% |
| 20 | 08:30 | 108.00 | 44.0% |
| 21 | 09:00 | 92.61 | 44.0% |
| 22 | 09:30 | 89.19 | 46.6% |
| 23 | 10:00 | 80.00 | 44.8% |
| 24 | 10:30 | 75.07 | 44.2% |
| 25 | 11:00 | 61.39 | 44.2% |
| 26 | 11:30 | 60.02 | 42.7% |
| 27 | 12:00 | 56.00 | 42.8% |
| 28 | 12:30 | 52.52 | 43.1% |
| 29 | 13:00 | 46.53 | 43.9% |
| 30 | 13:30 | 45.37 | 43.4% |
| 31 | 14:00 | 40.15 | 46.3% |
| 32 | 14:30 | 39.77 | 44.5% |
| 33 | 15:00 | 37.85 | 47.0% |
| 34 | 15:30 | 38.00 | 52.6% |
| 35 | 16:00 | 63.59 | 56.7% |
| 36 | 16:30 | 70.17 | 55.5% |
| 37 | 17:00 | 94.87 | 55.0% |
| 38 | 17:30 | 97.35 | 57.5% |
| 39 | 18:00 | 115.00 | 58.7% |
| 40 | 18:30 | 118.00 | 58.6% |
| 41 | 19:00 | 120.43 | 59.8% |
| 42 | 19:30 | 122.00 | 57.7% |
| 43 | 20:00 | 123.84 | 56.9% |
| 44 | 20:30 | 125.79 | 53.8% |
| 45 | 21:00 | 124.98 | 50.8% |
| 46 | 21:30 | 124.00 | 47.9% |
| 47 | 22:00 | 118.76 | 43.5% |
| 48 | 22:30 | 112.00 | 42.2% |
Compare your business electricity and gas rates in minutes with INIS Energy Brokers.
Compare rates