I-SEM Daily Briefing — 5 June 2026
Table of Contents
Market Snapshot
| Metric | Value |
|---|---|
| Mean DAM Price | €130.98/MWh |
| Median Price | €126.32/MWh |
| Std Dev | €19.79/MWh |
| Peak Price | €177.5/MWh (07:30) |
| Min Price | €95.58/MWh (23:30) |
| Price Range | €81.92/MWh |
| Periods above €150 | 9 of 48 (19%) |
| Periods above €200 | 0 of 48 (0%) |
| Peak Avg (07–22) | €139.94/MWh |
| Off-peak Avg (22–07) | €116.05/MWh |
| Peak/Off-Peak Spread | €23.89/MWh |
| Wind % of Demand | 39.1% |
| Wind Range | 15.6%–67.5% |
| Mean Demand | 3765 MW |
Price Profile #
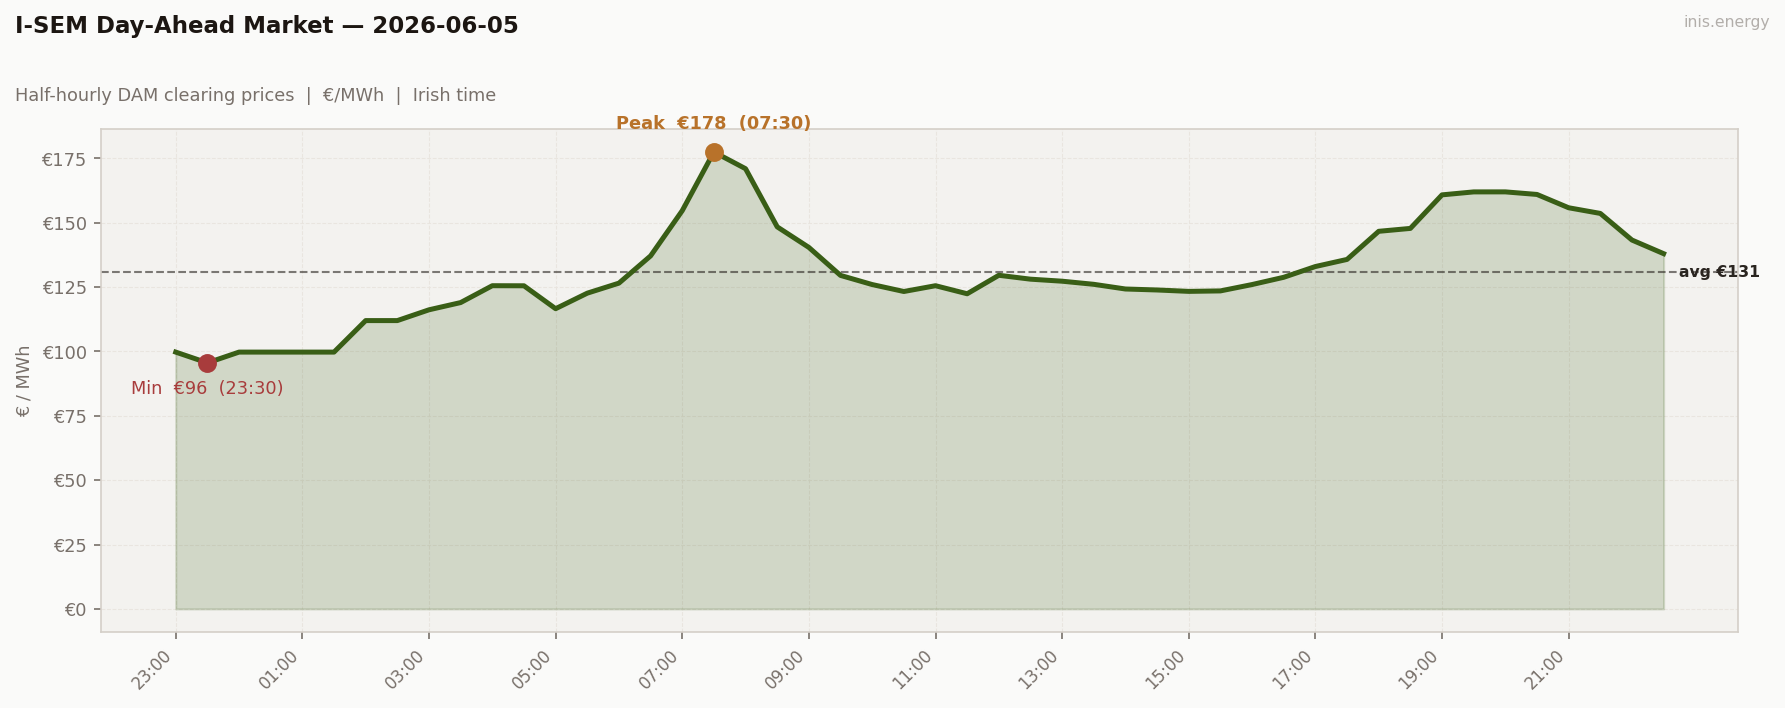
Std dev €19.79/MWh · Median €126.32/MWh · Periods above €150: 9 of 48 (19%)
Wind shortfall returns. Mean €130.98 — up €49 from yesterday. Morning ramp climbed €126 at 06:00 → €177.50 at 07:30 as wind dropped from 28% to 16%. The morning peak block (07:00–08:30) averaged €163.
Boundary periods 1–2 are at €99 and €95 with 67% wind — Thursday’s tail extending into Friday’s file, since Thursday closed cheap. The boundary actually catches the day’s MIN (€95.58 at 23:30) rather than the peak — a clean reversal of the May 30 / June 3 pattern.
Midday belly settled €122–130 from 10:30 to 15:30 — not deep, because wind dropped to 28-40% through midday rather than holding high. Evening built smoothly to €162 by 19:30 and held €155–162 from 19:00 to 21:00, fading into the late evening.
9 periods above €150, none above €200. A working-day morning shortfall without scarcity escalation.
Price vs Wind #
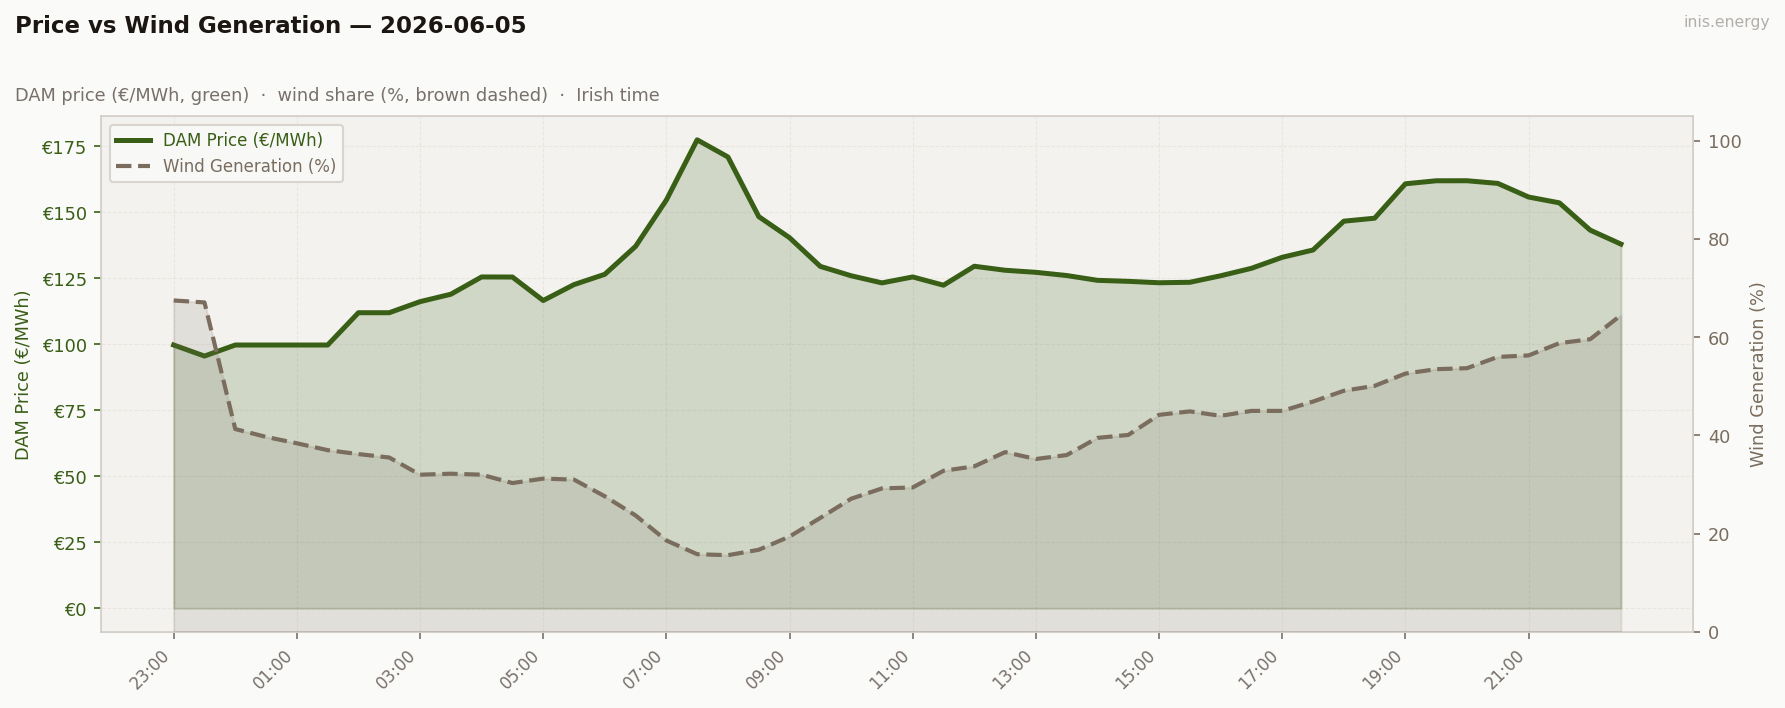
Mean wind: 39.1% · Range: 15.6%–67.5%
Wind crashed 67% → 16% between 23:00 the night before and 08:00 this morning. A 51-point decline in 9 hours. That drained the merit order into expensive gas right as Friday demand returned.
But — and this is the structural point — the morning peak only hit €177, not €225 like June 2. Same kind of overnight-into-morning wind decline, but Friday demand is slightly lower than post-holiday-Tuesday demand, and the merit order stopped short of peakers.
Week in Context #
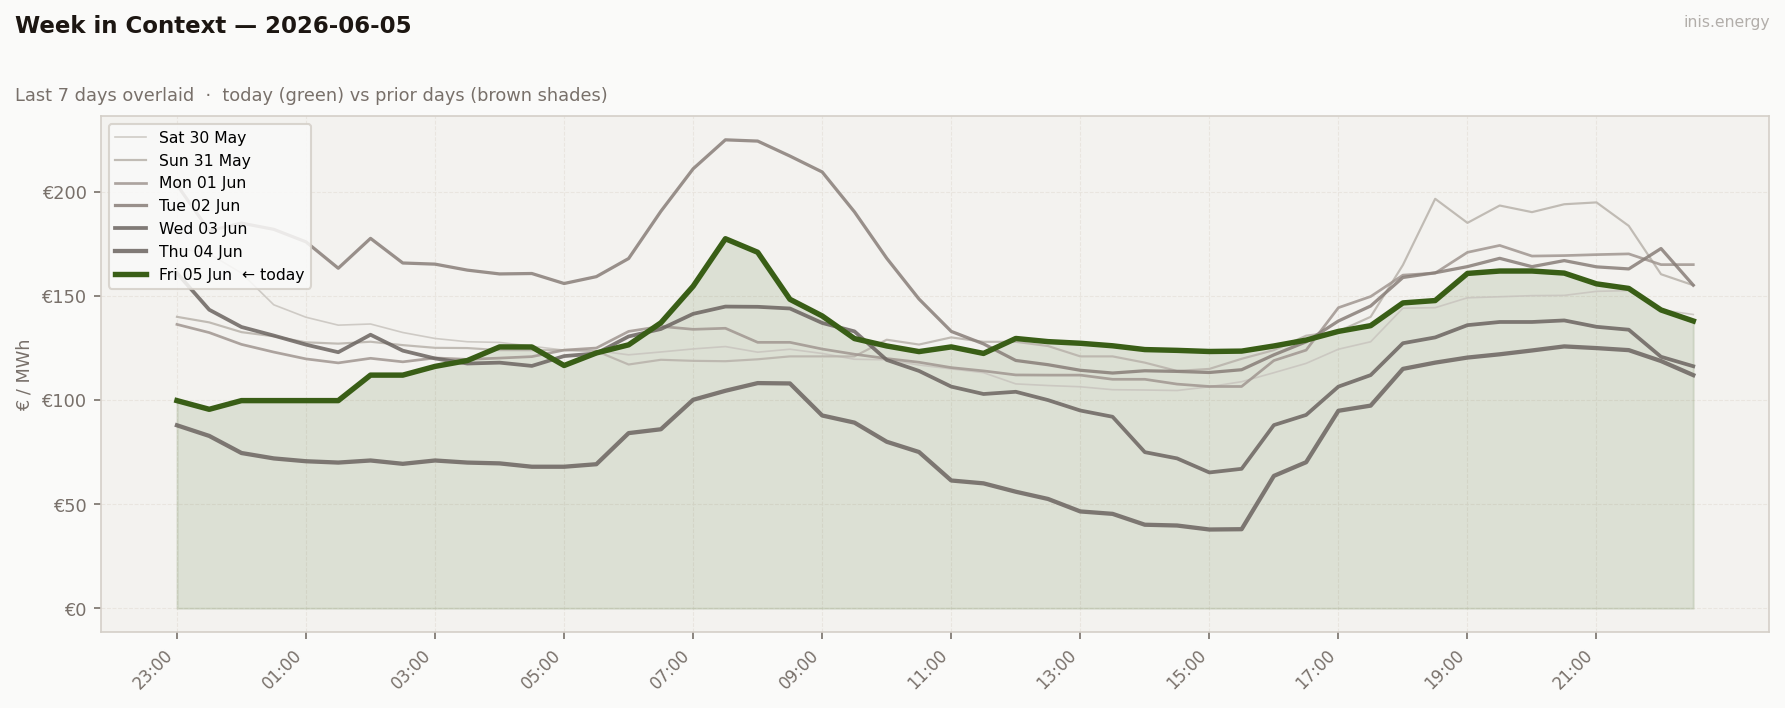
Three days, three wind regimes: Wed 55% → Thu 50% → Fri 39%. Mean climbing back up as wind drops. The pattern reverses again next week.
Price Duration Curve #
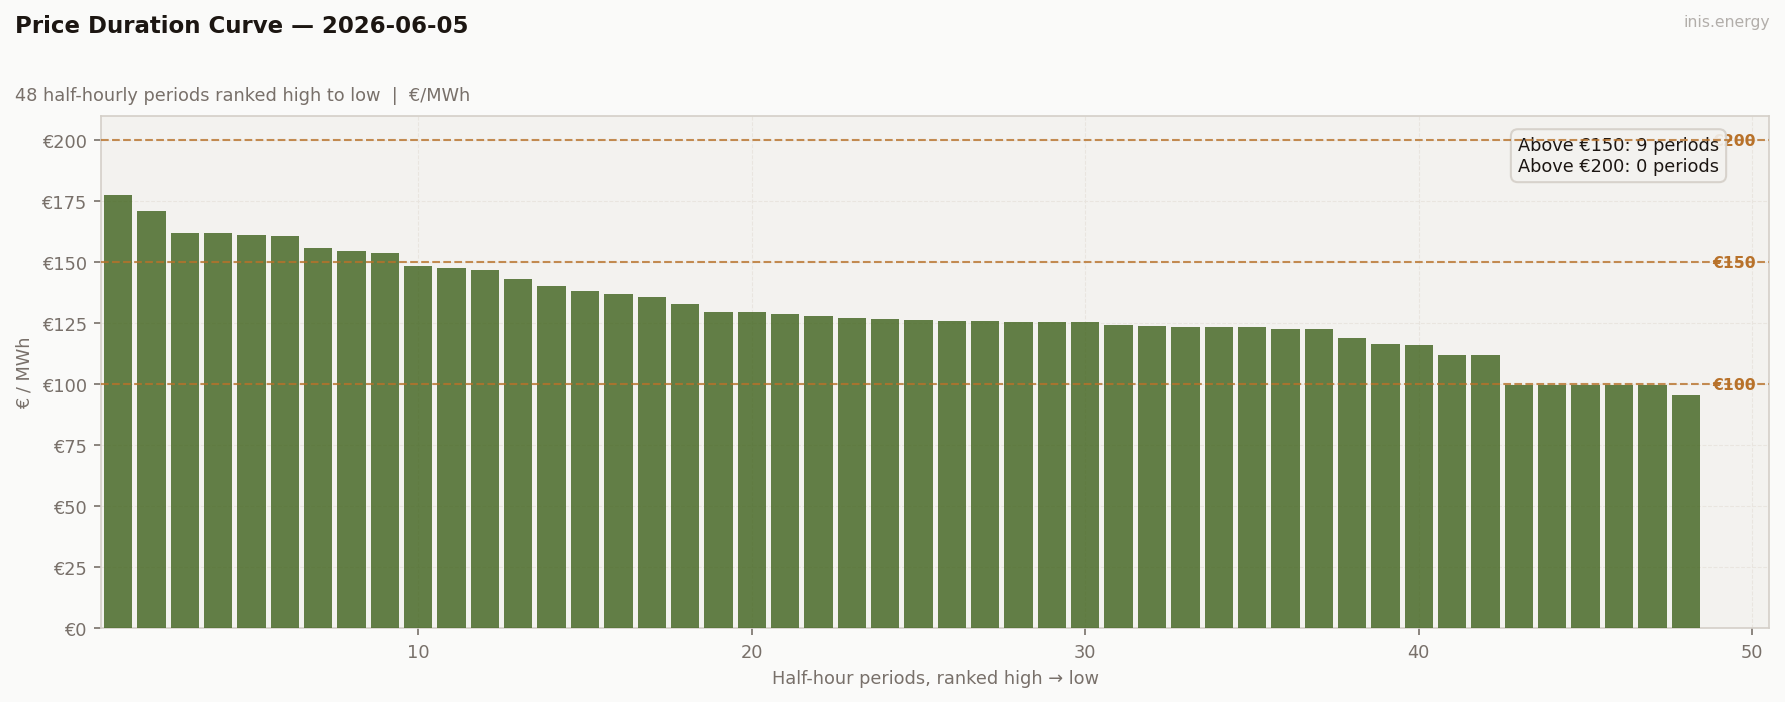
Periods above €150: 9 (19% of day) · Above €200: 0 (0% of day)
9 above €150, 0 above €200. A shaped working day without scarcity — moderate top shoulder of 9 periods €152–178, smooth mid-section, modest bottom (cheapest 4 at €99).
Peak / Off-Peak Spread #
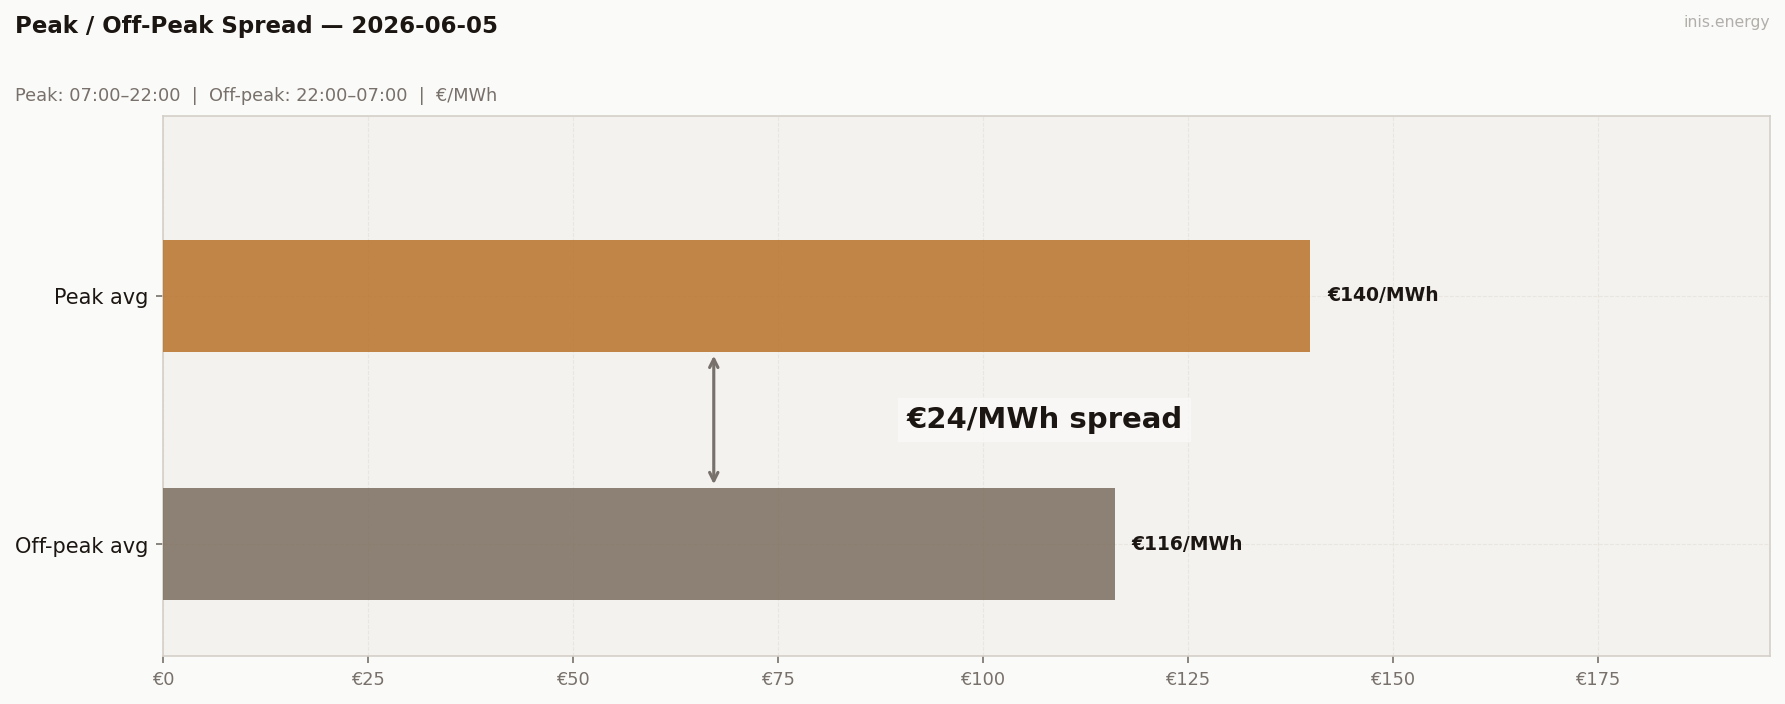
Peak avg (07:00–22:00): €139.94/MWh · Off-peak avg: €116.05/MWh · Spread: €23.89/MWh
€23.89. The first clean positive reading in days. Peak avg €139.94, off-peak avg €116.05.
Why does it work today? Because the cheap window IS overnight (the Thursday-tail prices spilling in are genuinely cheap), and the peak window contains the morning peak plus the evening climb. The metric is honest when the calendar happens to line up with the shape — which is rare in the data so far.
BESS Dispatch Signal #
| Price | Time | Energy | Value | |
|---|---|---|---|---|
| Charge | €99/MWh | 23:00 | 2 MWh | −€197 |
| Discharge | €163/MWh | 07:00 | 1.7 MWh (85% RTE) | +€277 |
| Gross profit | €80 | |||
| Price spread | €64/MWh | ROI: 40.3% |
Simulated 1MW/2MWh battery, one optimal DAM cycle. Gross before network charges and capacity costs.
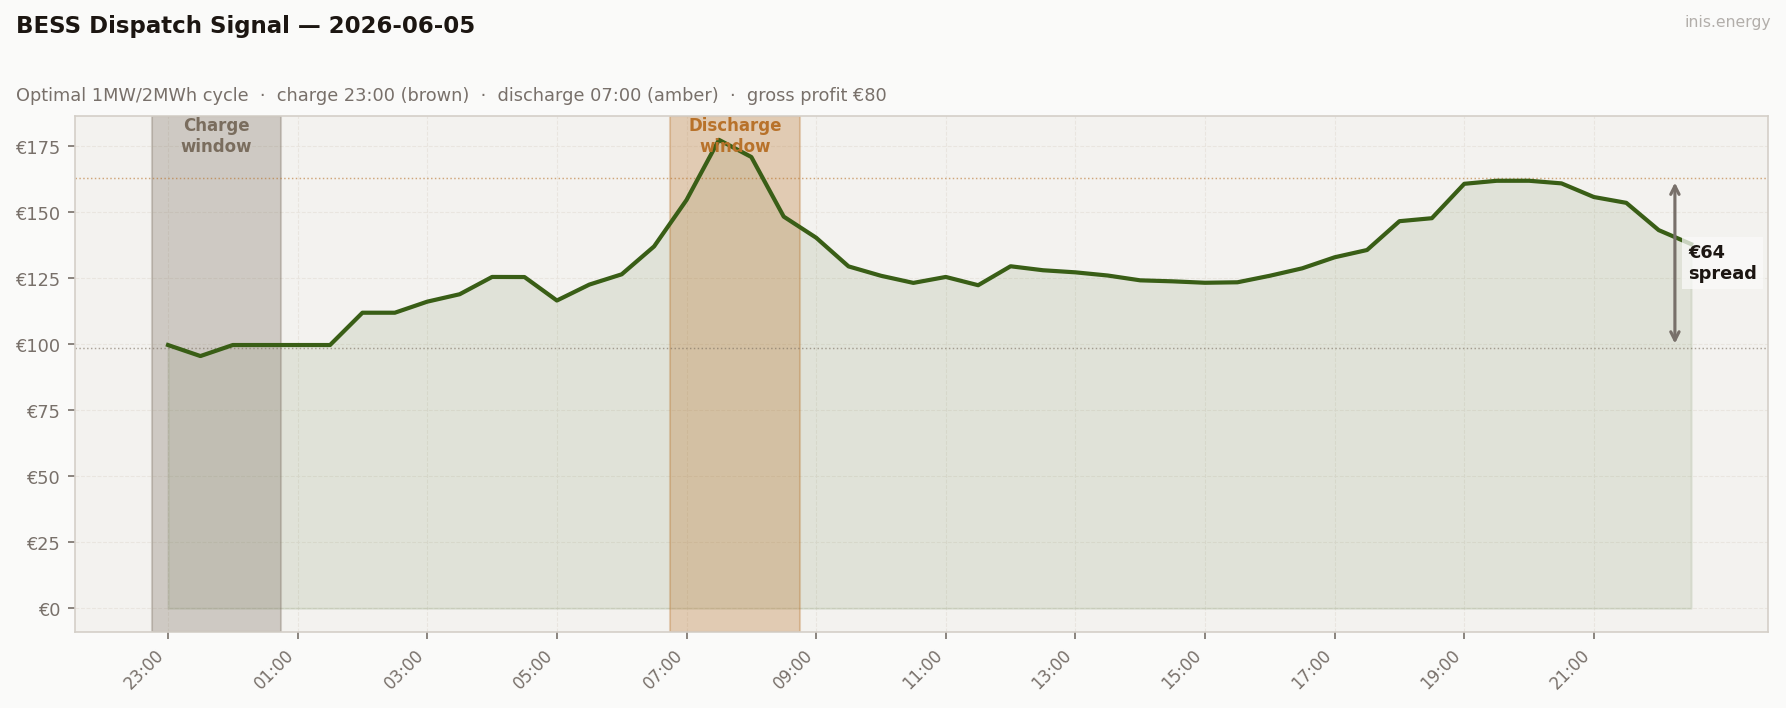
€80 gross. A morning-discharge day.
The charge window is interesting: it sits at the START of the SEM day (23:00–00:30), catching Thursday’s cheap evening tail. The optimiser found the four cheapest consecutive half-hours in the boundary band averaging €99. That’s the inverse of the May 30 boundary discharge problem — here the boundary lets us charge cheap rather than letting us discharge expensive. Either way, the boundary affects the dispatch.
Commentary #
Wind crashed overnight and brought the morning peak back. 67% wind at 23:00 → 16% by 08:00 — a 51-point drop in 9 hours. The morning ramp climbed €126 → €177 as the merit order ran into gas at low wind levels. But Friday demand kept the climb short of peakers — €177, not €225.
BESS €80 — modest. The charge window sits at the start of the SEM day, picking up Thursday’s cheap tail. That’s the boundary doing the opposite of what it usually does — letting us charge cheap rather than discharge expensive.
Eight morning-discharge days in the run now. Five of them are clustered in the past two weeks. The wind pattern that produces them — overnight wind too high to be a sustained shortfall, then a sharp drain into morning demand — has been the dominant wind shape of late.
Half-hourly data — 2026-06-05
| Period | Time | Price (€/MWh) | Wind % |
|---|---|---|---|
| 1 | 23:00 | 99.76 | 67.5% |
| 2 | 23:30 | 95.58 | 67.1% |
| 3 | 00:00 | 99.76 | 41.3% |
| 4 | 00:30 | 99.76 | 39.7% |
| 5 | 01:00 | 99.76 | 38.4% |
| 6 | 01:30 | 99.76 | 37.0% |
| 7 | 02:00 | 112.00 | 36.2% |
| 8 | 02:30 | 112.00 | 35.5% |
| 9 | 03:00 | 116.19 | 32.0% |
| 10 | 03:30 | 119.00 | 32.2% |
| 11 | 04:00 | 125.55 | 32.0% |
| 12 | 04:30 | 125.52 | 30.3% |
| 13 | 05:00 | 116.62 | 31.2% |
| 14 | 05:30 | 122.65 | 31.0% |
| 15 | 06:00 | 126.55 | 27.6% |
| 16 | 06:30 | 137.13 | 23.7% |
| 17 | 07:00 | 154.70 | 18.6% |
| 18 | 07:30 | 177.50 | 15.8% |
| 19 | 08:00 | 171.00 | 15.6% |
| 20 | 08:30 | 148.41 | 16.7% |
| 21 | 09:00 | 140.42 | 19.4% |
| 22 | 09:30 | 129.55 | 23.2% |
| 23 | 10:00 | 126.00 | 27.1% |
| 24 | 10:30 | 123.30 | 29.2% |
| 25 | 11:00 | 125.55 | 29.4% |
| 26 | 11:30 | 122.42 | 32.8% |
| 27 | 12:00 | 129.60 | 33.7% |
| 28 | 12:30 | 128.09 | 36.6% |
| 29 | 13:00 | 127.30 | 35.2% |
| 30 | 13:30 | 126.09 | 36.0% |
| 31 | 14:00 | 124.27 | 39.5% |
| 32 | 14:30 | 123.89 | 40.1% |
| 33 | 15:00 | 123.35 | 44.2% |
| 34 | 15:30 | 123.53 | 44.9% |
| 35 | 16:00 | 126.00 | 44.0% |
| 36 | 16:30 | 128.82 | 45.0% |
| 37 | 17:00 | 133.00 | 45.0% |
| 38 | 17:30 | 135.76 | 46.9% |
| 39 | 18:00 | 146.68 | 49.1% |
| 40 | 18:30 | 147.81 | 50.1% |
| 41 | 19:00 | 160.84 | 52.6% |
| 42 | 19:30 | 161.99 | 53.5% |
| 43 | 20:00 | 162.00 | 53.7% |
| 44 | 20:30 | 161.00 | 56.0% |
| 45 | 21:00 | 155.83 | 56.3% |
| 46 | 21:30 | 153.63 | 58.8% |
| 47 | 22:00 | 143.29 | 59.6% |
| 48 | 22:30 | 138.00 | 64.5% |
Compare your business electricity and gas rates in minutes with INIS Energy Brokers.
Compare rates