I-SEM Daily Briefing — 6 June 2026
Table of Contents
Market Snapshot
| Metric | Value |
|---|---|
| Mean DAM Price | €114.35/MWh |
| Median Price | €121.16/MWh |
| Std Dev | €24.82/MWh |
| Peak Price | €152.0/MWh (19:30) |
| Min Price | €69.92/MWh (14:30) |
| Price Range | €82.08/MWh |
| Periods above €150 | 2 of 48 (4%) |
| Periods above €200 | 0 of 48 (0%) |
| Peak Avg (07–22) | €107.59/MWh |
| Off-peak Avg (22–07) | €125.61/MWh |
| Peak/Off-Peak Spread | €-18.02/MWh |
| Wind % of Demand | 43.9% |
| Wind Range | 30.3%–67.3% |
| Mean Demand | 3608 MW |
Price Profile #
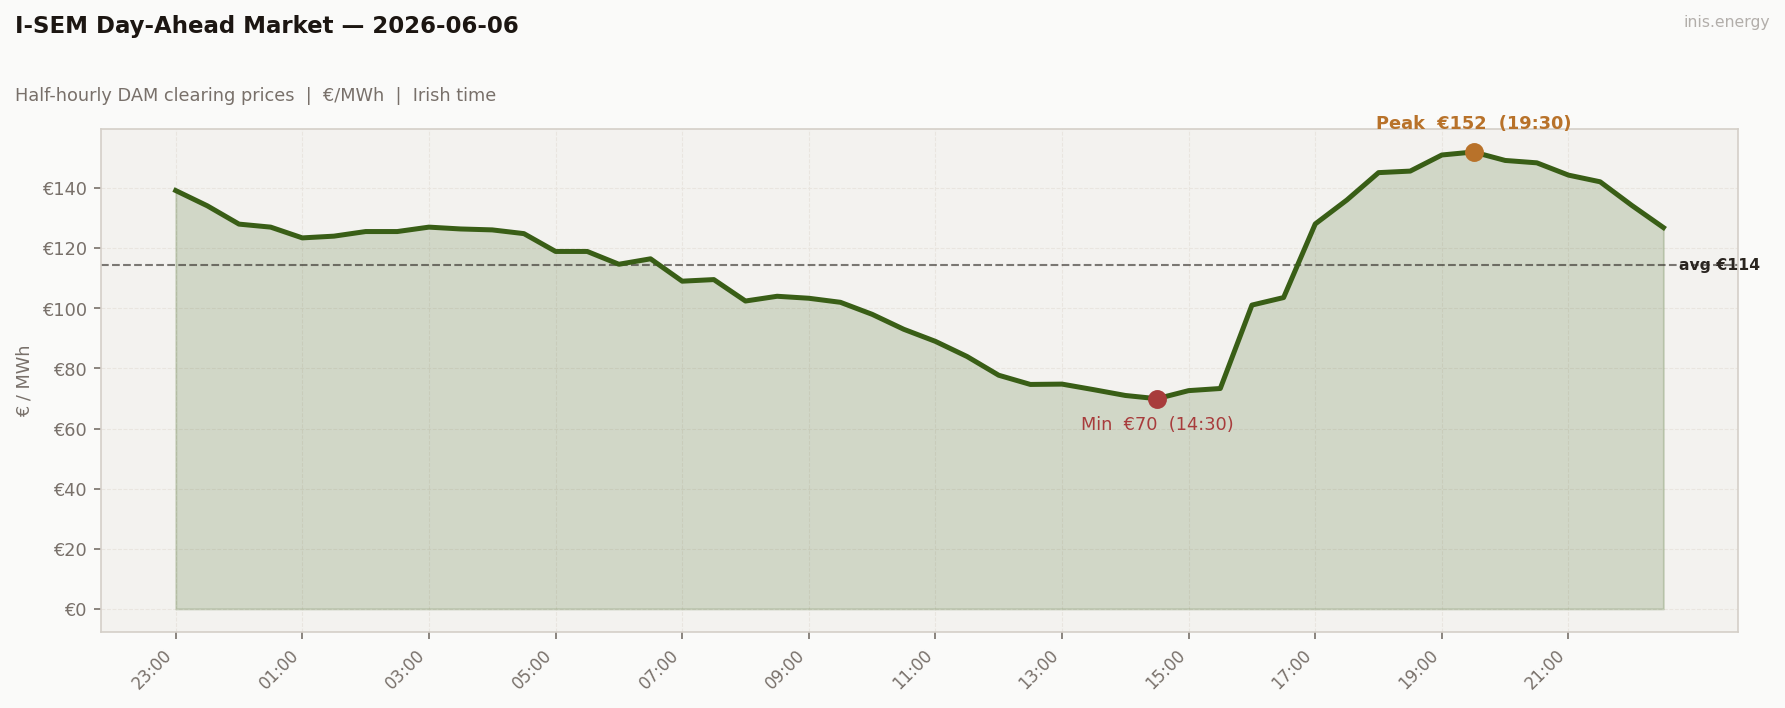
Std dev €24.82/MWh · Median €121.16/MWh · Periods above €150: 2 of 48 (4%)
A calm Saturday with another record-low trough. Mean €114.35, peak only €152.00 at 19:30, min €69.92 at 14:30. Range €82.
Boundary periods at €139 and €134 are Friday’s evening tail crossing in. Then a clean descent through overnight (€118–128 from 01:00 to 05:30, wind 47-67%) into the morning — but no morning peak. €109 at 07:00 → €102 at 08:00 → €89 at 11:00 → €70 at 14:30. The midday trough goes deeper than yesterday’s because Saturday demand is suppressed.
Evening rebuilt €73 at 15:30 → €152 at 19:30, holding €148–152 across 19:00 to 21:00. Just two periods crossed €150.
Wind held 30–67% — recovered through late afternoon and evening, which capped the evening peak.
Price vs Wind #
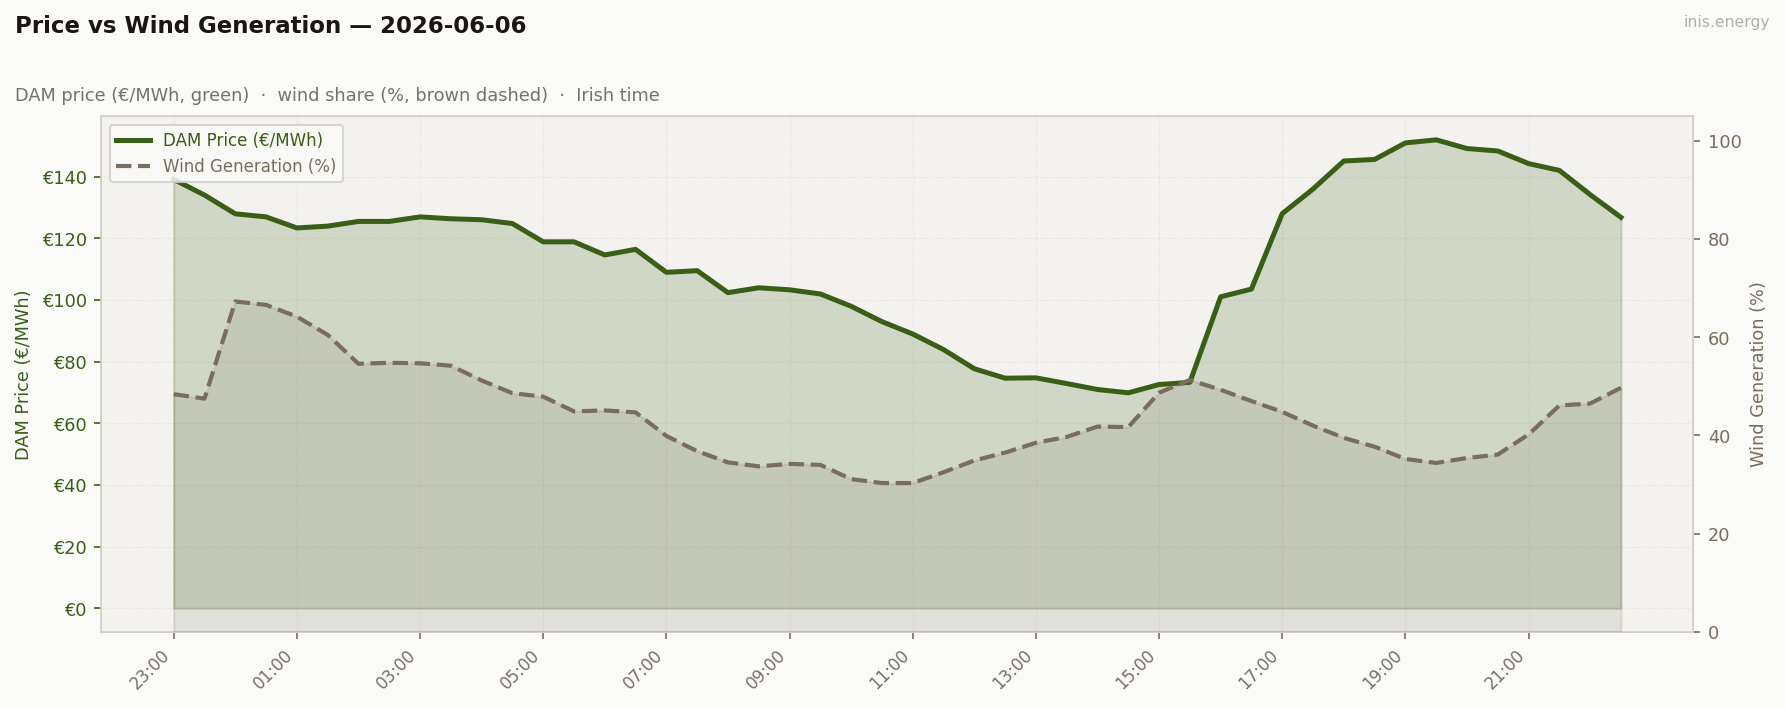
Mean wind: 43.9% · Range: 30.3%–67.3%
Wind shape: high overnight (54-67% in the early hours), drained to a midday low of 30% around 10:30-11:00, recovered to 50%+ from 15:30 onward.
The midday trough (€69.92) happens at the low wind point of the day for the first time in the run. Counter-intuitive — but the explanation is demand: Saturday midday demand was at its weekend minimum, so even 30% wind was enough to push the merit order into surplus territory. Wind level doesn’t matter once you’re below the demand-load threshold.
Week in Context #
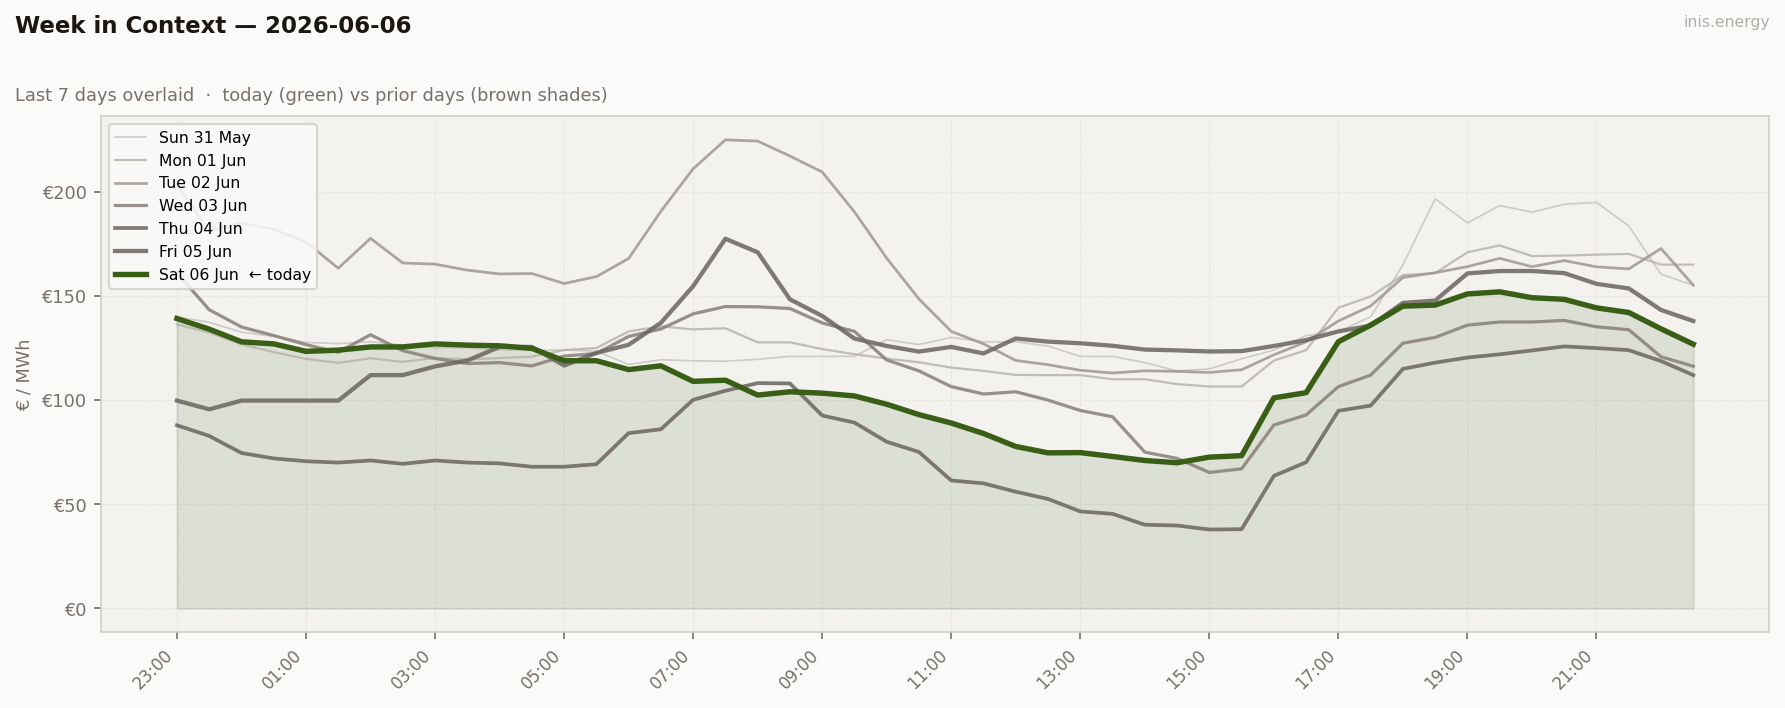
Three midday-trough record lows in five days: €65.25 (Wed), €37.85 (Thu), €69.92 (Sat). The surplus regime is structural now, not anomalous.
Price Duration Curve #
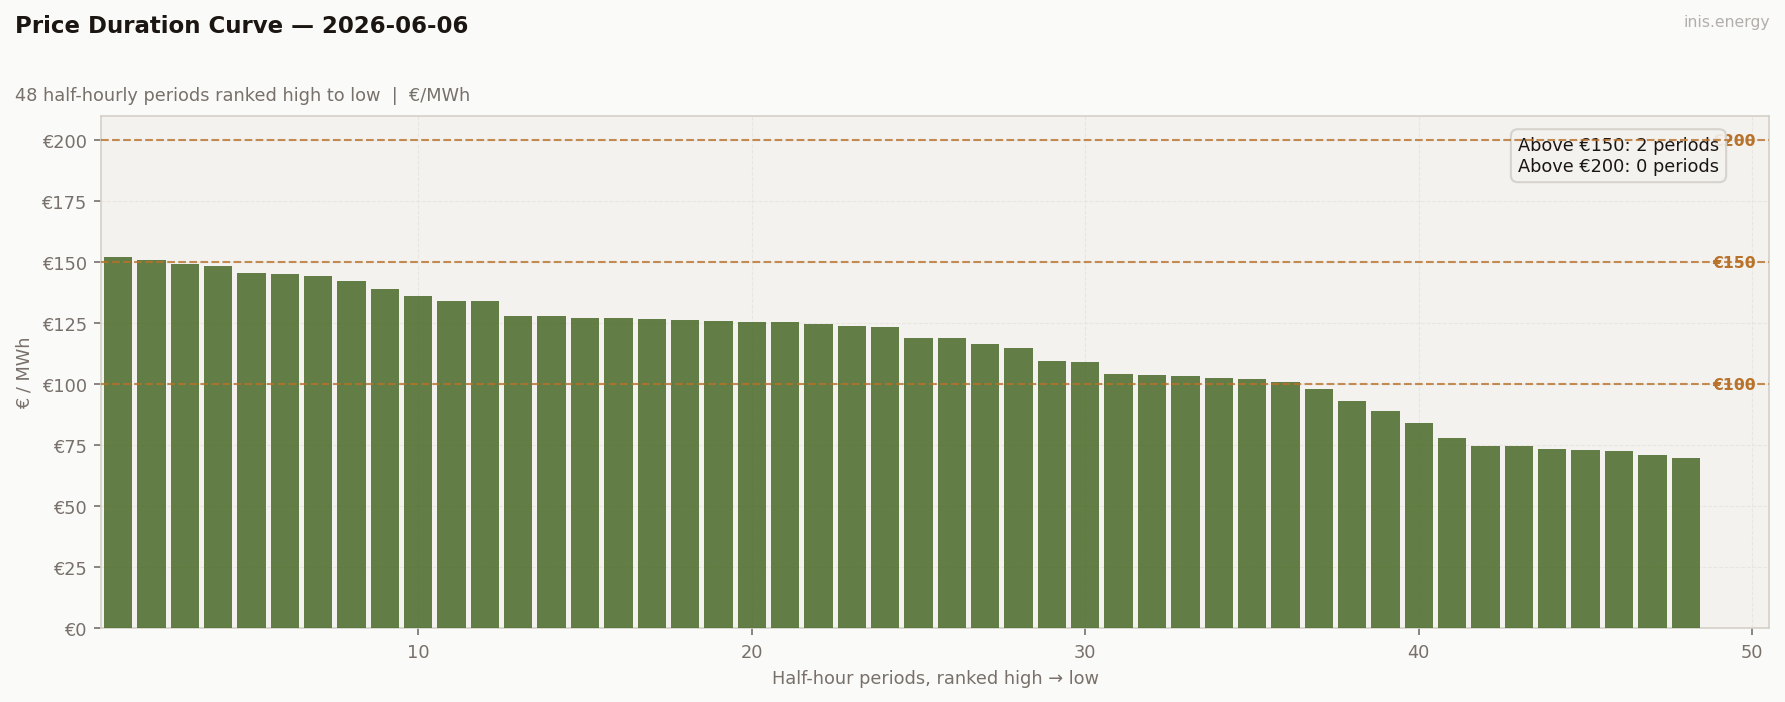
Periods above €150: 2 (4% of day) · Above €200: 0 (0% of day)
2 above €150, 0 above €200. Almost the all-day-sub-€150 archetype again, just barely missing.
Peak / Off-Peak Spread #
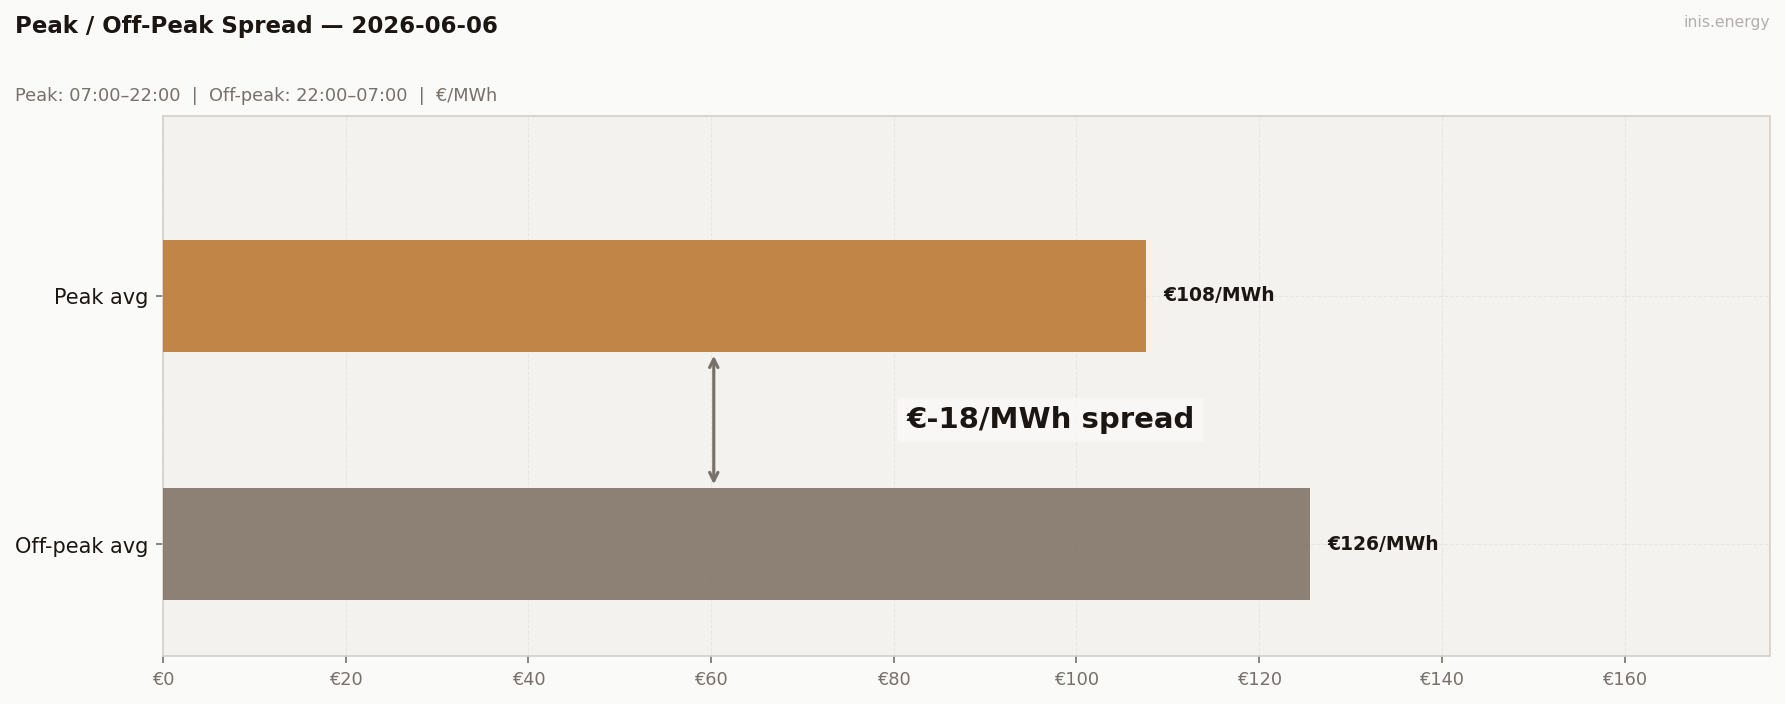
Peak avg (07:00–22:00): €107.59/MWh · Off-peak avg: €125.61/MWh · Spread: €-18.02/MWh
−€18.02 — sixth negative reading in 32 days, and one of the more extreme ones.
Same structural cause as the May 30 / June 2 / June 3 readings. Boundary catches Friday’s tail; midday trough sits inside the peak window. The metric inverts. The captured spread (€79) is 4.4× the absolute value of the headline.
A negative spread is now appearing every 4-5 days in this regime. Worth a tag on the dashboard.
BESS Dispatch Signal #
| Price | Time | Energy | Value | |
|---|---|---|---|---|
| Charge | €72/MWh | 13:30 | 2 MWh | −€143 |
| Discharge | €150/MWh | 19:00 | 1.7 MWh (85% RTE) | +€255 |
| Gross profit | €112 | |||
| Price spread | €79/MWh | ROI: 78.2% |
Simulated 1MW/2MWh battery, one optimal DAM cycle. Gross before network charges and capacity costs.
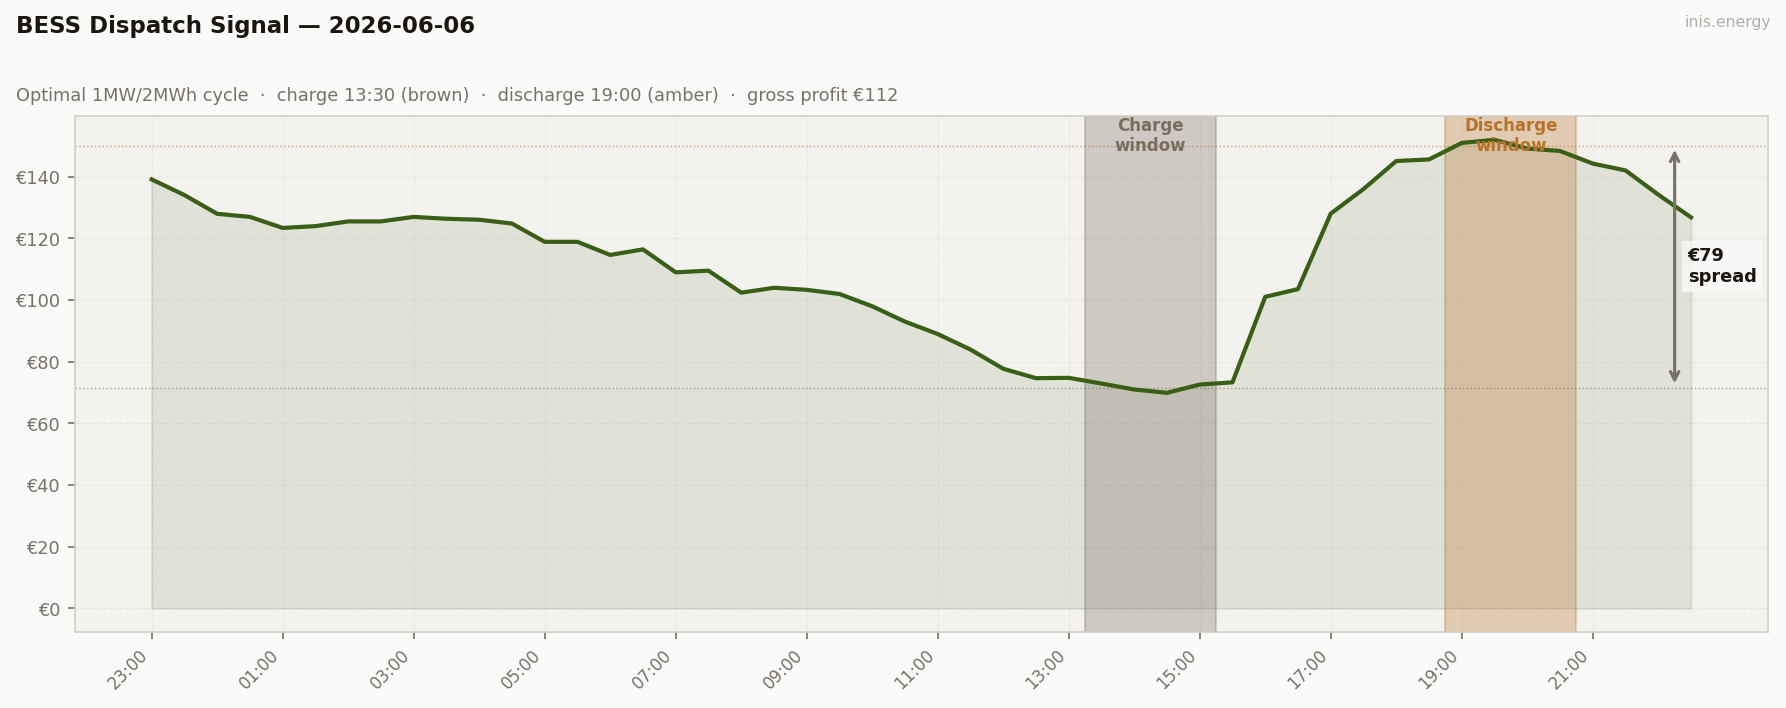
€112 gross. Cheap charge (€72) does the work again — ROI 78.2% on a modest discharge (€150). The same pattern as June 4 in miniature.
Commentary #
Another deep midday trough — €69.92 at 14:30, the third record low this week after €37.85 on Thursday and €65.25 on Wednesday. Calm Saturday, weekend demand at 3,608 MW, wind 30-67% with the lowest point at midday.
The structural feature: wind at 30% in midday produced a deep trough today because Saturday demand was suppressed enough that even moderate wind cleared the merit order. Wind level doesn’t matter when you’re below the demand-load threshold — what matters is whether wind exceeds the variable cost of the next plant on the stack.
BESS €112 — solid day, cheap charge unlocks the ROI. Negative peak/off-peak spread again (−€18.02, the run’s sixth). The metric is broken often enough now that a permanent flag on the dashboard is overdue.
Half-hourly data — 2026-06-06
| Period | Time | Price (€/MWh) | Wind % |
|---|---|---|---|
| 1 | 23:00 | 139.17 | 48.4% |
| 2 | 23:30 | 134.08 | 47.5% |
| 3 | 00:00 | 128.00 | 67.3% |
| 4 | 00:30 | 127.00 | 66.6% |
| 5 | 01:00 | 123.42 | 64.2% |
| 6 | 01:30 | 124.00 | 60.5% |
| 7 | 02:00 | 125.53 | 54.6% |
| 8 | 02:30 | 125.53 | 54.8% |
| 9 | 03:00 | 127.00 | 54.7% |
| 10 | 03:30 | 126.39 | 54.2% |
| 11 | 04:00 | 126.08 | 51.2% |
| 12 | 04:30 | 124.84 | 48.6% |
| 13 | 05:00 | 118.91 | 47.9% |
| 14 | 05:30 | 118.91 | 44.9% |
| 15 | 06:00 | 114.65 | 45.1% |
| 16 | 06:30 | 116.46 | 44.7% |
| 17 | 07:00 | 109.02 | 39.9% |
| 18 | 07:30 | 109.55 | 36.8% |
| 19 | 08:00 | 102.42 | 34.5% |
| 20 | 08:30 | 104.00 | 33.7% |
| 21 | 09:00 | 103.34 | 34.2% |
| 22 | 09:30 | 101.99 | 34.0% |
| 23 | 10:00 | 98.00 | 31.1% |
| 24 | 10:30 | 93.02 | 30.3% |
| 25 | 11:00 | 89.00 | 30.3% |
| 26 | 11:30 | 83.96 | 32.5% |
| 27 | 12:00 | 77.73 | 34.9% |
| 28 | 12:30 | 74.67 | 36.5% |
| 29 | 13:00 | 74.78 | 38.5% |
| 30 | 13:30 | 72.93 | 39.7% |
| 31 | 14:00 | 71.00 | 41.8% |
| 32 | 14:30 | 69.92 | 41.7% |
| 33 | 15:00 | 72.61 | 48.7% |
| 34 | 15:30 | 73.32 | 51.3% |
| 35 | 16:00 | 101.07 | 49.3% |
| 36 | 16:30 | 103.57 | 47.0% |
| 37 | 17:00 | 128.06 | 44.8% |
| 38 | 17:30 | 136.03 | 42.0% |
| 39 | 18:00 | 145.13 | 39.5% |
| 40 | 18:30 | 145.64 | 37.7% |
| 41 | 19:00 | 151.00 | 35.2% |
| 42 | 19:30 | 152.00 | 34.4% |
| 43 | 20:00 | 149.18 | 35.4% |
| 44 | 20:30 | 148.39 | 36.1% |
| 45 | 21:00 | 144.30 | 40.2% |
| 46 | 21:30 | 142.08 | 46.1% |
| 47 | 22:00 | 134.23 | 46.5% |
| 48 | 22:30 | 126.85 | 49.7% |
Compare your business electricity and gas rates in minutes with INIS Energy Brokers.
Compare rates