I-SEM Daily Briefing — 7 June 2026
Table of Contents
Market Snapshot
| Metric | Value |
|---|---|
| Mean DAM Price | €75.32/MWh |
| Median Price | €62.16/MWh |
| Std Dev | €63.17/MWh |
| Peak Price | €205.2/MWh (22:00) |
| Min Price | €5.38/MWh (08:00) |
| Price Range | €199.82/MWh |
| Periods above €150 | 8 of 48 (17%) |
| Periods above €200 | 1 of 48 (2%) |
| Peak Avg (07–22) | €66.73/MWh |
| Off-peak Avg (22–07) | €89.64/MWh |
| Peak/Off-Peak Spread | €-22.91/MWh |
| Wind % of Demand | 42.8% |
| Wind Range | 28.9%–64.5% |
| Mean Demand | 3563 MW |
Price Profile #
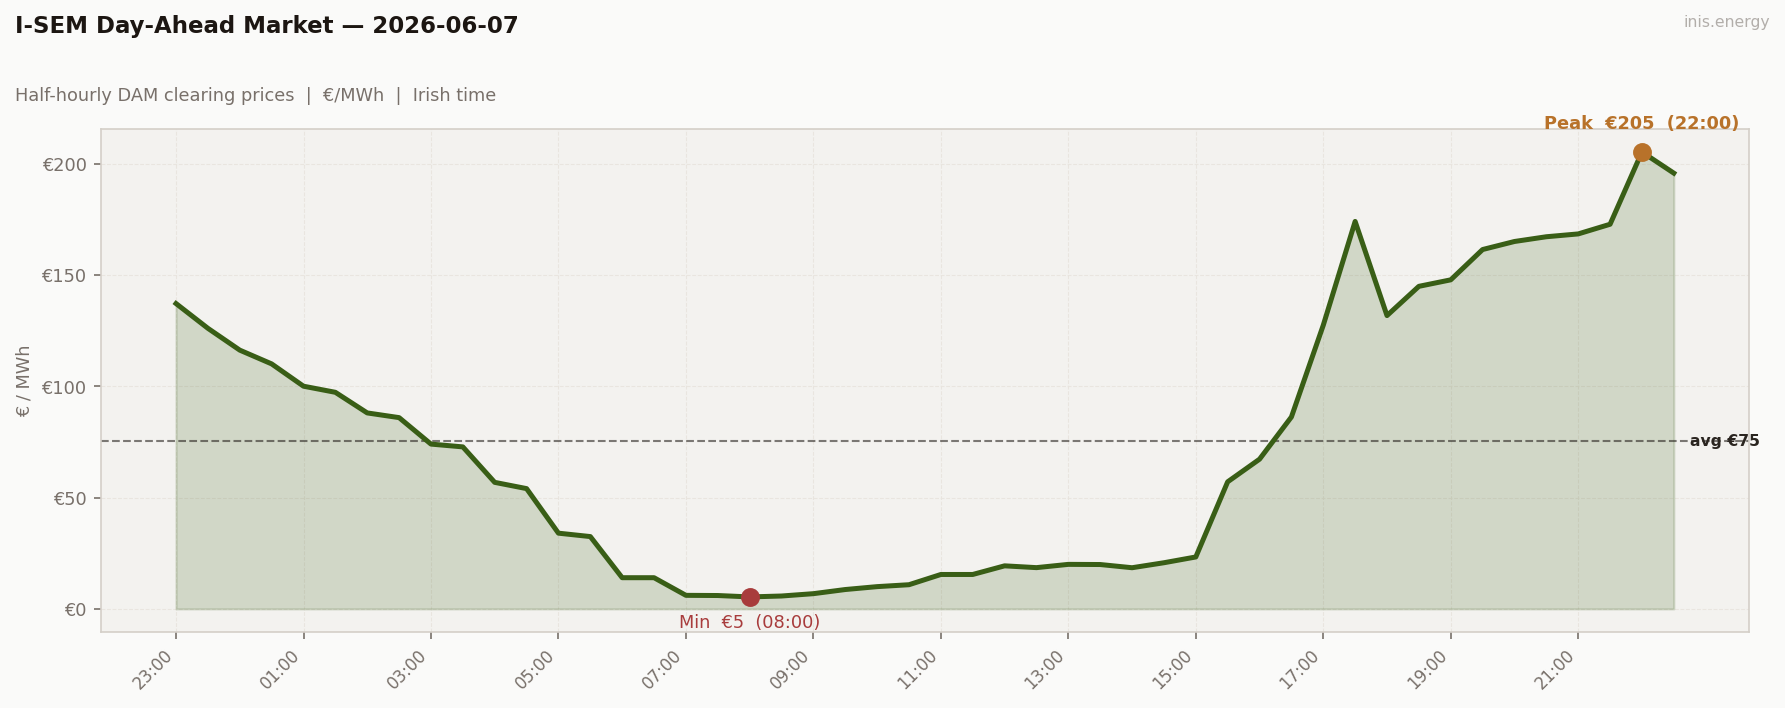
Std dev €63.17/MWh · Median €62.16/MWh · Periods above €150: 8 of 48 (17%)
A genuine outlier. Range €199.82. Std dev €63.17 — over twice any previous day in the run. Min €5.38 at 08:00 — a new record by €33. Peak €205.20 at 22:00.
The shape: a slow morning descent that didn’t stop. €137 at 23:00 (boundary) → €100 at 01:00 → €56 at 04:00 → €34 at 05:00 → €14 at 06:00. Through the entire working morning, prices ran €5–23: 19 consecutive half-hours below €25 from 06:30 to 15:00. Six half-hours below €10.
€5.38 is the absolute floor. That’s curtailment territory — the marginal plant was bidding the price down to keep wind from going to constraint payment.
Then the recovery. €23 at 15:00 → €57 at 15:30 → €127 at 17:00 → €174 at 17:30 → dipped back to €131 at 18:00 (a quirk in the shape) → climbed steadily to €205 at 22:00.
The single biggest within-day swing of the run: €5.38 to €205.20 inside 14 hours.
Price vs Wind #
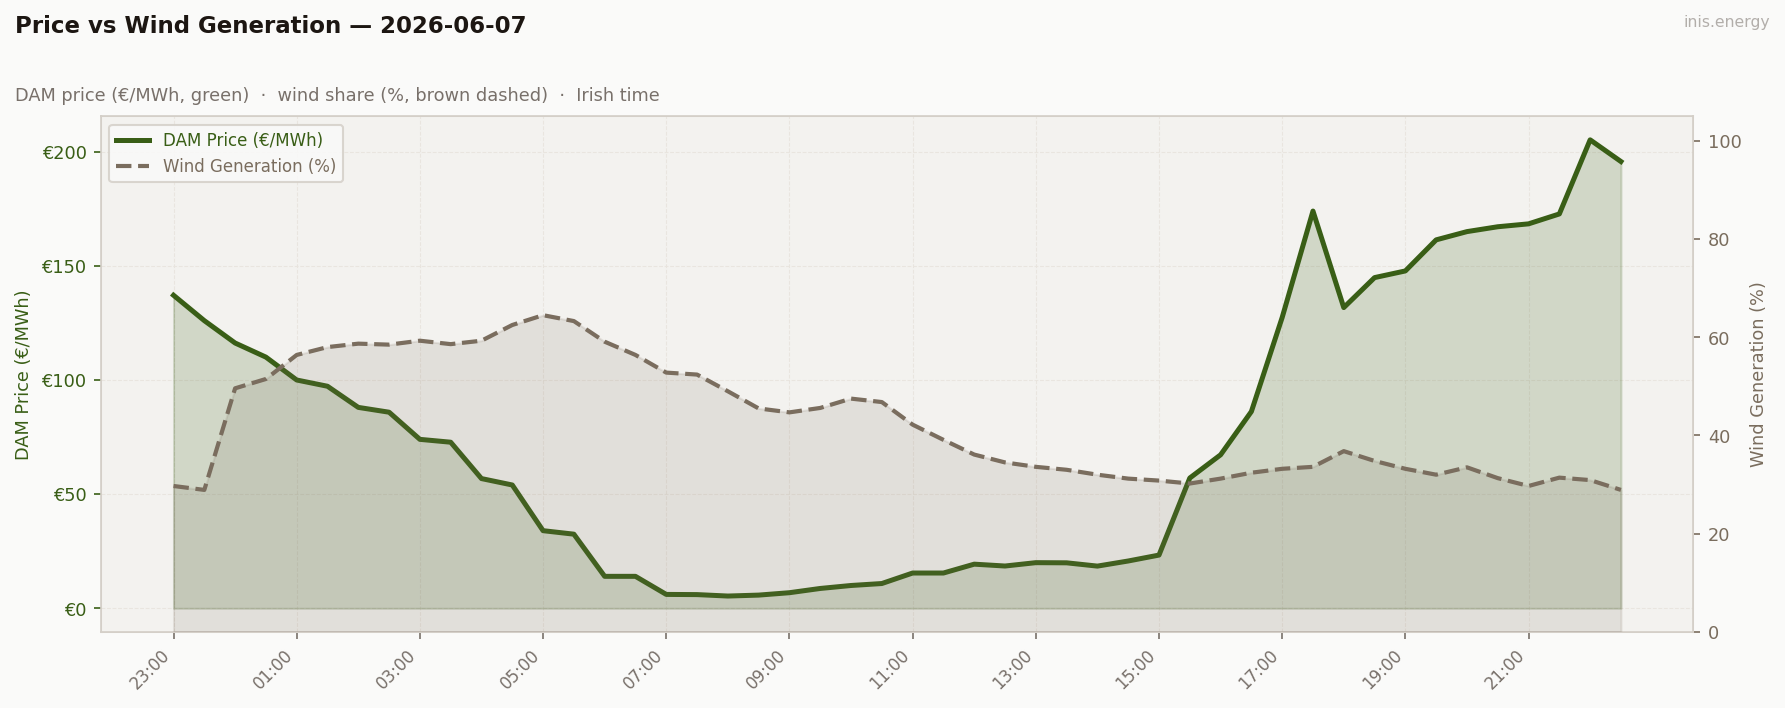
Mean wind: 42.8% · Range: 28.9%–64.5%
Wind peaked 64.5% at 05:00 and stayed above 50% from 02:00 through 16:30 — 14 hours of sustained high wind on a Sunday with weekend demand. That’s what produced the surplus floor.
Then wind drained: 50% at 17:00 → 33% at 18:00 → 30% at 21:00 → 29% by 22:30. The evening V-into-late-peak shape produced the scarcity event. Same wind-drain mechanism as June 2 and May 29, but coming off a much cheaper base.
The structural lesson: wind surplus and scarcity can coexist in the same day, and the spread between them is the BESS opportunity. Today produced both, in textbook form.
Week in Context #
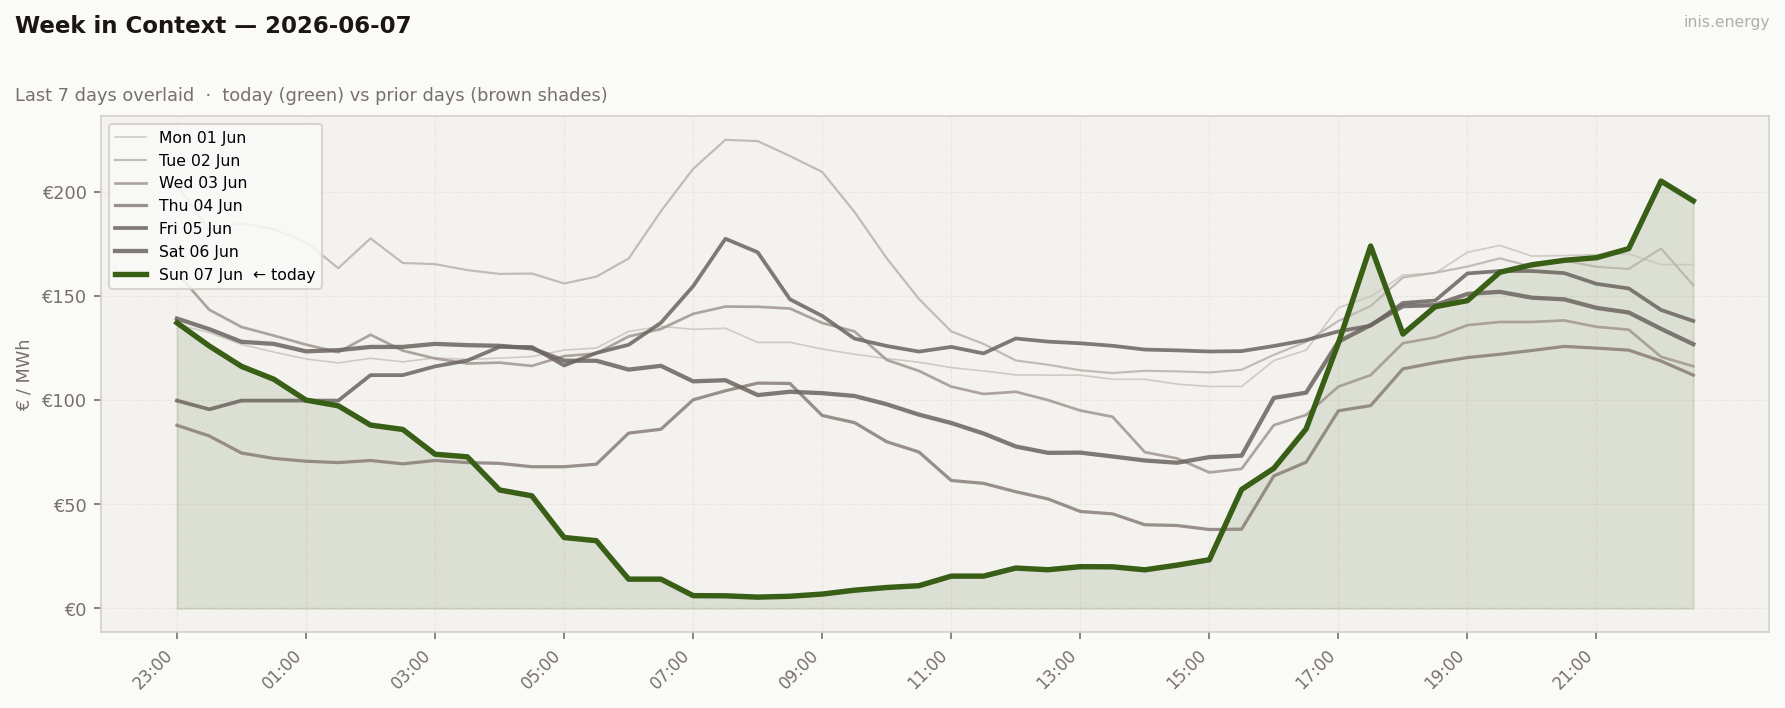
Two record-breaking days in four. June 4 broke the trough record at €37.85; June 7 broke it again at €5.38. The run is now operating in a new price regime at the bottom end.
Price Duration Curve #
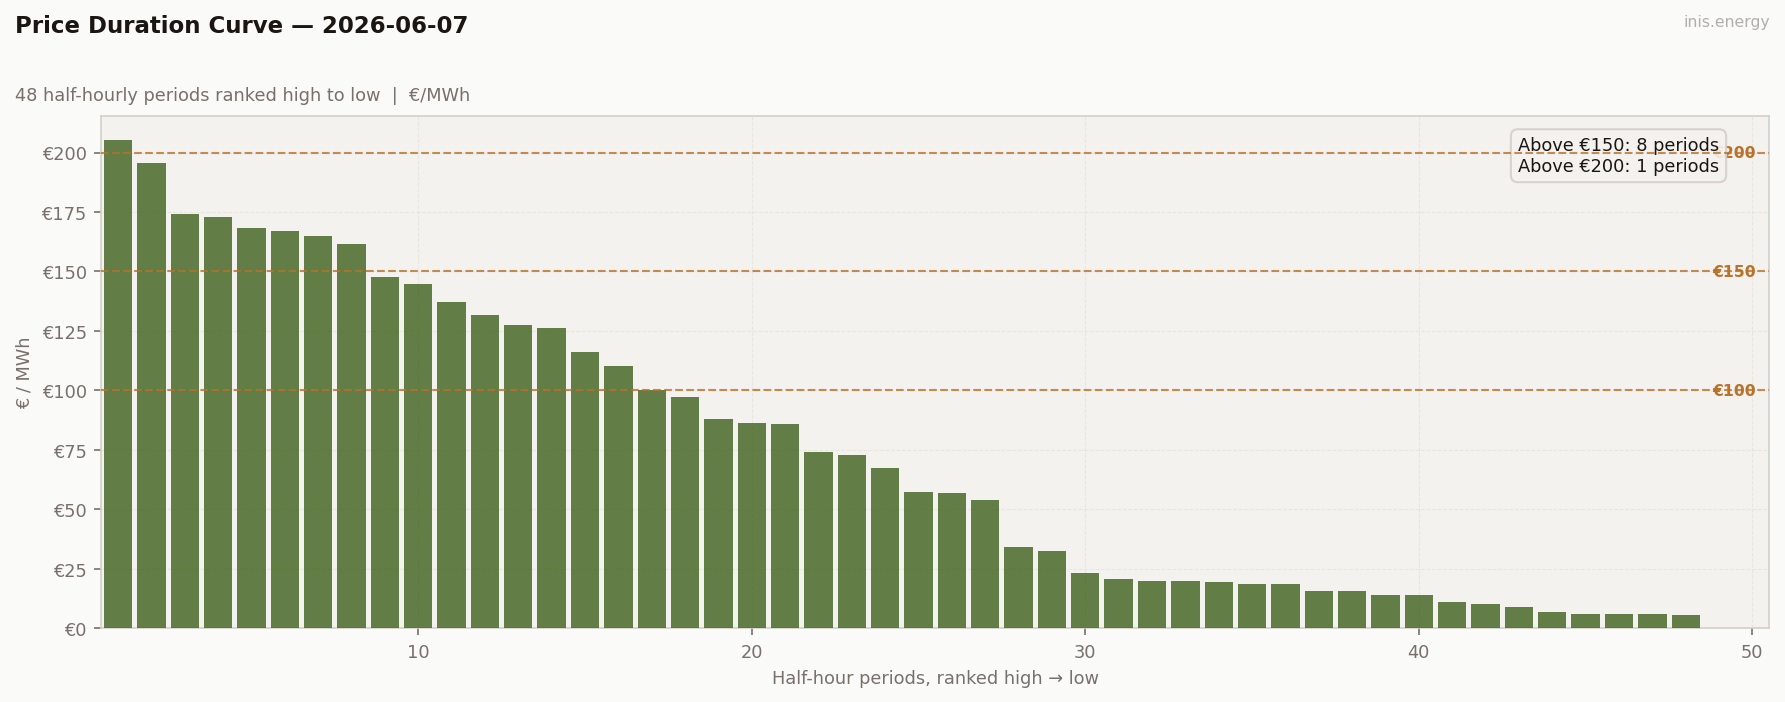
Periods above €150: 8 (17% of day) · Above €200: 1 (2% of day)
8 above €150, 1 above €200. But also: 22 periods below €25. The PDC is bimodal — a sharp scarcity top (8 periods cluster €127–205) and a deep flat surplus floor (22 periods cluster €5–25), with very little in between.
A real-world example of a “scarcity day” PDC and a “surplus day” PDC on the same chart. Two distributions stuck together by the day boundary.
Peak / Off-Peak Spread #
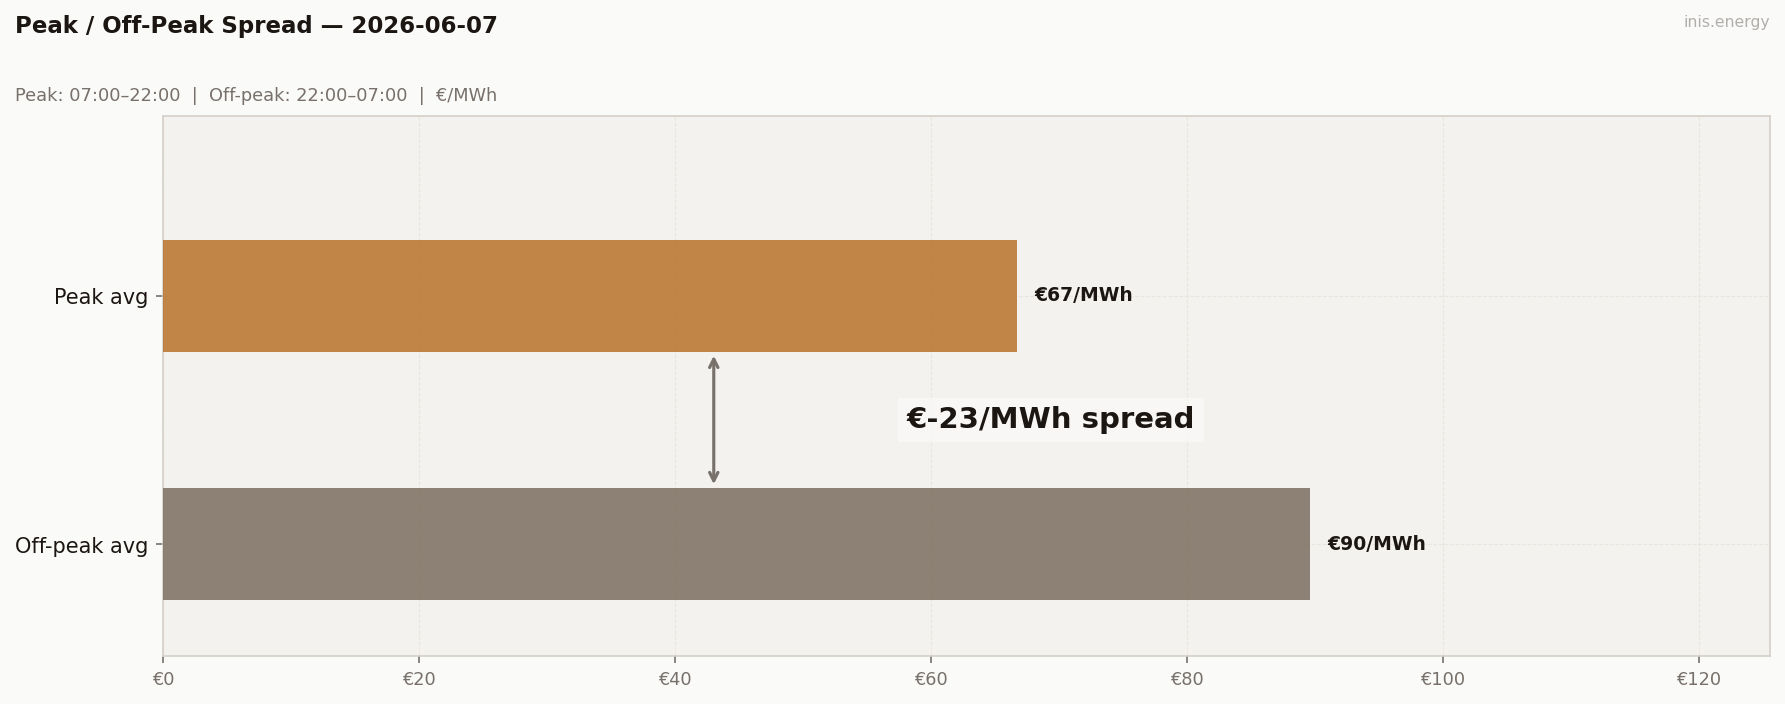
Peak avg (07:00–22:00): €66.73/MWh · Off-peak avg: €89.64/MWh · Spread: €-22.91/MWh
−€22.91. The new most-negative reading of the run.
Peak avg €66.73 (the peak window is dominated by surplus hours), off-peak avg €89.64 (the boundary spillover at the start and the scarcity buildup at the end lift it). The metric is reading the day backwards — and the captured spread (€180) is eight times the absolute value of the headline.
If a metric tells you the day is calm and inverted while a BESS earned an exceptional gross on it, the metric is wrong. Worth a stronger dashboard caveat: peak/off-peak averaging fails on bimodal days entirely.
BESS Dispatch Signal #
| Price | Time | Energy | Value | |
|---|---|---|---|---|
| Charge | €6/MWh | 07:00 | 2 MWh | −€12 |
| Discharge | €186/MWh | 21:00 | 1.7 MWh (85% RTE) | +€315 |
| Gross profit | €304 | |||
| Price spread | €180/MWh | ROI: 2609.4% |
Simulated 1MW/2MWh battery, one optimal DAM cycle. Gross before network charges and capacity costs.
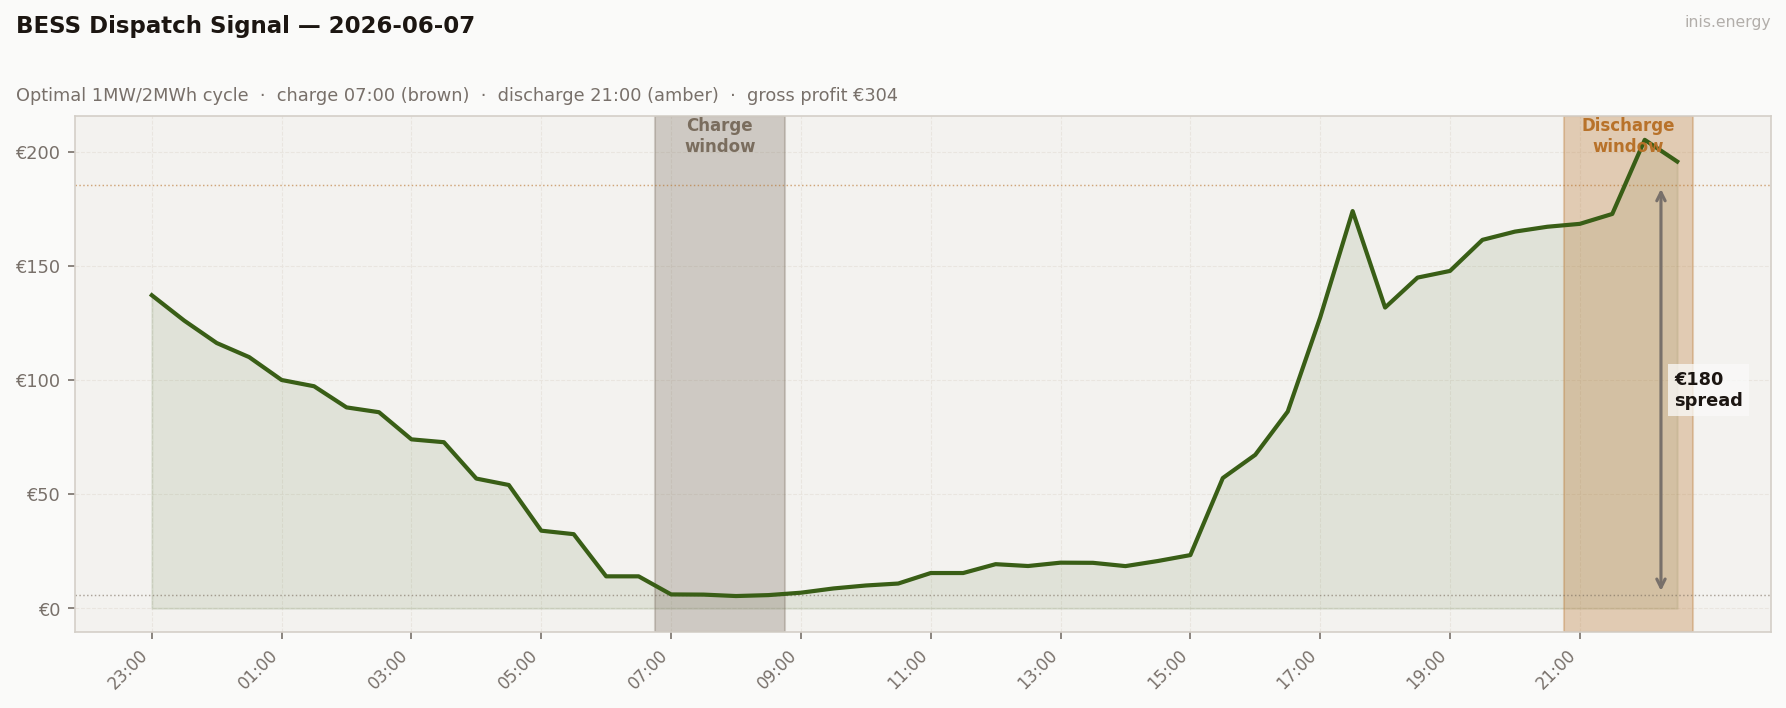
€304 gross. ROI 2,609%.
Charge €6 in the morning surplus (07:00–08:30 at €5.82 avg). Discharge €186 in the late-evening scarcity (21:00–22:30 at €185.6 avg). Captured spread €180.
The single best argument for BESS in the data so far. One day, one cycle, €304. Three weeks of mid-range working-day BESS revenue earned on a single Sunday’s wind-shape variance.
Commentary #
The day BESS forecasters dream about. Range €199.82 — the biggest of the run by €81. Std dev €63.17 — over twice any previous day. Min €5.38 at 08:00 (curtailment territory). Peak €205 at 22:00 (peaker bids). Captured spread €180. Gross €304 on a single 1MW/2MWh cycle.
The structural cause: a wind shape that delivered both extremes. 14 hours of wind above 50% on a Sunday with weekend demand kept the merit order in surplus territory all morning — and the marginal plant pushed clearing prices down to €5 to keep wind from hitting constraint payment. Then wind drained from 50% to 29% across the afternoon and evening, demand built into the peak hours, and the merit order climbed into peakers.
Same mechanism as June 2’s post-holiday scarcity — wind drainage into demand peak. The difference is what came before: today’s charge was free because of 14 hours of pre-peak surplus. June 2 charged at €114. Today charged at €6. That’s the entire €158 of additional gross BESS revenue.
Five days of working-week BESS revenue earned in a single Sunday cycle. Whatever forecast cost a real operator pays to identify this kind of day, it’s worth multiples of what they’d lose on a normal day. The volatility tail isn’t a tail — it’s the business.
Half-hourly data — 2026-06-07
| Period | Time | Price (€/MWh) | Wind % |
|---|---|---|---|
| 1 | 23:00 | 137.13 | 29.7% |
| 2 | 23:30 | 126.01 | 28.9% |
| 3 | 00:00 | 116.21 | 49.6% |
| 4 | 00:30 | 110.03 | 51.5% |
| 5 | 01:00 | 100.01 | 56.4% |
| 6 | 01:30 | 97.27 | 58.0% |
| 7 | 02:00 | 88.01 | 58.7% |
| 8 | 02:30 | 85.90 | 58.5% |
| 9 | 03:00 | 74.01 | 59.3% |
| 10 | 03:30 | 72.76 | 58.6% |
| 11 | 04:00 | 56.83 | 59.3% |
| 12 | 04:30 | 54.02 | 62.5% |
| 13 | 05:00 | 34.01 | 64.5% |
| 14 | 05:30 | 32.48 | 63.3% |
| 15 | 06:00 | 14.01 | 59.1% |
| 16 | 06:30 | 14.01 | 56.4% |
| 17 | 07:00 | 6.09 | 52.8% |
| 18 | 07:30 | 6.01 | 52.4% |
| 19 | 08:00 | 5.38 | 49.0% |
| 20 | 08:30 | 5.79 | 45.5% |
| 21 | 09:00 | 6.84 | 44.7% |
| 22 | 09:30 | 8.70 | 45.6% |
| 23 | 10:00 | 10.00 | 47.5% |
| 24 | 10:30 | 10.86 | 46.8% |
| 25 | 11:00 | 15.46 | 42.2% |
| 26 | 11:30 | 15.46 | 39.1% |
| 27 | 12:00 | 19.34 | 36.1% |
| 28 | 12:30 | 18.53 | 34.5% |
| 29 | 13:00 | 20.00 | 33.6% |
| 30 | 13:30 | 19.93 | 33.0% |
| 31 | 14:00 | 18.49 | 32.0% |
| 32 | 14:30 | 20.73 | 31.2% |
| 33 | 15:00 | 23.32 | 30.8% |
| 34 | 15:30 | 57.07 | 30.2% |
| 35 | 16:00 | 67.24 | 31.2% |
| 36 | 16:30 | 86.19 | 32.4% |
| 37 | 17:00 | 127.40 | 33.2% |
| 38 | 17:30 | 174.00 | 33.6% |
| 39 | 18:00 | 131.73 | 36.8% |
| 40 | 18:30 | 144.86 | 34.8% |
| 41 | 19:00 | 147.78 | 33.2% |
| 42 | 19:30 | 161.39 | 32.0% |
| 43 | 20:00 | 165.00 | 33.5% |
| 44 | 20:30 | 167.13 | 31.3% |
| 45 | 21:00 | 168.40 | 29.7% |
| 46 | 21:30 | 172.74 | 31.4% |
| 47 | 22:00 | 205.20 | 30.9% |
| 48 | 22:30 | 195.70 | 28.9% |
Compare your business electricity and gas rates in minutes with INIS Energy Brokers.
Compare rates