I-SEM Daily Briefing — 8 June 2026
Table of Contents
Market Snapshot
| Metric | Value |
|---|---|
| Mean DAM Price | €137.1/MWh |
| Median Price | €134.99/MWh |
| Std Dev | €18.14/MWh |
| Peak Price | €167.82/MWh (07:30) |
| Min Price | €104.3/MWh (14:30) |
| Price Range | €63.52/MWh |
| Periods above €150 | 15 of 48 (31%) |
| Periods above €200 | 0 of 48 (0%) |
| Peak Avg (07–22) | €137.02/MWh |
| Off-peak Avg (22–07) | €137.23/MWh |
| Peak/Off-Peak Spread | €-0.21/MWh |
| Wind % of Demand | 39.7% |
| Wind Range | 23.4%–54.9% |
| Mean Demand | 3682 MW |
Price Profile #
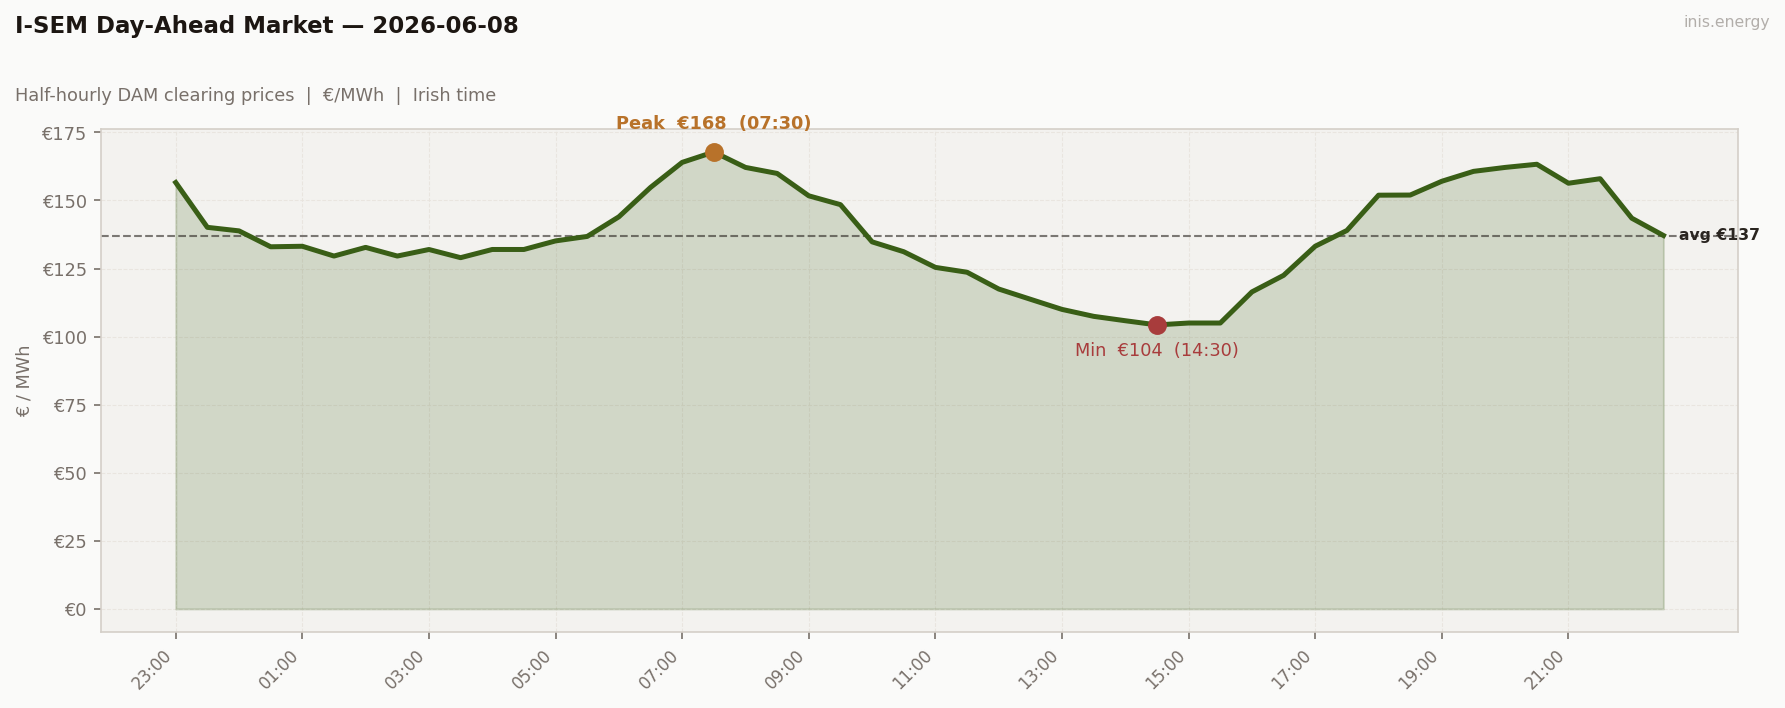
Std dev €18.14/MWh · Median €134.99/MWh · Periods above €150: 15 of 48 (31%)
Reset Monday. Mean €137.10, peak €167.82 at 07:30, no scarcity. After yesterday’s outlier, the market settled into a contained working-day shape.
Morning ramp climbed €144 at 06:00 → €168 at 07:30 — a modest 24-euro climb. Midday softened to €104 at 14:30 (the trough), then the evening rebuilt to €163 at 20:30, holding €157–163 from 19:00 to 21:30.
15 periods above €150 — sustained elevated prices through both peaks — but zero above €200.
Price vs Wind #
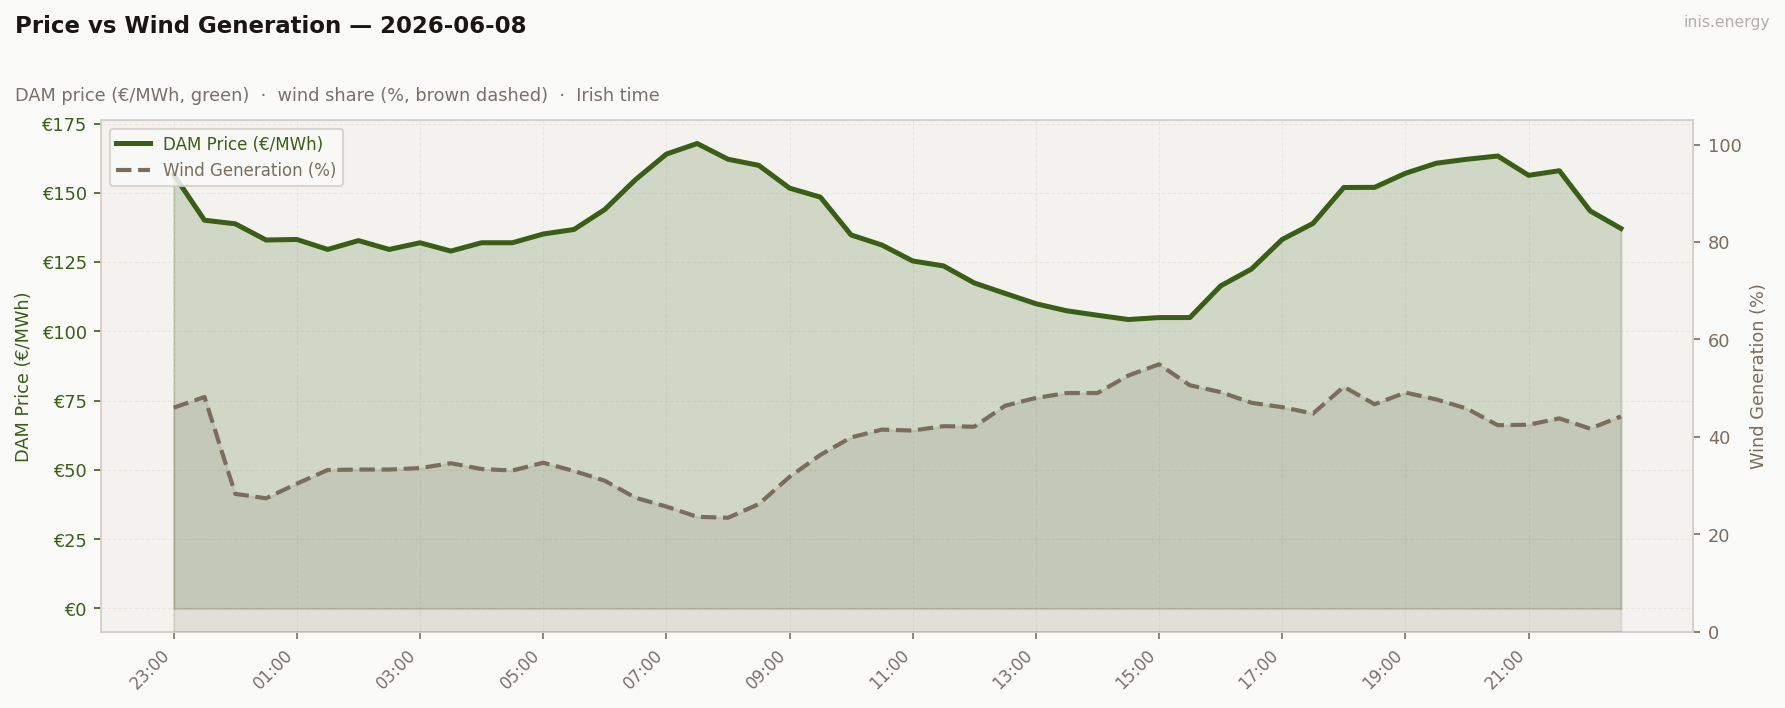
Mean wind: 39.7% · Range: 23.4%–54.9%
Wind drained 48% at 23:30 → 23% at 08:00 — a sharp morning shortfall, but contained because wind recovered through midday (40-55% from 11:00 to 18:00) and held high through evening (42-50%).
The wind shape is V-out-of-evening — wind drained into morning, recovered for the rest of the day. Same archetype as May 21’s flat working day. Modest morning peak, contained evening peak, deep midday trough.
Week in Context #
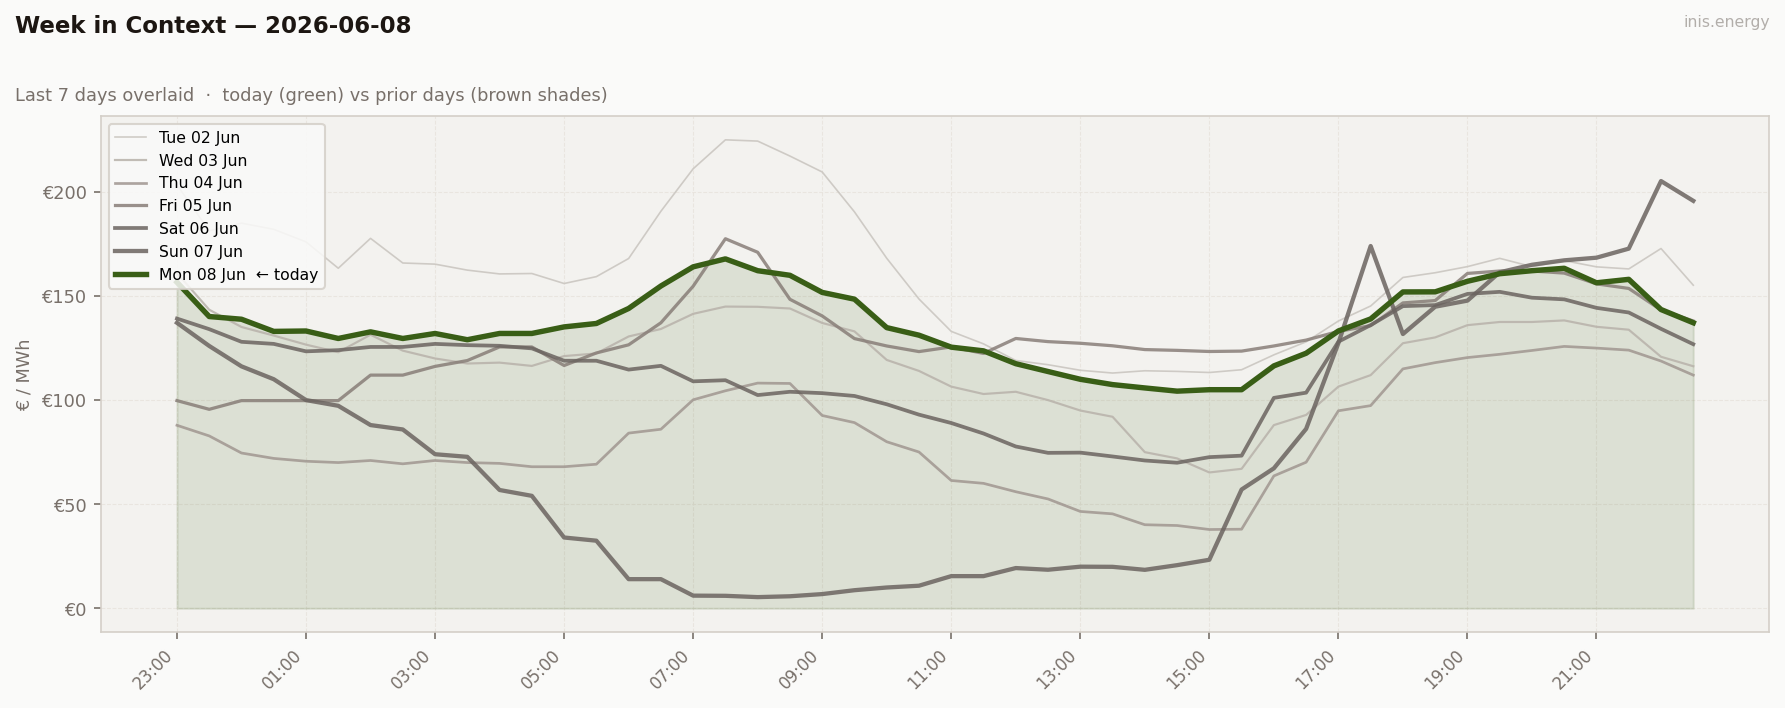
The series is mean-reverting fast. June 7 €75 mean → June 8 €137 mean. Wind shape doing all the work.
Price Duration Curve #
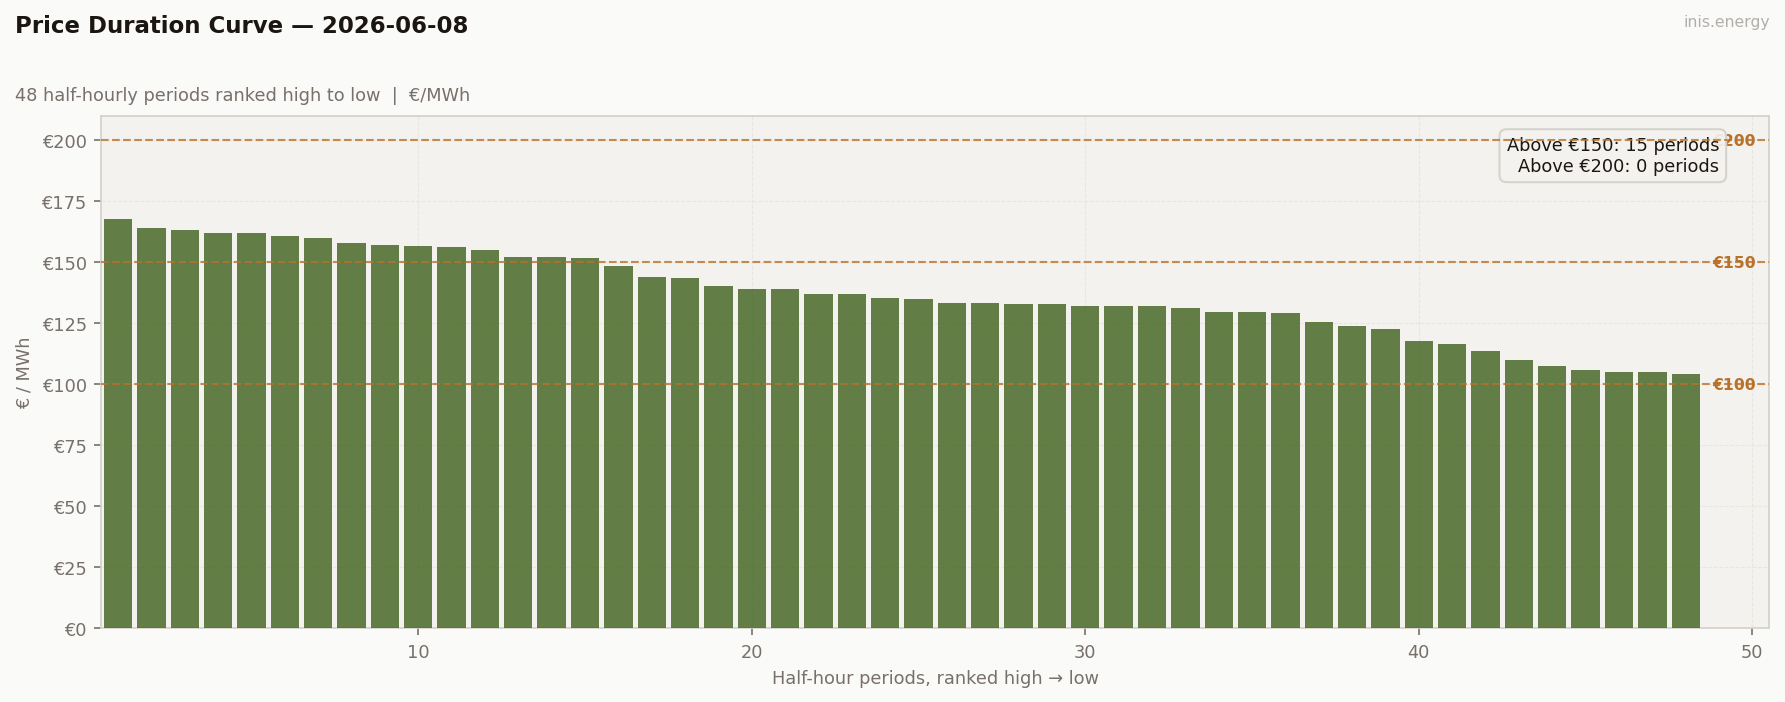
Periods above €150: 15 (31% of day) · Above €200: 0 (0% of day)
15 above €150, 0 above €200. The shape is “broad shoulder” — long stretch in the €130–168 band across both peaks, modest midday cheap section, no scarcity spike.
Peak / Off-Peak Spread #
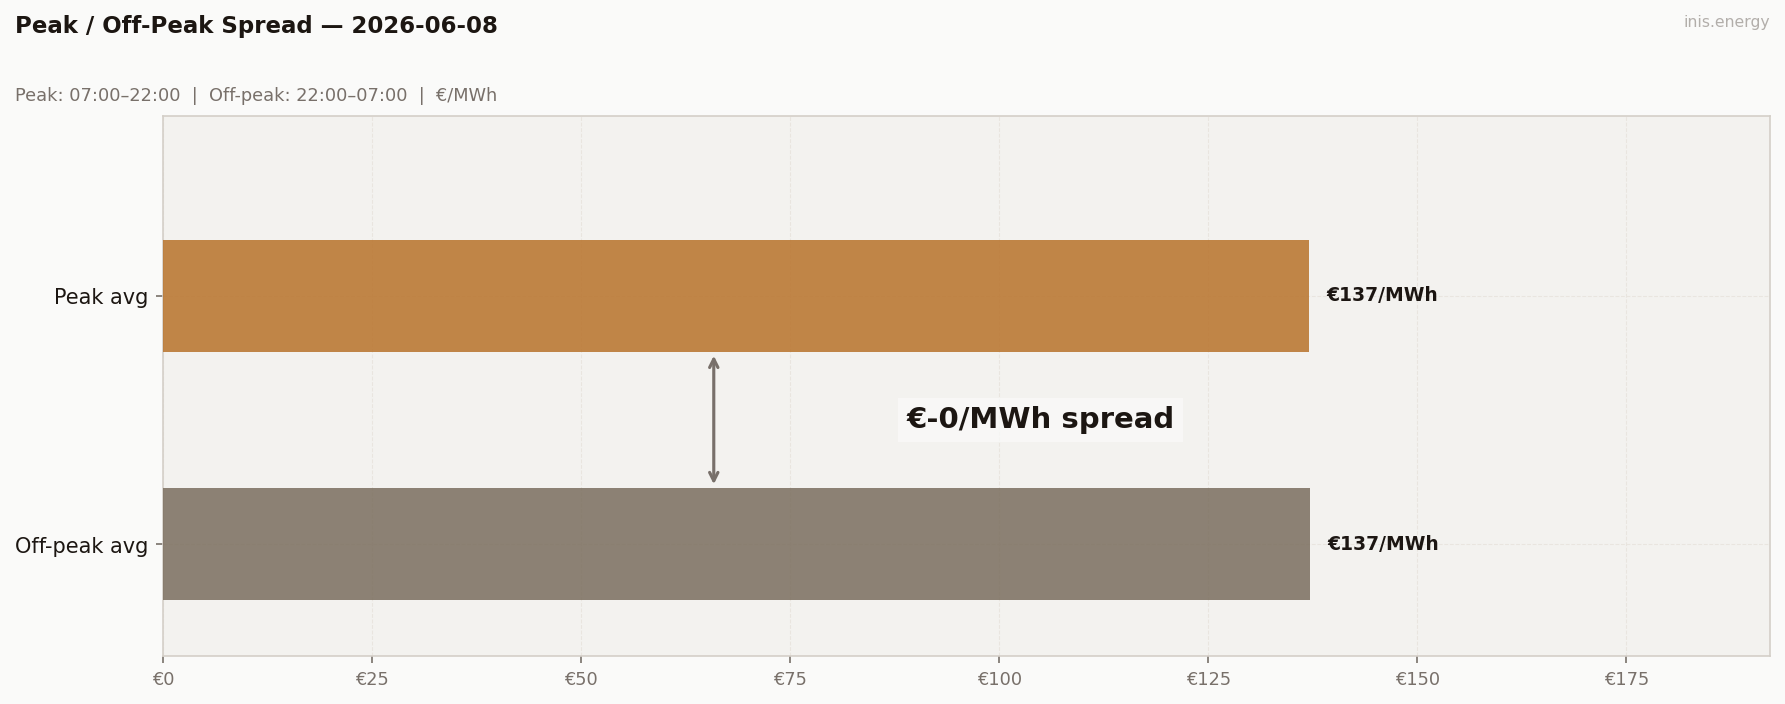
Peak avg (07:00–22:00): €137.02/MWh · Off-peak avg: €137.23/MWh · Spread: €-0.21/MWh
−€0.21. Essentially zero. Peak avg €137.02, off-peak avg €137.23.
The metric is reading the day as completely flat — peak and off-peak averaged within 0.2 euros of each other. The captured spread the BESS actually found was €58. The peak/off-peak metric continues to be unreliable on shaped working days.
BESS Dispatch Signal #
| Price | Time | Energy | Value | |
|---|---|---|---|---|
| Charge | €105/MWh | 14:00 | 2 MWh | −€210 |
| Discharge | €161/MWh | 19:00 | 1.7 MWh (85% RTE) | +€273 |
| Gross profit | €63 | |||
| Price spread | €56/MWh | ROI: 30.1% |
Updated 2026-08-27: the BESS simulation previously allowed the discharge window to occur before the charge window ended, which is physically impossible for a battery — in this case, by picking the 07:00–08:30 morning block, which falls before the 14:00 charge. Recalculated enforcing charge-before-discharge; gross profit corrected from €68 to €63.
Simulated 1MW/2MWh battery, one optimal DAM cycle. Gross before network charges and capacity costs.
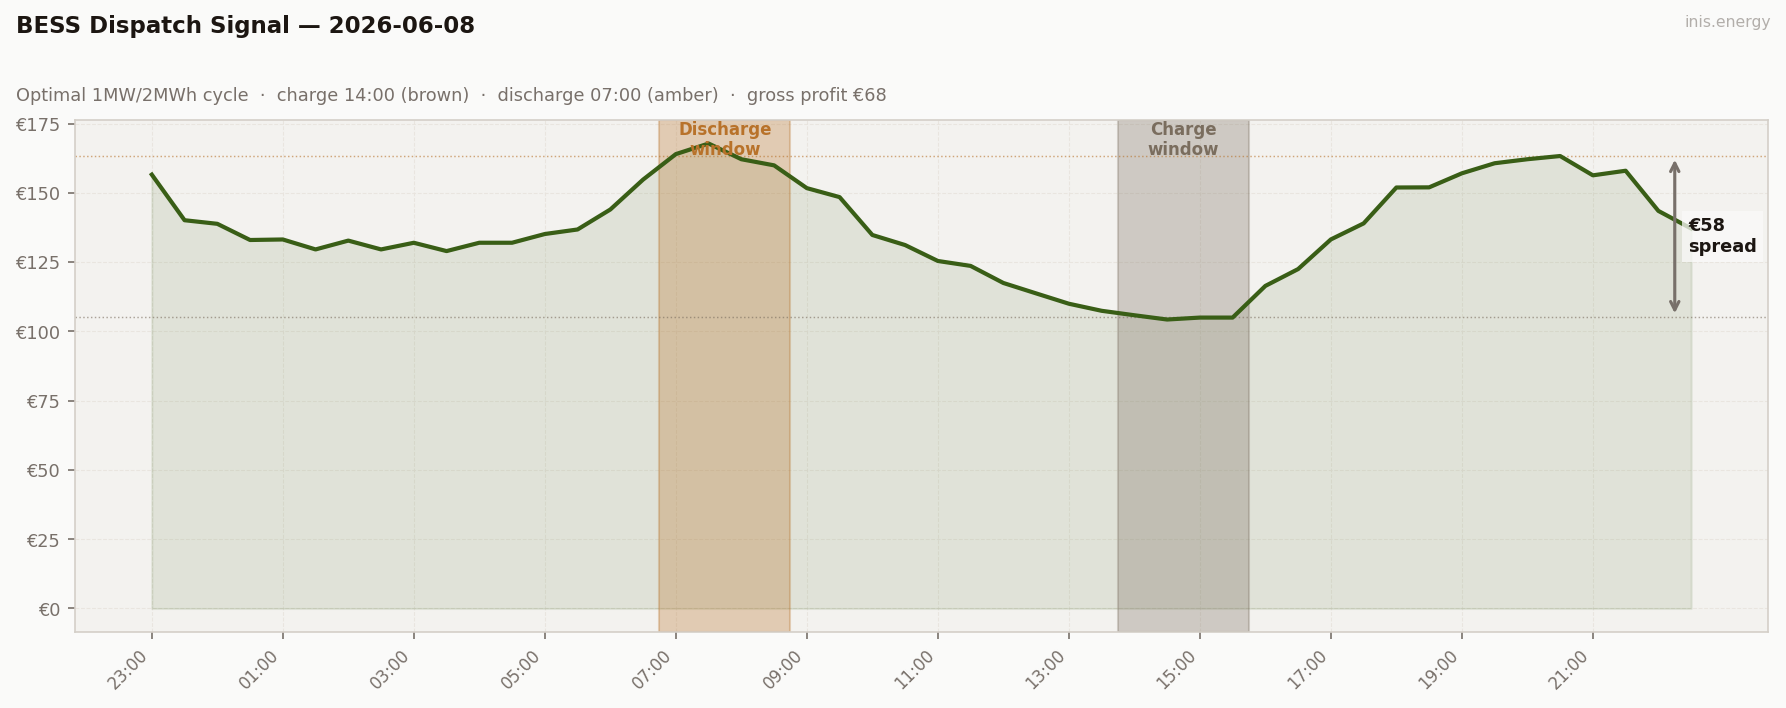
€63 gross. After yesterday’s €304, a reset to the working-day mid-range. The morning block (07:00–08:30, €163 avg) was actually the day’s highest-priced window, edging the evening block (19:00, €161 avg) by a couple of euros — but it falls before the 14:00 charge, so it’s out of reach for a same-day cycle. The evening block it actually discharges into is a close second, which is why the corrected number is still close to the original estimate.
Commentary #
Reset Monday after the outlier. Mean €137, modest morning peak €168, no scarcity. Wind drained 48% → 23% into the morning ramp, then recovered through the day and held high through evening. Same V-out-of-evening shape we’ve seen on May 21 and a few others.
BESS €63 — back to working-day mid-range after yesterday’s €304. The market’s own highest-priced window was the morning, but it happened before the charge, so the battery discharged into the close-second evening block instead.
Half-hourly data — 2026-06-08
| Period | Time | Price (€/MWh) | Wind % |
|---|---|---|---|
| 1 | 23:00 | 156.60 | 46.0% |
| 2 | 23:30 | 140.14 | 48.2% |
| 3 | 00:00 | 138.84 | 28.3% |
| 4 | 00:30 | 133.00 | 27.4% |
| 5 | 01:00 | 133.19 | 30.4% |
| 6 | 01:30 | 129.60 | 33.2% |
| 7 | 02:00 | 132.78 | 33.3% |
| 8 | 02:30 | 129.60 | 33.3% |
| 9 | 03:00 | 132.00 | 33.6% |
| 10 | 03:30 | 129.00 | 34.6% |
| 11 | 04:00 | 132.01 | 33.4% |
| 12 | 04:30 | 132.01 | 33.1% |
| 13 | 05:00 | 135.16 | 34.7% |
| 14 | 05:30 | 136.80 | 33.0% |
| 15 | 06:00 | 144.01 | 31.0% |
| 16 | 06:30 | 154.80 | 27.5% |
| 17 | 07:00 | 164.00 | 25.7% |
| 18 | 07:30 | 167.82 | 23.6% |
| 19 | 08:00 | 162.15 | 23.4% |
| 20 | 08:30 | 159.94 | 26.2% |
| 21 | 09:00 | 151.72 | 31.8% |
| 22 | 09:30 | 148.48 | 36.3% |
| 23 | 10:00 | 134.81 | 39.9% |
| 24 | 10:30 | 131.18 | 41.5% |
| 25 | 11:00 | 125.43 | 41.3% |
| 26 | 11:30 | 123.65 | 42.2% |
| 27 | 12:00 | 117.49 | 42.1% |
| 28 | 12:30 | 113.73 | 46.4% |
| 29 | 13:00 | 110.00 | 48.0% |
| 30 | 13:30 | 107.45 | 49.0% |
| 31 | 14:00 | 105.84 | 49.0% |
| 32 | 14:30 | 104.30 | 52.6% |
| 33 | 15:00 | 105.00 | 54.9% |
| 34 | 15:30 | 105.00 | 50.6% |
| 35 | 16:00 | 116.43 | 49.2% |
| 36 | 16:30 | 122.51 | 47.0% |
| 37 | 17:00 | 133.21 | 46.1% |
| 38 | 17:30 | 138.99 | 44.8% |
| 39 | 18:00 | 151.95 | 50.3% |
| 40 | 18:30 | 152.00 | 46.7% |
| 41 | 19:00 | 157.07 | 49.1% |
| 42 | 19:30 | 160.70 | 47.7% |
| 43 | 20:00 | 162.15 | 45.8% |
| 44 | 20:30 | 163.31 | 42.4% |
| 45 | 21:00 | 156.34 | 42.5% |
| 46 | 21:30 | 158.00 | 43.8% |
| 47 | 22:00 | 143.50 | 41.7% |
| 48 | 22:30 | 137.15 | 44.2% |
Compare your business electricity and gas rates in minutes with INIS Energy Brokers.
Compare rates