I-SEM Daily Briefing — 9 June 2026
Table of Contents
Market Snapshot
| Metric | Value |
|---|---|
| Mean DAM Price | €128.11/MWh |
| Median Price | €122.86/MWh |
| Std Dev | €35.66/MWh |
| Peak Price | €230.4/MWh (22:00) |
| Min Price | €83.59/MWh (14:30) |
| Price Range | €146.81/MWh |
| Periods above €150 | 8 of 48 (17%) |
| Periods above €200 | 4 of 48 (8%) |
| Peak Avg (07–22) | €124.5/MWh |
| Off-peak Avg (22–07) | €134.13/MWh |
| Peak/Off-Peak Spread | €-9.63/MWh |
| Wind % of Demand | 47.8% |
| Wind Range | 18.6%–63.4% |
| Mean Demand | 3681 MW |
Price Profile #
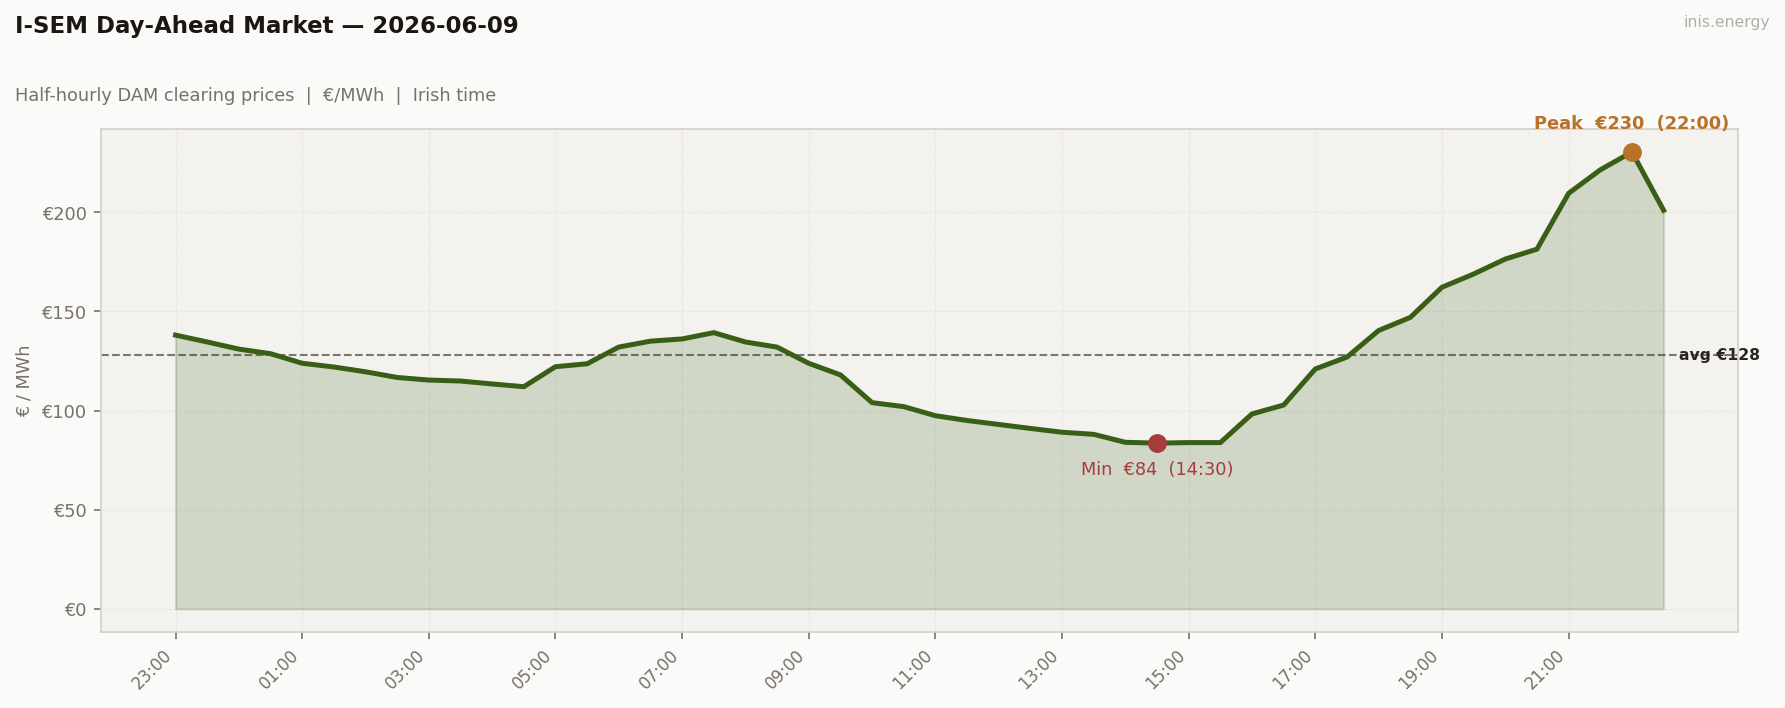
Std dev €35.66/MWh · Median €122.86/MWh · Periods above €150: 8 of 48 (17%)
Yesterday’s quiet replaced by another late-evening scarcity event. Mean €128.11, peak €230.40 at 22:00, range €146.81 (second-widest of the run after June 7). Four periods above €200, all in the late evening.
The shape: a smooth day-internal descent from the boundary spillover (€138 at 23:00) through overnight (€112–123 from 03:00 to 06:30, wind 56-63%) into a gentle morning shoulder topping at €139 at 07:30. Then a long descending midday belly: €124 at 09:00 → €104 at 10:00 → €83.59 at 14:30. Sustained €84–98 from 14:00 to 16:30 (wind 50-53%).
Then the climb: €98 at 16:00 → €176 at 20:00 → €230 at 22:00. Wind drained from 52% to 19% across that 6-hour window. The late-evening peak block (21:00–22:30) averaged €216.
Price vs Wind #
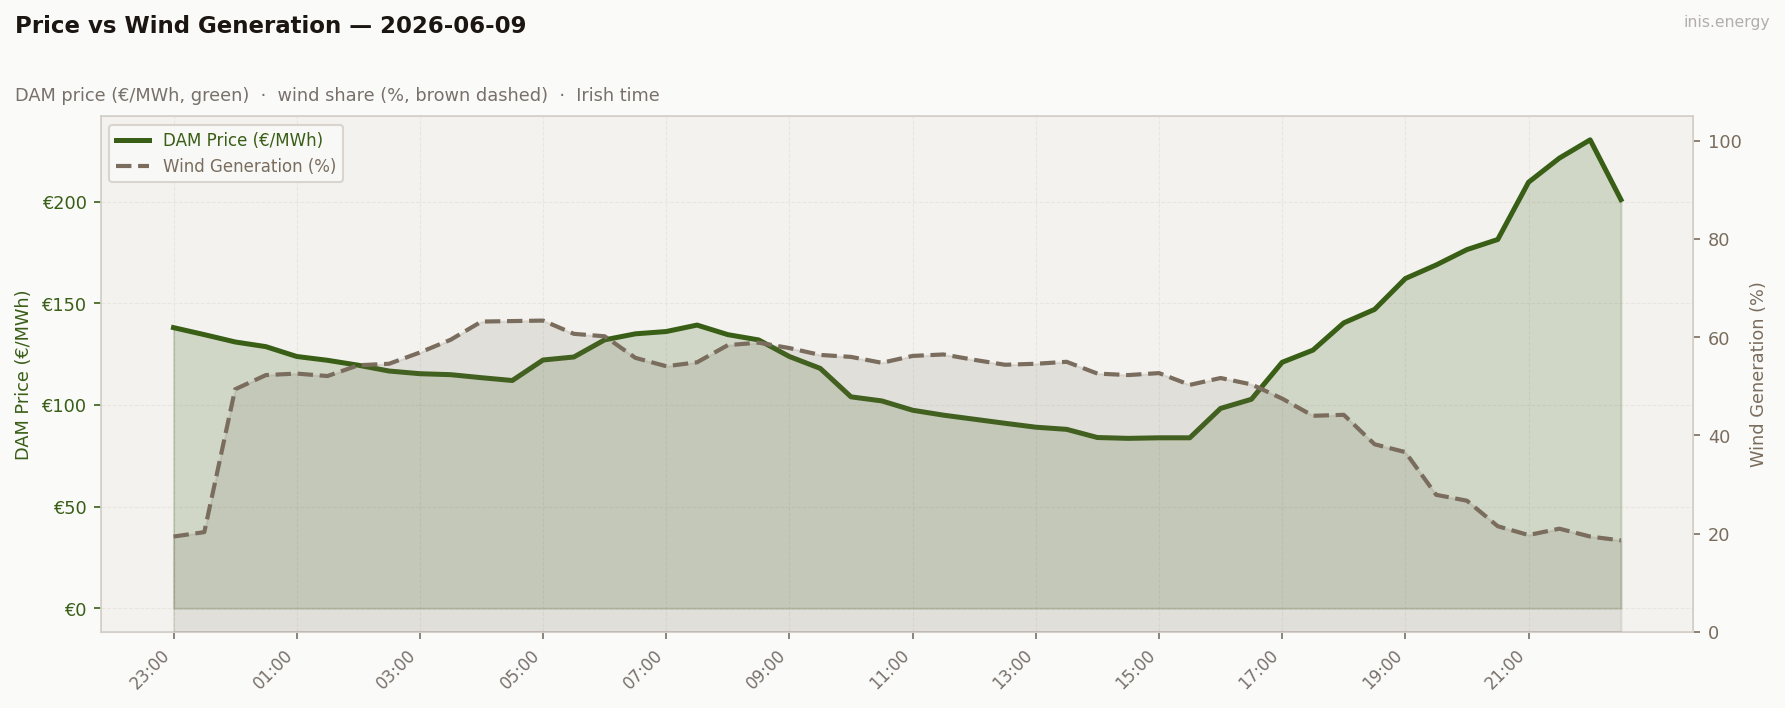
Mean wind: 47.8% · Range: 18.6%–63.4%
Same shape as June 7 but slightly less extreme. Wind held 50%+ from 23:30 the night before to 17:30 today — 18 hours of sustained high wind. Then drained: 44% at 17:30 → 28% at 19:30 → 22% at 20:30 → 19% at 21:00 onwards. 33-point wind decline across 4 hours.
The late-evening scarcity isn’t about absolute wind level (19% has produced €255 elsewhere); it’s about the rate of decline combined with how demand stays elevated late into a Tuesday evening. A V-into-late-evening day with steeper-than-average wind drainage and gentler-than-average demand decline. The merit order had time to walk into peakers and not enough downward demand pressure to pull it back.
Week in Context #
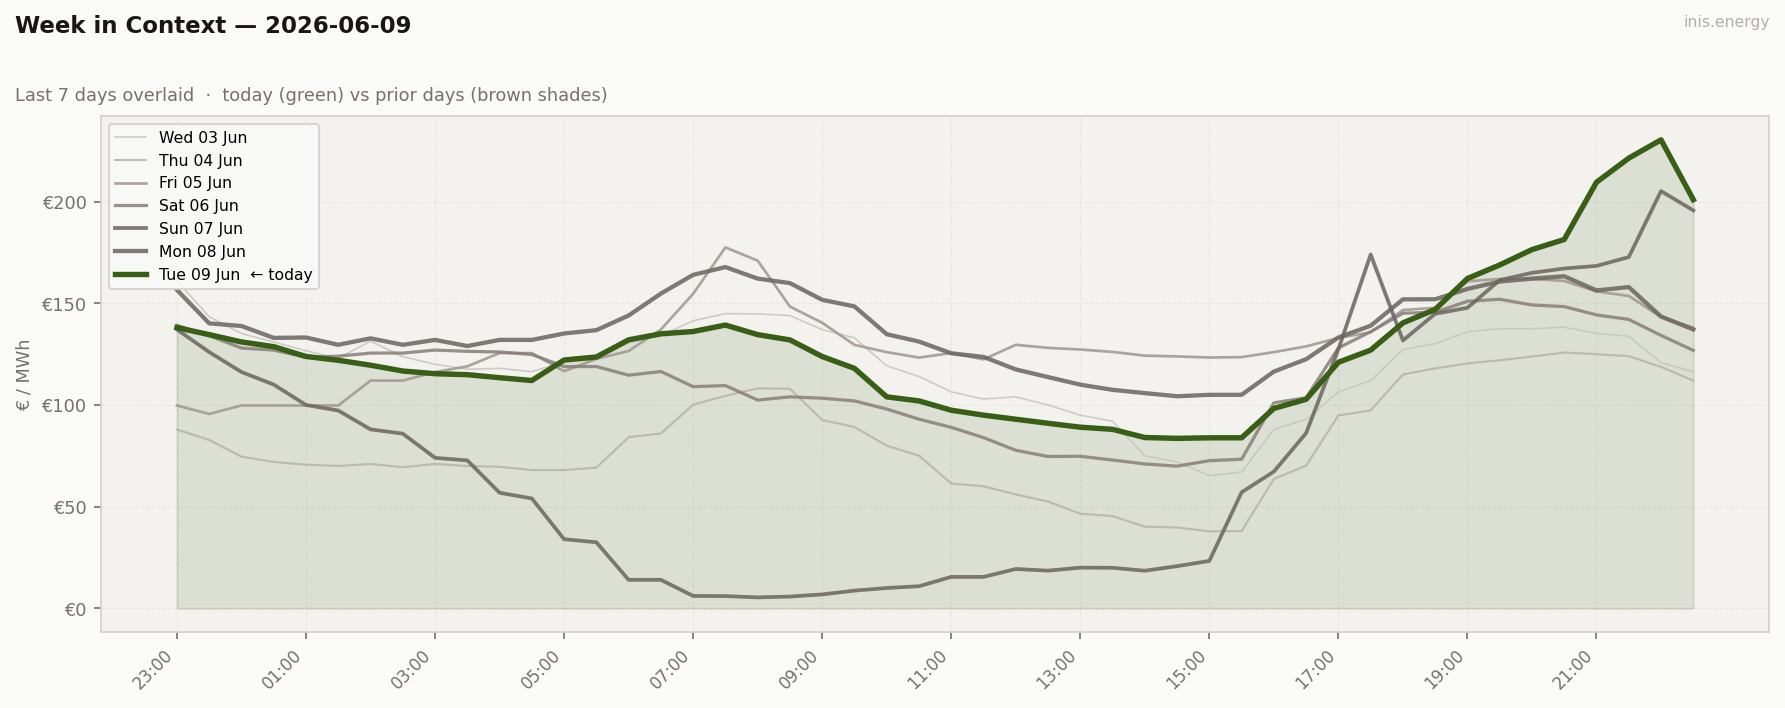
Two V-into-late-evening days in three: June 7 and June 9. Combined BESS revenue €503 across the two days. The wind-shape lesson at its sharpest.
Price Duration Curve #
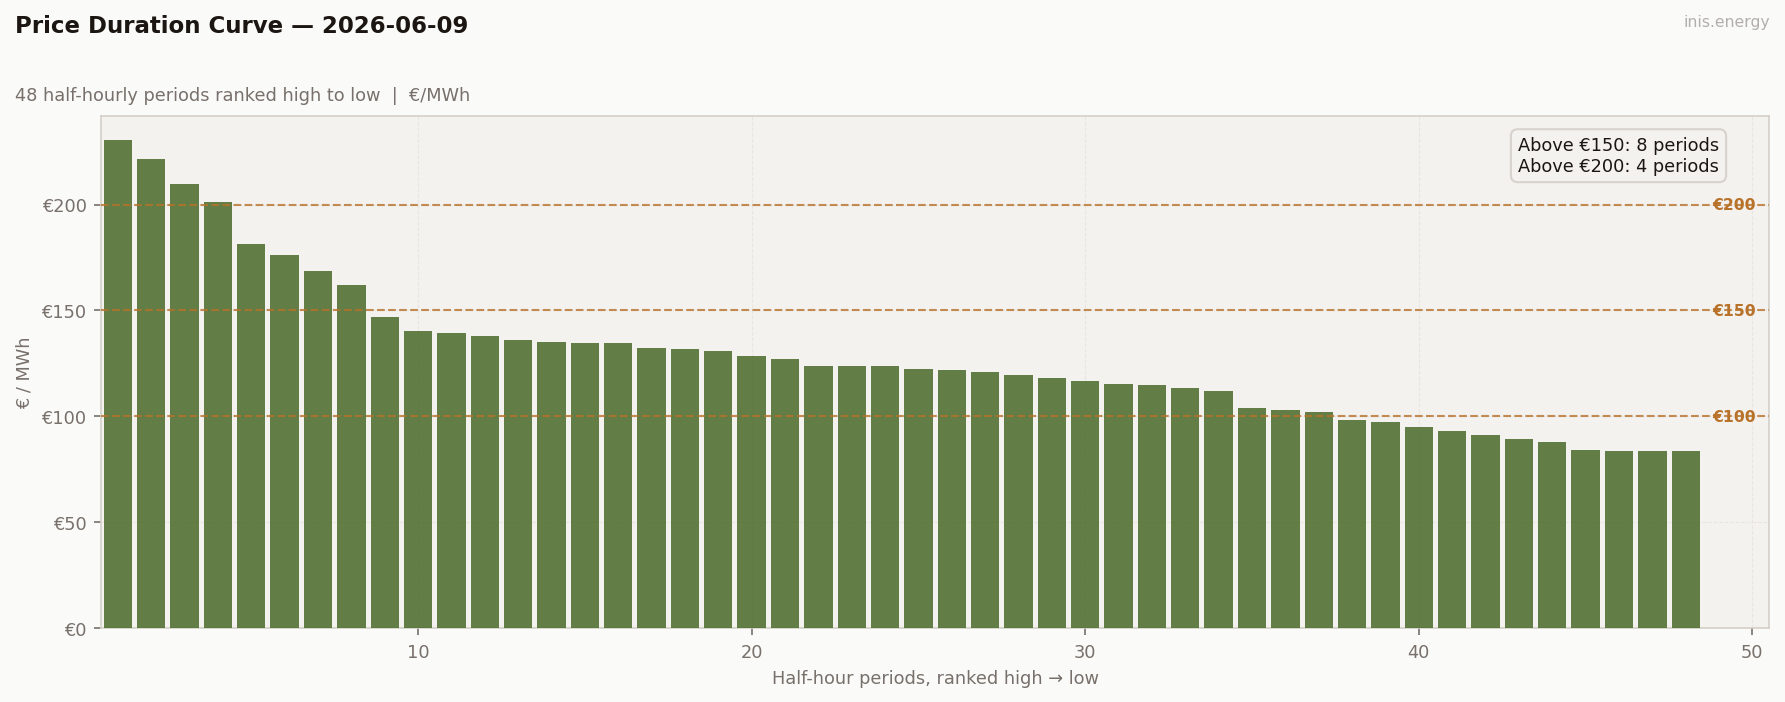
Periods above €150: 8 (17% of day) · Above €200: 4 (8% of day)
8 above €150, 4 above €200. The PDC has a clear scarcity top (4 periods €209–230) plus a moderate upper shelf (4 more periods €151–181) plus a long mid-section, plus a meaningful cheap tail (10 periods below €110).
The shape resembles May 24’s “double-shoulder” archetype — both ends working — except today’s scarcity top is sharper and concentrated in 4 consecutive late-evening periods.
Peak / Off-Peak Spread #
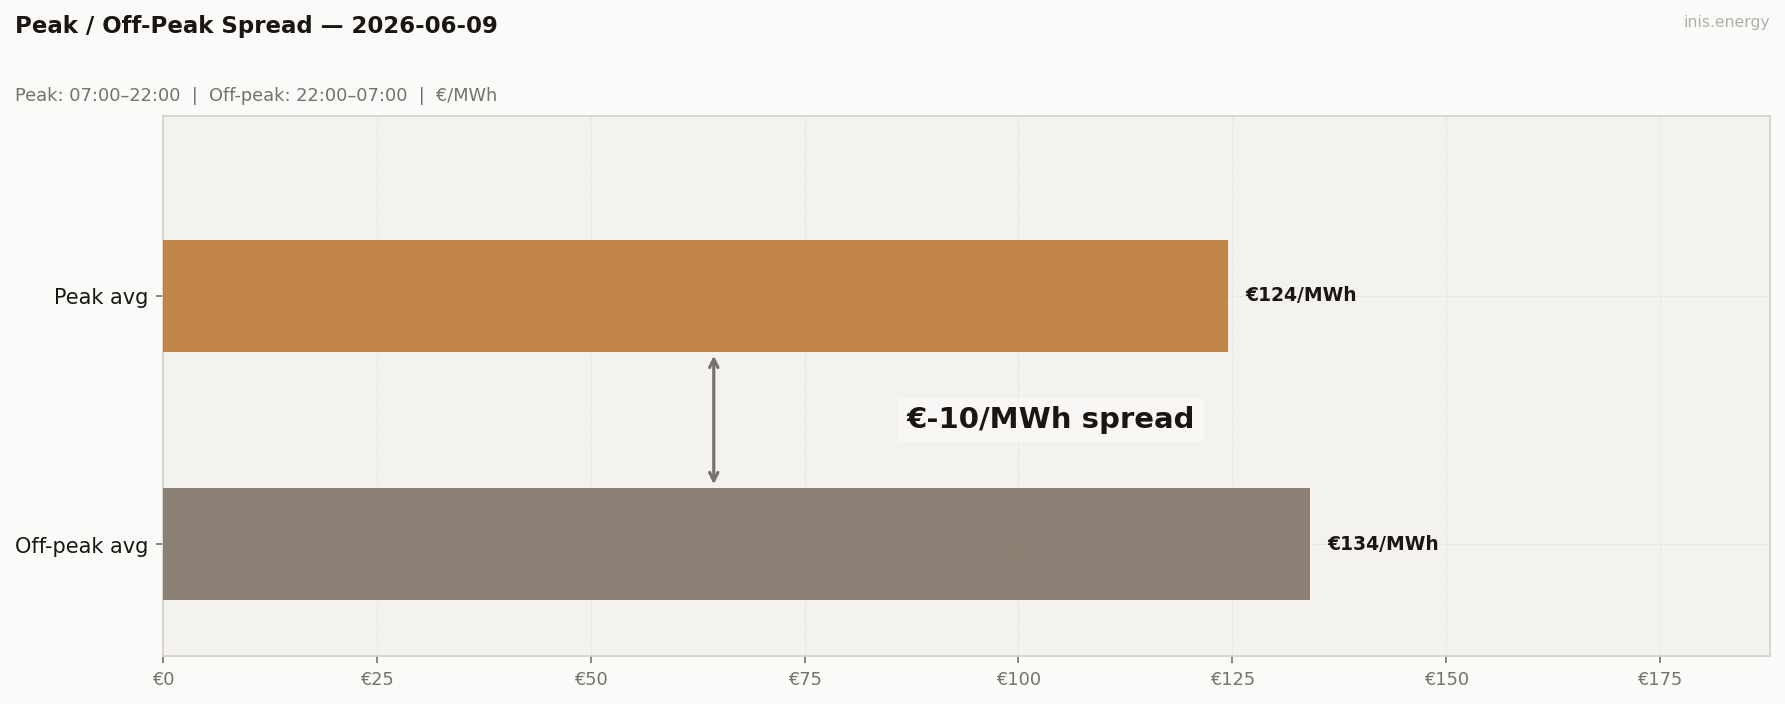
Peak avg (07:00–22:00): €124.5/MWh · Off-peak avg: €134.13/MWh · Spread: €-9.63/MWh
−€9.63. Seventh negative reading.
Off-peak window catches scarcity spillover from June 8 and from late tonight (the €230 peak sits in the peak window, but the late-evening tail above €200 spills into period 47 which is inside the peak window — and the off-peak window catches the high overnight floor). Either way, the metric inverts.
The captured spread (€132) is 14× the absolute value of the headline. The peak/off-peak metric has now misrepresented the day on 7 of 38 days — 18%. Not a one-off failure; structural.
BESS Dispatch Signal #
| Price | Time | Energy | Value | |
|---|---|---|---|---|
| Charge | €84/MWh | 14:00 | 2 MWh | −€168 |
| Discharge | €216/MWh | 21:00 | 1.7 MWh (85% RTE) | +€366 |
| Gross profit | €199 | |||
| Price spread | €132/MWh | ROI: 118.6% |
Simulated 1MW/2MWh battery, one optimal DAM cycle. Gross before network charges and capacity costs.
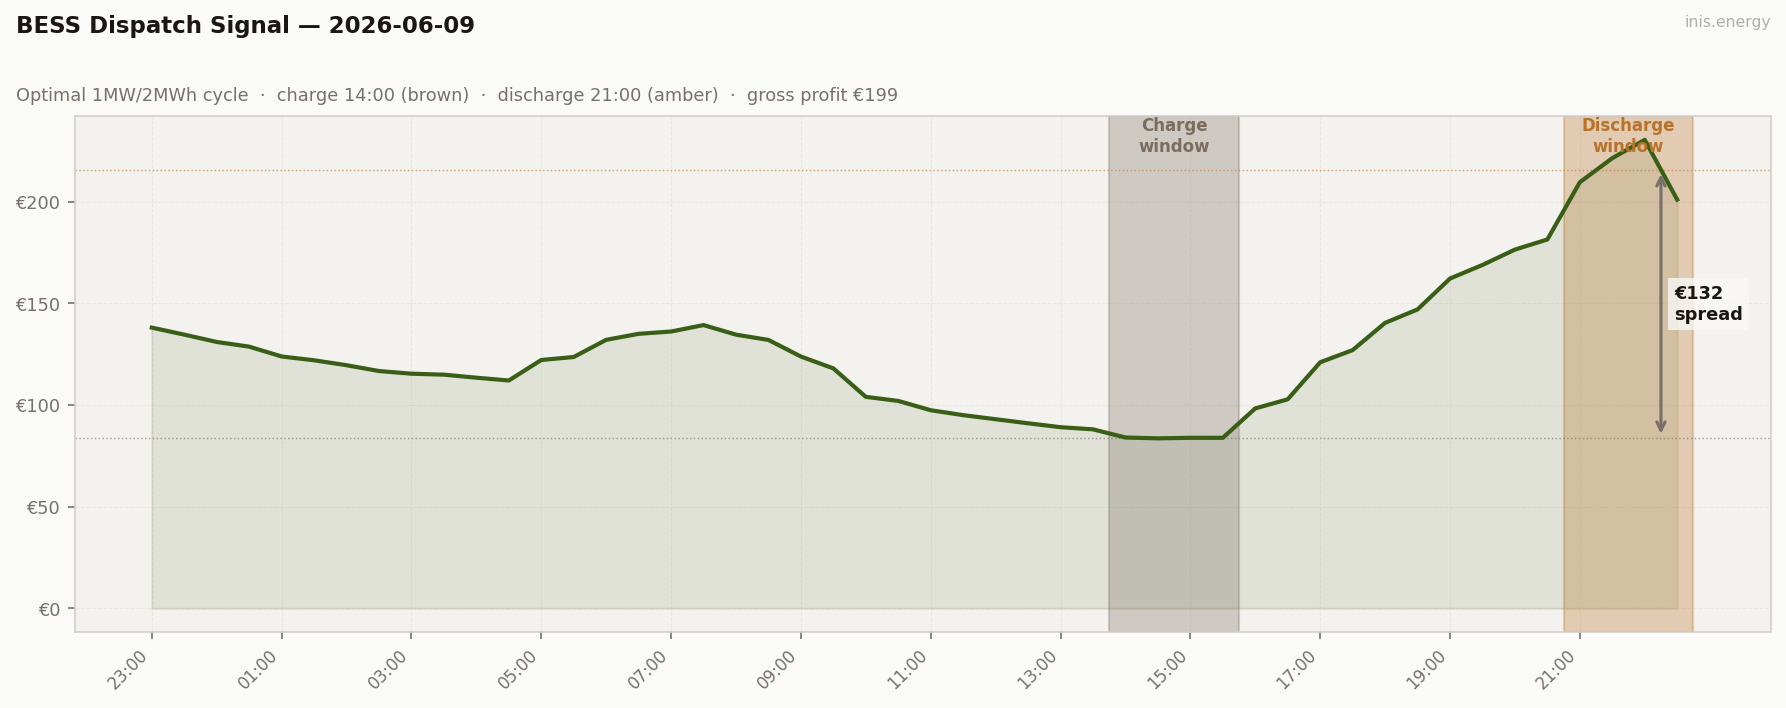
€199 gross — a strong day, second only to June 7’s €304 among comparable scarcity events.
Charge €84 in the wind-deep midday trough (14:00–15:30 at €84 avg). Discharge €216 in the late-evening scarcity block (21:00–22:30 at €216 avg). Captured spread €132.
The €199 is what a “normal” BESS day looks like when the wind shape delivers both ends — without the €5 charge that made June 7 unique. The wind-shape lesson now has two demonstrations in three days.
Commentary #
Another late-evening scarcity event, two days after the last one. Wind held 50%+ for 18 hours then drained from 52% to 19% across the late evening. The merit order climbed into peakers and the day cleared €209–230 across the 21:00–22:30 block.
BESS €199. Charge €84 midday, discharge €216 late evening, captured spread €132. That’s a “normal-charge” version of the June 7 trade — without the €5 charge anomaly, but with a wider discharge window.
June 4 broke the trough record, June 7 produced the week’s biggest BESS gross (€304) by combining a deep trough with a scarcity peak, and June 9 confirms the same pattern at €199. The same wind shape — high wind holding for 14–18 hours, then sharp drainage into a late demand peak — produced both days. Whatever weather setup creates that pattern, it’s worth knowing the forecast for. Forecast that pattern and you’ve got the year.
Half-hourly data — 2026-06-09
| Period | Time | Price (€/MWh) | Wind % |
|---|---|---|---|
| 1 | 23:00 | 138.05 | 19.4% |
| 2 | 23:30 | 134.60 | 20.3% |
| 3 | 00:00 | 131.00 | 49.4% |
| 4 | 00:30 | 128.69 | 52.3% |
| 5 | 01:00 | 123.86 | 52.6% |
| 6 | 01:30 | 121.98 | 52.1% |
| 7 | 02:00 | 119.56 | 54.3% |
| 8 | 02:30 | 116.70 | 54.6% |
| 9 | 03:00 | 115.39 | 56.9% |
| 10 | 03:30 | 114.91 | 59.5% |
| 11 | 04:00 | 113.42 | 63.2% |
| 12 | 04:30 | 112.04 | 63.3% |
| 13 | 05:00 | 122.13 | 63.4% |
| 14 | 05:30 | 123.60 | 60.7% |
| 15 | 06:00 | 132.04 | 60.2% |
| 16 | 06:30 | 135.00 | 55.8% |
| 17 | 07:00 | 136.13 | 54.1% |
| 18 | 07:30 | 139.30 | 54.9% |
| 19 | 08:00 | 134.59 | 58.4% |
| 20 | 08:30 | 132.00 | 58.9% |
| 21 | 09:00 | 123.83 | 57.8% |
| 22 | 09:30 | 118.00 | 56.4% |
| 23 | 10:00 | 104.00 | 56.0% |
| 24 | 10:30 | 102.00 | 54.8% |
| 25 | 11:00 | 97.42 | 56.2% |
| 26 | 11:30 | 95.00 | 56.5% |
| 27 | 12:00 | 93.00 | 55.4% |
| 28 | 12:30 | 91.00 | 54.4% |
| 29 | 13:00 | 89.08 | 54.6% |
| 30 | 13:30 | 88.02 | 55.0% |
| 31 | 14:00 | 84.00 | 52.6% |
| 32 | 14:30 | 83.59 | 52.3% |
| 33 | 15:00 | 83.86 | 52.7% |
| 34 | 15:30 | 83.86 | 50.3% |
| 35 | 16:00 | 98.32 | 51.7% |
| 36 | 16:30 | 102.80 | 50.4% |
| 37 | 17:00 | 121.00 | 47.5% |
| 38 | 17:30 | 126.99 | 44.0% |
| 39 | 18:00 | 140.38 | 44.2% |
| 40 | 18:30 | 147.00 | 38.2% |
| 41 | 19:00 | 162.19 | 36.6% |
| 42 | 19:30 | 168.86 | 27.9% |
| 43 | 20:00 | 176.42 | 26.7% |
| 44 | 20:30 | 181.39 | 21.5% |
| 45 | 21:00 | 209.55 | 19.7% |
| 46 | 21:30 | 221.39 | 21.0% |
| 47 | 22:00 | 230.40 | 19.4% |
| 48 | 22:30 | 201.00 | 18.6% |
Compare your business electricity and gas rates in minutes with INIS Energy Brokers.
Compare rates