I-SEM Daily Briefing — 10 June 2026
Table of Contents
Market Snapshot
| Metric | Value |
|---|---|
| Mean DAM Price | €149.96/MWh |
| Median Price | €140.14/MWh |
| Std Dev | €29.38/MWh |
| Peak Price | €222.21/MWh (22:00) |
| Min Price | €115.95/MWh (15:00) |
| Price Range | €106.26/MWh |
| Periods above €150 | 17 of 48 (35%) |
| Periods above €200 | 5 of 48 (10%) |
| Peak Avg (07–22) | €151.89/MWh |
| Off-peak Avg (22–07) | €146.74/MWh |
| Peak/Off-Peak Spread | €5.15/MWh |
| Wind % of Demand | 26.6% |
| Wind Range | 17.9%–39.9% |
| Mean Demand | 3790 MW |
Price Profile #
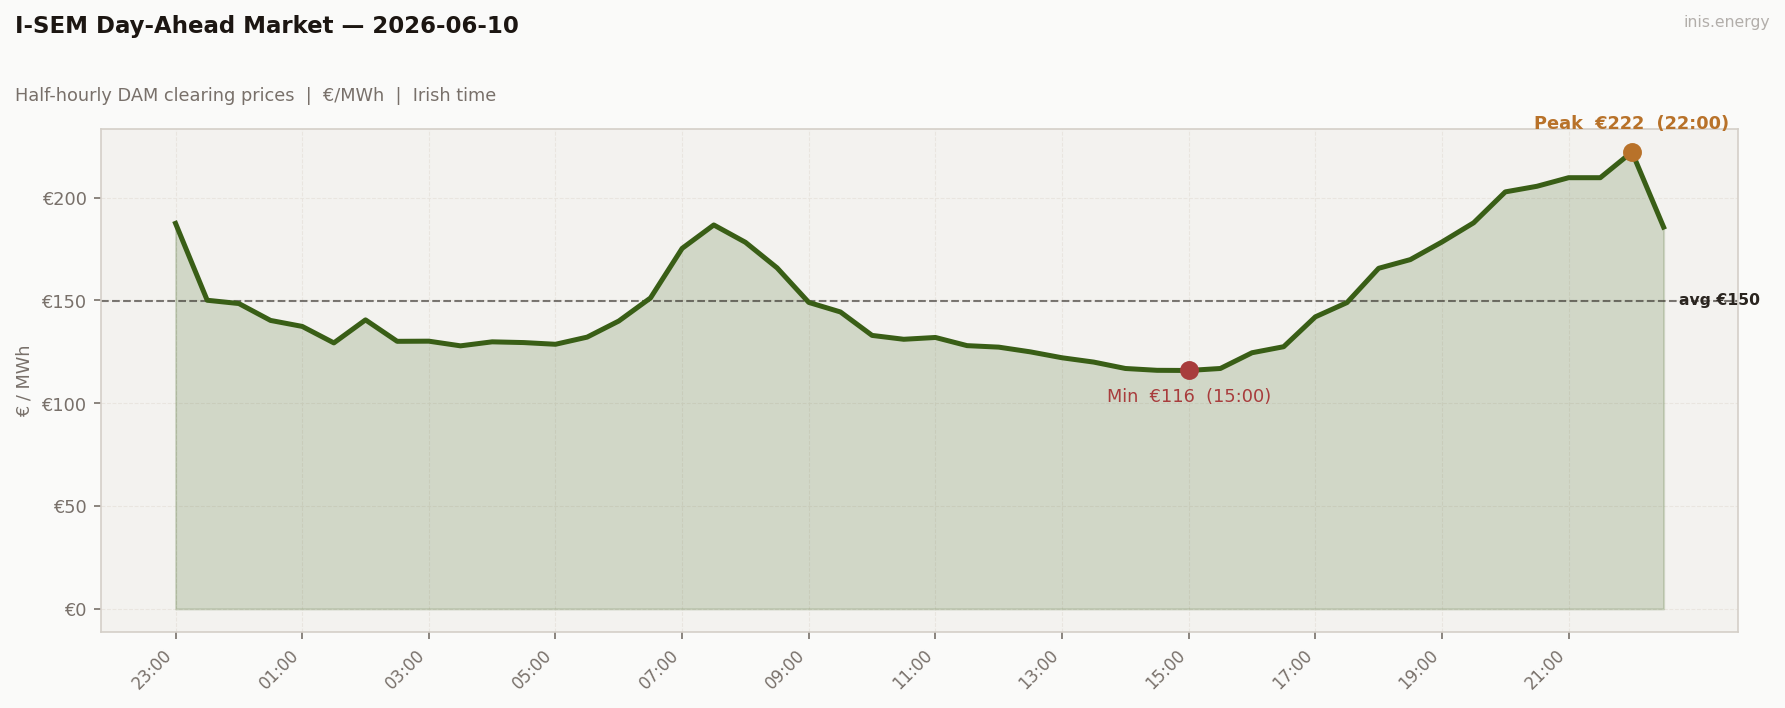
Std dev €29.38/MWh · Median €140.14/MWh · Periods above €150: 17 of 48 (35%)
The shape today is double-humped. A morning ramp climbs from €140 (06:00) to €186.72 (07:30) as wind dips to 18%, then the floor drops out through midday — €115.95 at 15:00, the day’s cheapest period, as wind builds to 39.9%. From there it’s a steep climb into the evening, topping out at €222.21 by 22:00 as wind falls back under 20%. Two wind troughs, two price peaks.
Price vs Wind #
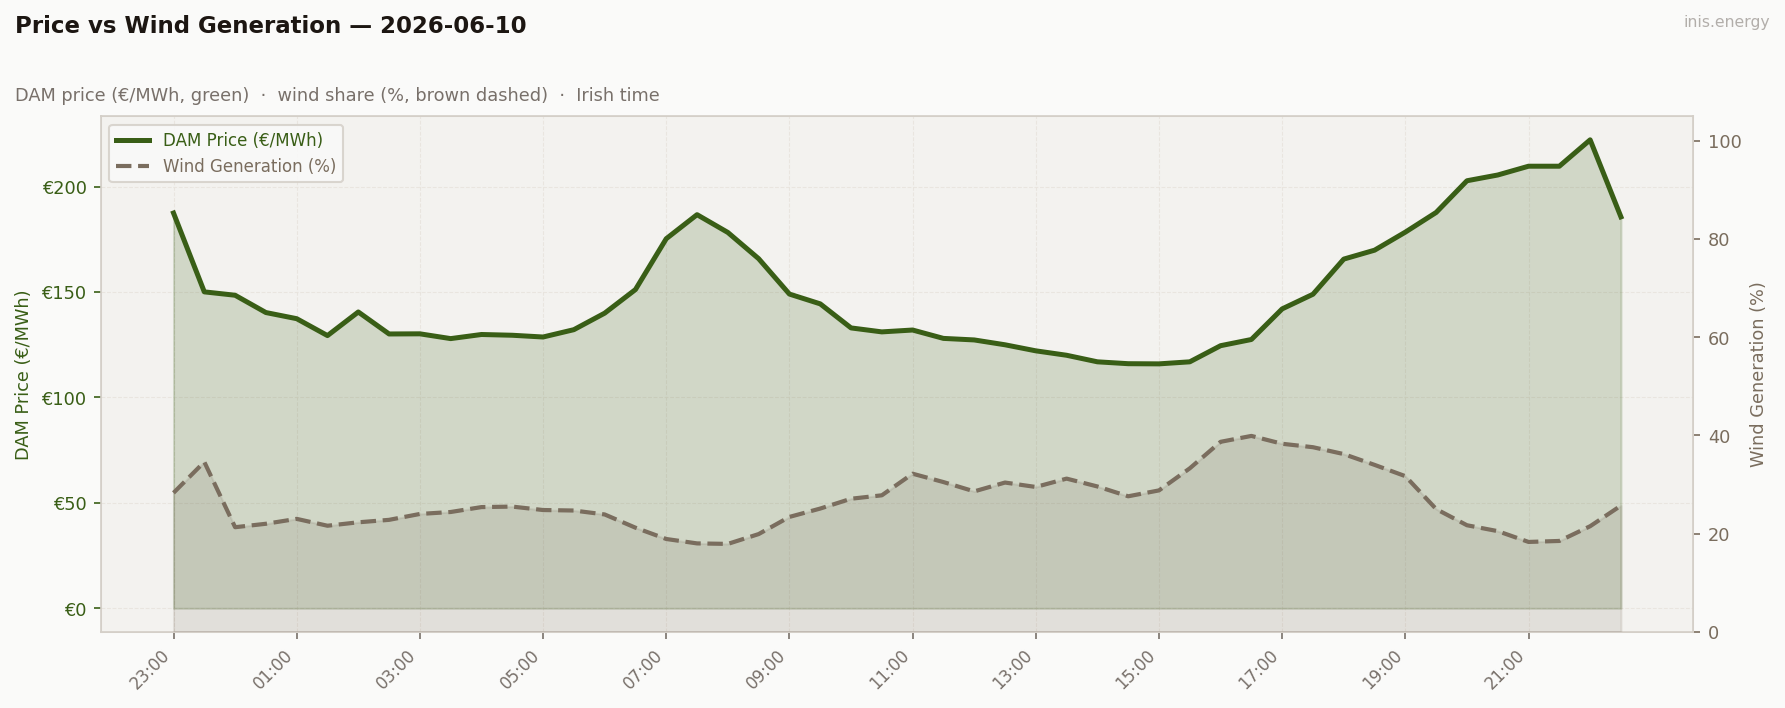
Mean wind: 26.6% · Range: 17.9%–39.9%
A textbook inverse. Both price peaks — morning and evening — sit on top of wind troughs (17.9% and ~18-21%), and the only real wind surplus of the day (28-40%, midday through late afternoon) buys the day’s cheapest hour. Cannibalisation, right on schedule.
Week in Context #
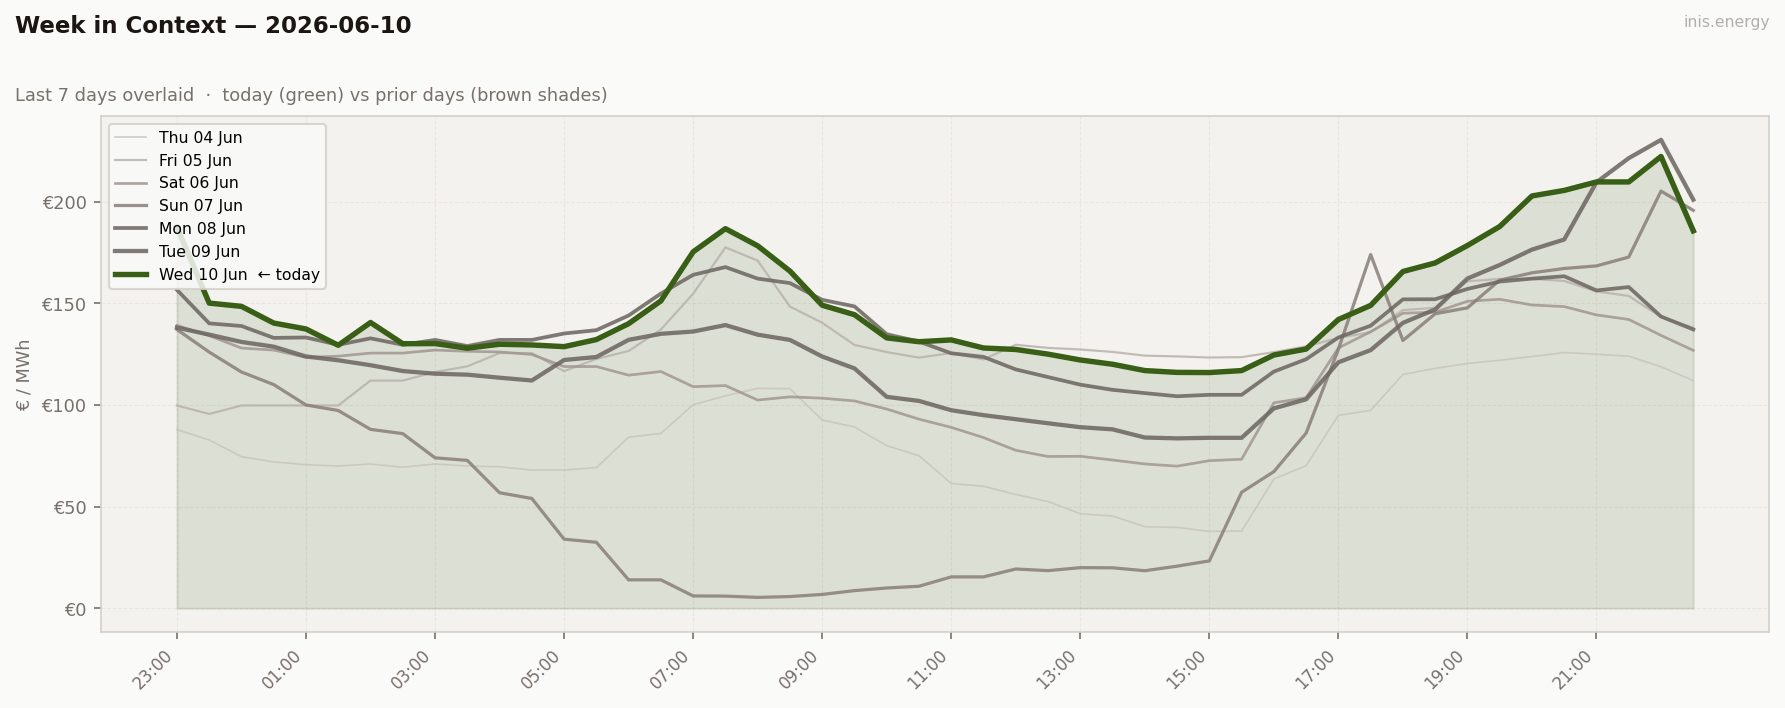
Moderate wind, moderate everything — this sits in the middle of the week’s range. The flatter, higher-wind days and the sharper, lower-wind spikes are still to come.
Price Duration Curve #
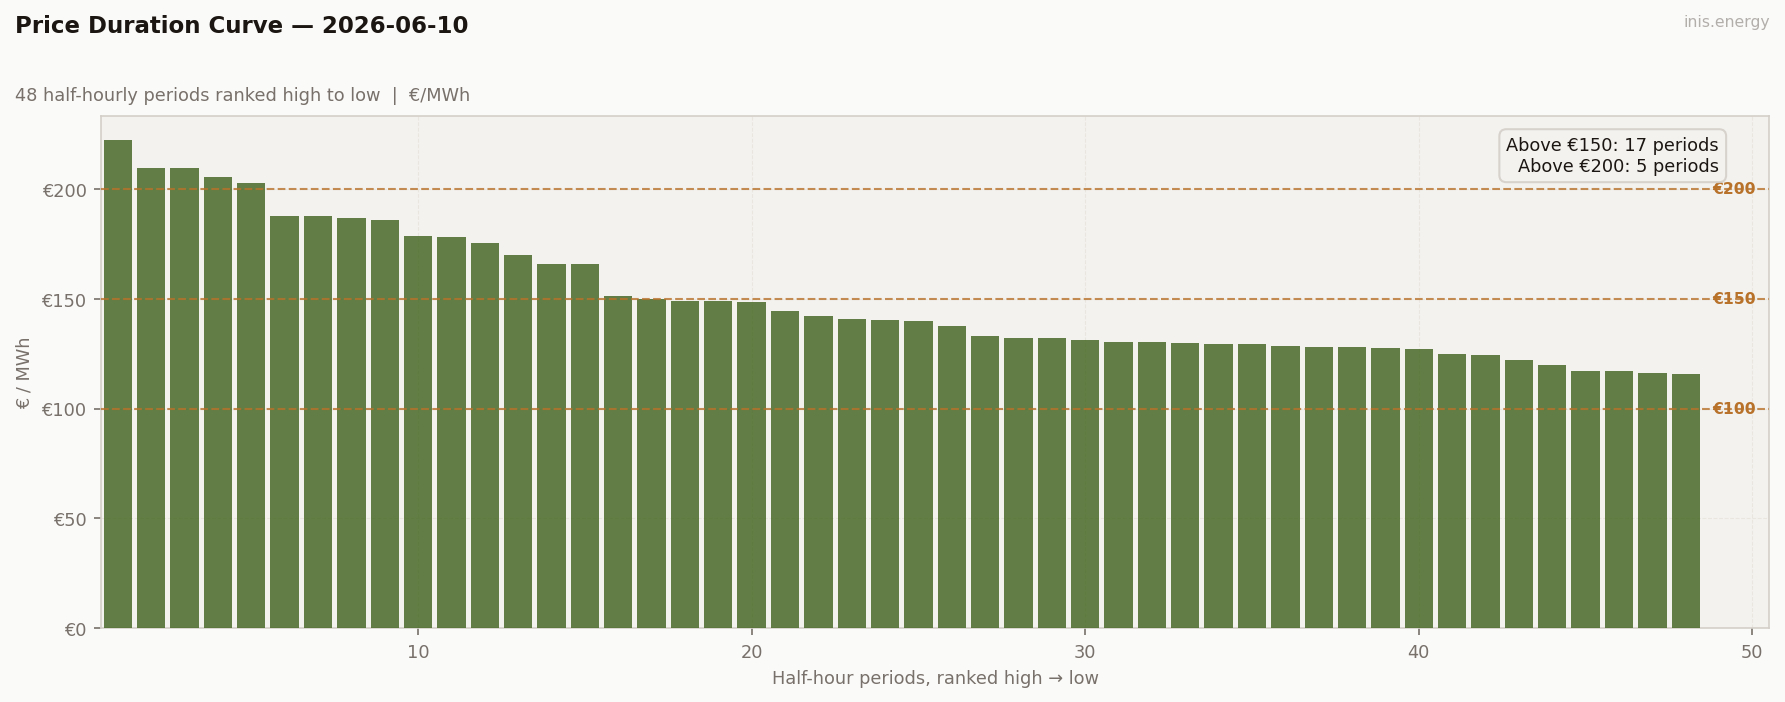
Periods above €150: 17 (35% of day) · Above €200: 5 (10% of day)
A third of the day clears above €150, but only 5 periods break €200 — shape without real scarcity. The curve has a proper slope, not the flat plateau of a thermally-set day.
Peak / Off-Peak Spread #
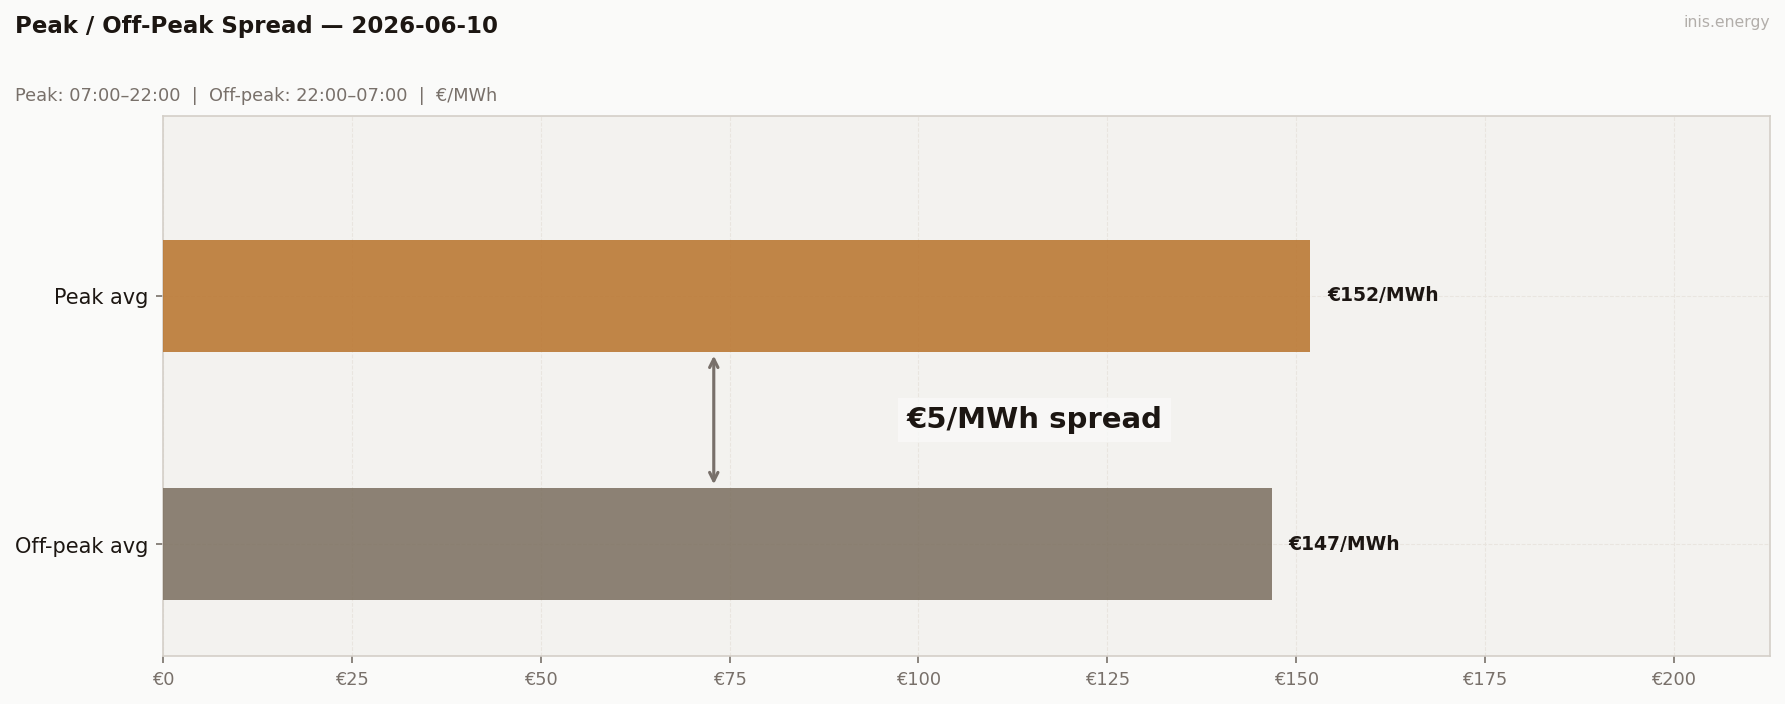
Peak avg (07:00–22:00): €151.89/MWh · Off-peak avg: €146.74/MWh · Spread: €5.15/MWh
The headline range is €106, but the peak/off-peak spread is almost nothing. Both the morning ramp and the evening ceiling fall inside the ‘peak’ window — and so does the midday floor. The extremes cancel each other out within the same window, leaving off-peak flat and unremarkable.
BESS Dispatch Signal #
| Price | Time | Energy | Value | |
|---|---|---|---|---|
| Charge | €116/MWh | 14:00 | 2 MWh | −€233 |
| Discharge | €212/MWh | 20:30 | 1.7 MWh (85% RTE) | +€360 |
| Gross profit | €127 | |||
| Price spread | €95/MWh | ROI: 54.6% |
Simulated 1MW/2MWh battery, one optimal DAM cycle. Gross before network charges and capacity costs.
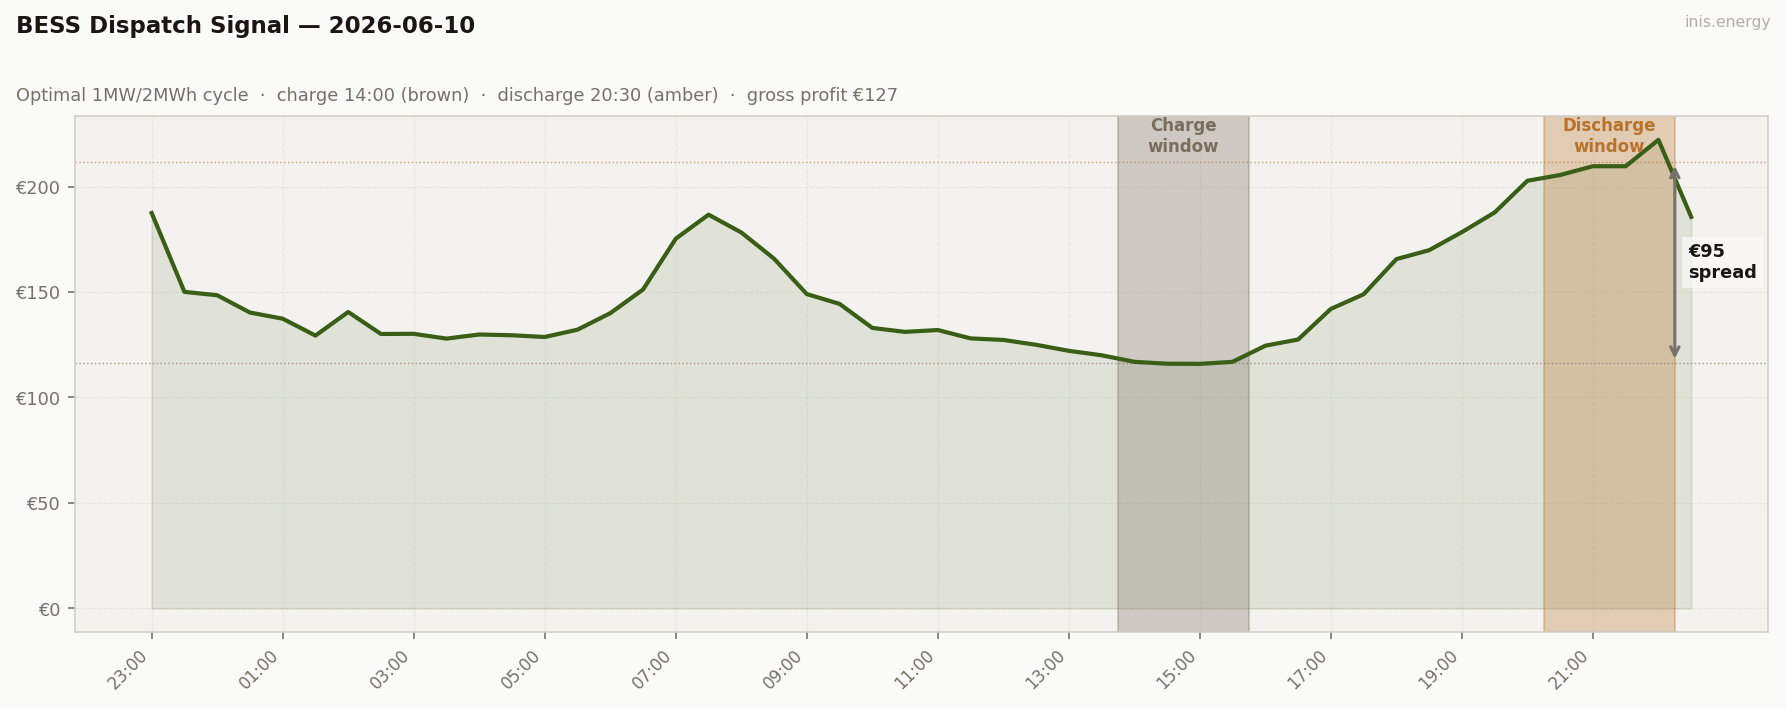
€127 gross on a captured spread of €95 — charge at €116 (14:00), discharge at €212 (20:30). Solid, unspectacular. The battery caught the midday wind trough and rode the evening ramp out, exactly as the day’s shape would predict.
Commentary #
Two wind troughs, two price peaks, one trough of surplus in between — today’s shape was written entirely by wind. The morning dip to 18% lifted the ramp to €186.72, the midday surplus (up to 39.9%) bought the day’s floor at €115.95, and the evening fade back under 20% lifted the ceiling to €222.21, the day’s peak.
A €106 range sounds volatile, but the peak/off-peak split barely moved (€5.15) — both ends of the swing landed inside the same window and cancelled out. For storage, though, the shape was real: €127 gross, a fair midweek result.
Wind crept toward 40% in the afternoon trough today. If it holds or builds further into tomorrow, expect the double hump to flatten out.
Half-hourly data — 2026-06-10
| Period | Time | Price (€/MWh) | Wind % |
|---|---|---|---|
| 1 | 23:00 | 187.49 | 28.3% |
| 2 | 23:30 | 150.10 | 34.6% |
| 3 | 00:00 | 148.50 | 21.3% |
| 4 | 00:30 | 140.29 | 22.0% |
| 5 | 01:00 | 137.38 | 23.0% |
| 6 | 01:30 | 129.36 | 21.6% |
| 7 | 02:00 | 140.56 | 22.3% |
| 8 | 02:30 | 130.13 | 22.8% |
| 9 | 03:00 | 130.20 | 24.0% |
| 10 | 03:30 | 127.93 | 24.4% |
| 11 | 04:00 | 129.88 | 25.4% |
| 12 | 04:30 | 129.52 | 25.5% |
| 13 | 05:00 | 128.69 | 24.8% |
| 14 | 05:30 | 132.17 | 24.7% |
| 15 | 06:00 | 140.00 | 23.9% |
| 16 | 06:30 | 151.20 | 21.2% |
| 17 | 07:00 | 175.32 | 18.9% |
| 18 | 07:30 | 186.72 | 18.0% |
| 19 | 08:00 | 178.28 | 17.9% |
| 20 | 08:30 | 165.84 | 19.9% |
| 21 | 09:00 | 149.05 | 23.4% |
| 22 | 09:30 | 144.41 | 25.1% |
| 23 | 10:00 | 133.00 | 27.1% |
| 24 | 10:30 | 131.12 | 27.8% |
| 25 | 11:00 | 132.00 | 32.2% |
| 26 | 11:30 | 128.03 | 30.5% |
| 27 | 12:00 | 127.30 | 28.6% |
| 28 | 12:30 | 125.00 | 30.4% |
| 29 | 13:00 | 122.13 | 29.5% |
| 30 | 13:30 | 120.03 | 31.2% |
| 31 | 14:00 | 116.92 | 29.6% |
| 32 | 14:30 | 116.03 | 27.6% |
| 33 | 15:00 | 115.95 | 28.8% |
| 34 | 15:30 | 116.92 | 33.3% |
| 35 | 16:00 | 124.57 | 38.7% |
| 36 | 16:30 | 127.51 | 39.9% |
| 37 | 17:00 | 142.03 | 38.3% |
| 38 | 17:30 | 148.97 | 37.6% |
| 39 | 18:00 | 165.64 | 36.2% |
| 40 | 18:30 | 169.87 | 34.0% |
| 41 | 19:00 | 178.44 | 31.7% |
| 42 | 19:30 | 187.77 | 25.0% |
| 43 | 20:00 | 202.80 | 21.7% |
| 44 | 20:30 | 205.53 | 20.5% |
| 45 | 21:00 | 209.70 | 18.3% |
| 46 | 21:30 | 209.70 | 18.5% |
| 47 | 22:00 | 222.21 | 21.5% |
| 48 | 22:30 | 185.67 | 25.7% |
Compare your business electricity and gas rates in minutes with INIS Energy Brokers.
Compare rates