I-SEM Daily Briefing — 11 June 2026
Table of Contents
Market Snapshot
| Metric | Value |
|---|---|
| Mean DAM Price | €128.4/MWh |
| Median Price | €128.09/MWh |
| Std Dev | €13.28/MWh |
| Peak Price | €171.5/MWh (23:00) |
| Min Price | €104.81/MWh (15:30) |
| Price Range | €66.69/MWh |
| Periods above €150 | 2 of 48 (4%) |
| Periods above €200 | 0 of 48 (0%) |
| Peak Avg (07–22) | €128.5/MWh |
| Off-peak Avg (22–07) | €128.23/MWh |
| Peak/Off-Peak Spread | €0.27/MWh |
| Wind % of Demand | 53.8% |
| Wind Range | 37.8%–71.1% |
| Mean Demand | 3938 MW |
Price Profile #
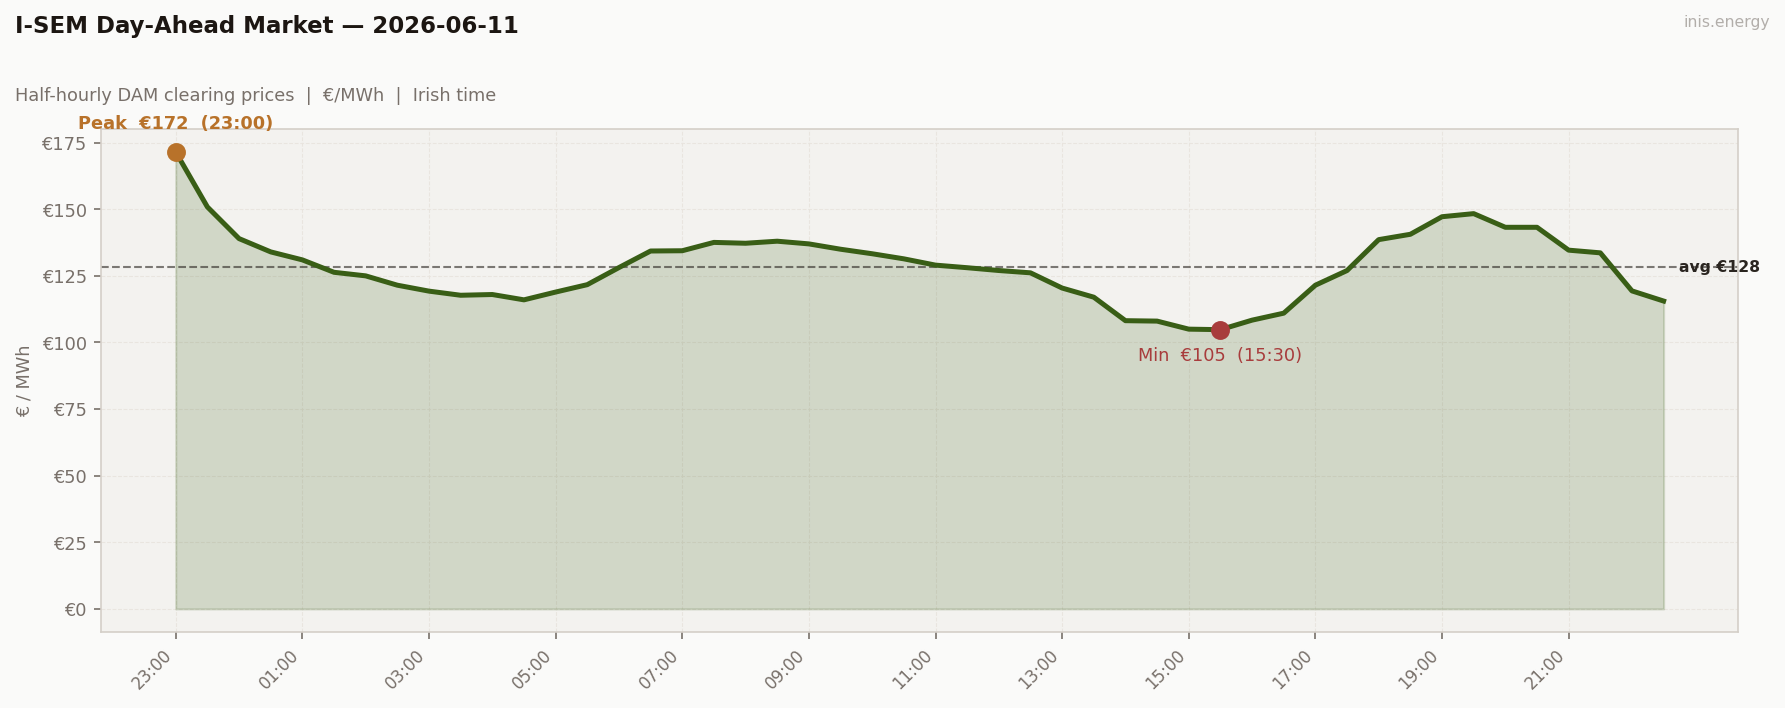
Std dev €13.28/MWh · Median €128.09/MWh · Periods above €150: 2 of 48 (4%)
Wind builds overnight to 71.1% by 04:30, and the price profile goes flat in response: €104-140 for almost the entire day, a std dev of just €13.28 — the tightest of the week. The only outlier is the very first period, €171.50 at 23:00, a hangover from the prior evening’s higher wind-trough pricing. Strip that out and this is as flat as it gets.
Price vs Wind #
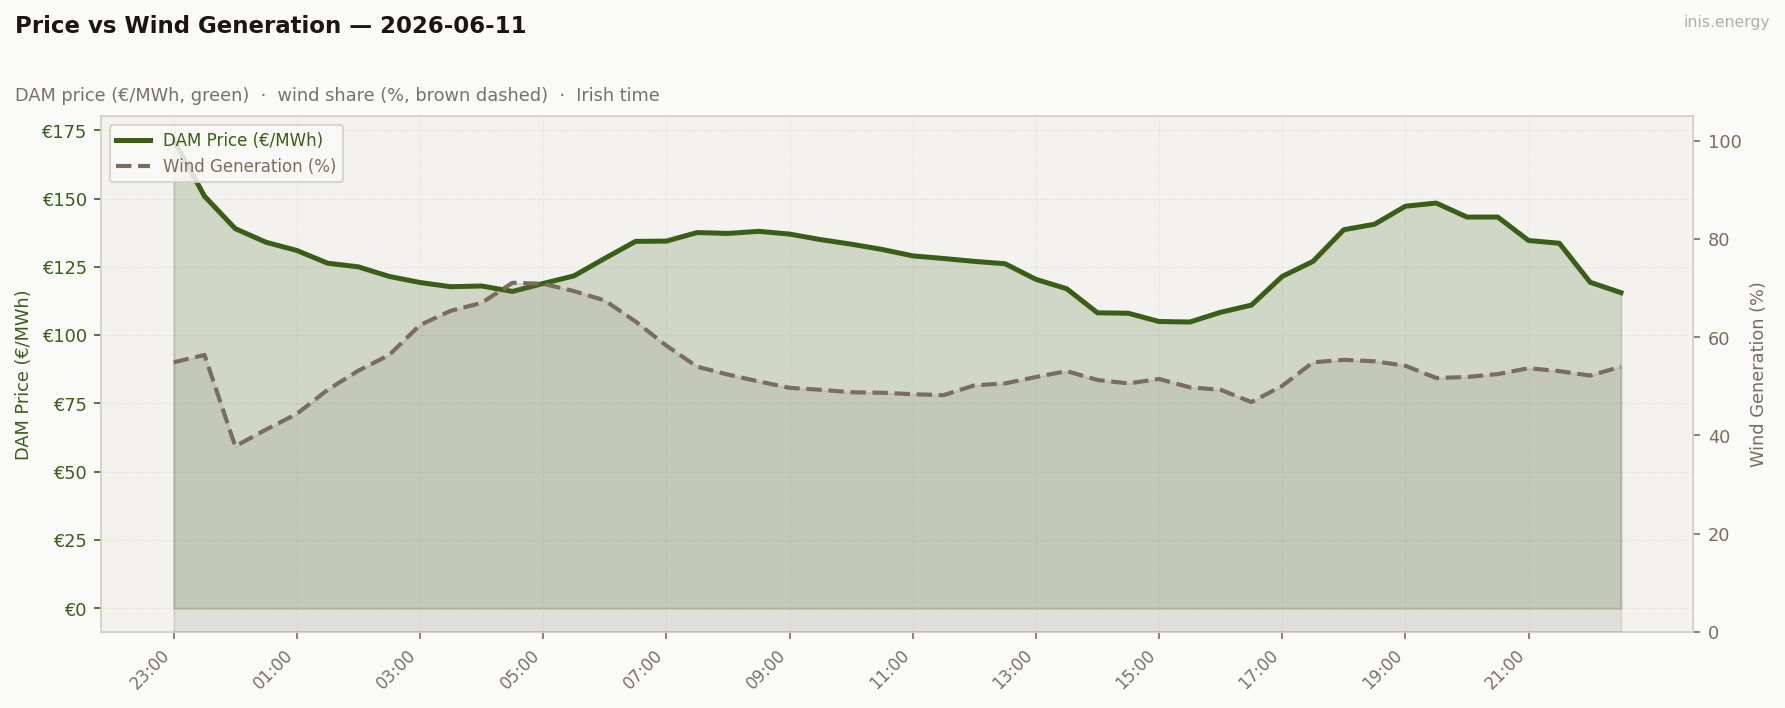
Mean wind: 53.8% · Range: 37.8%–71.1%
Wind sits above 50% for nearly the whole day, peaking near 70% overnight. Cannibalisation is total — with this much wind in the merit order, gas barely gets a look in, and the floor sits around €105. This is what a well-supplied grid looks like: flat and low.
Week in Context #
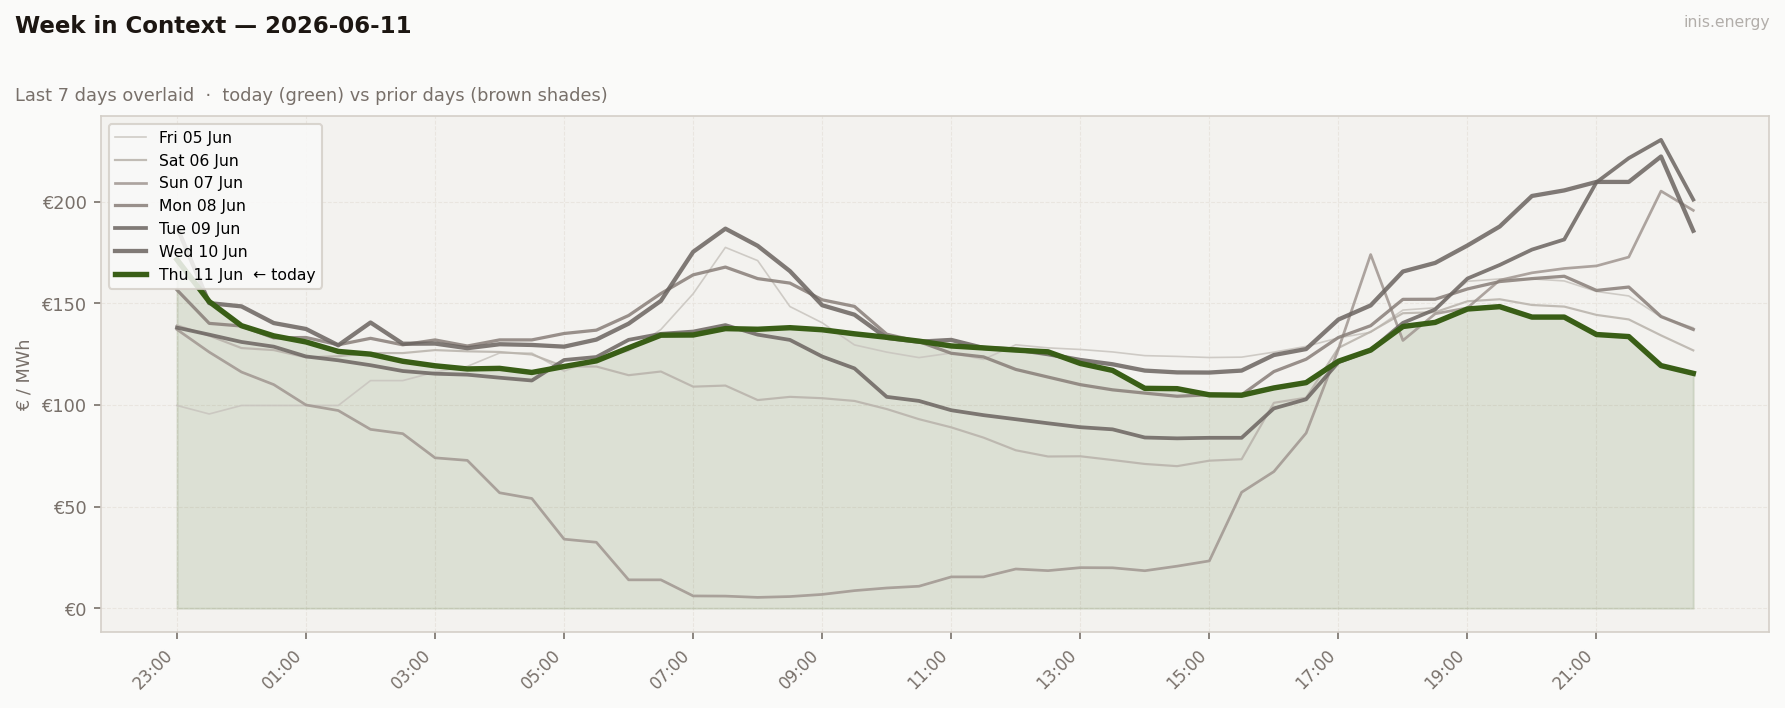
After yesterday’s double-humped shape, wind built overnight and flattened everything out. Today’s std dev of €13.28 is the tightest of the week — the calm before two days of much sharper moves.
Price Duration Curve #
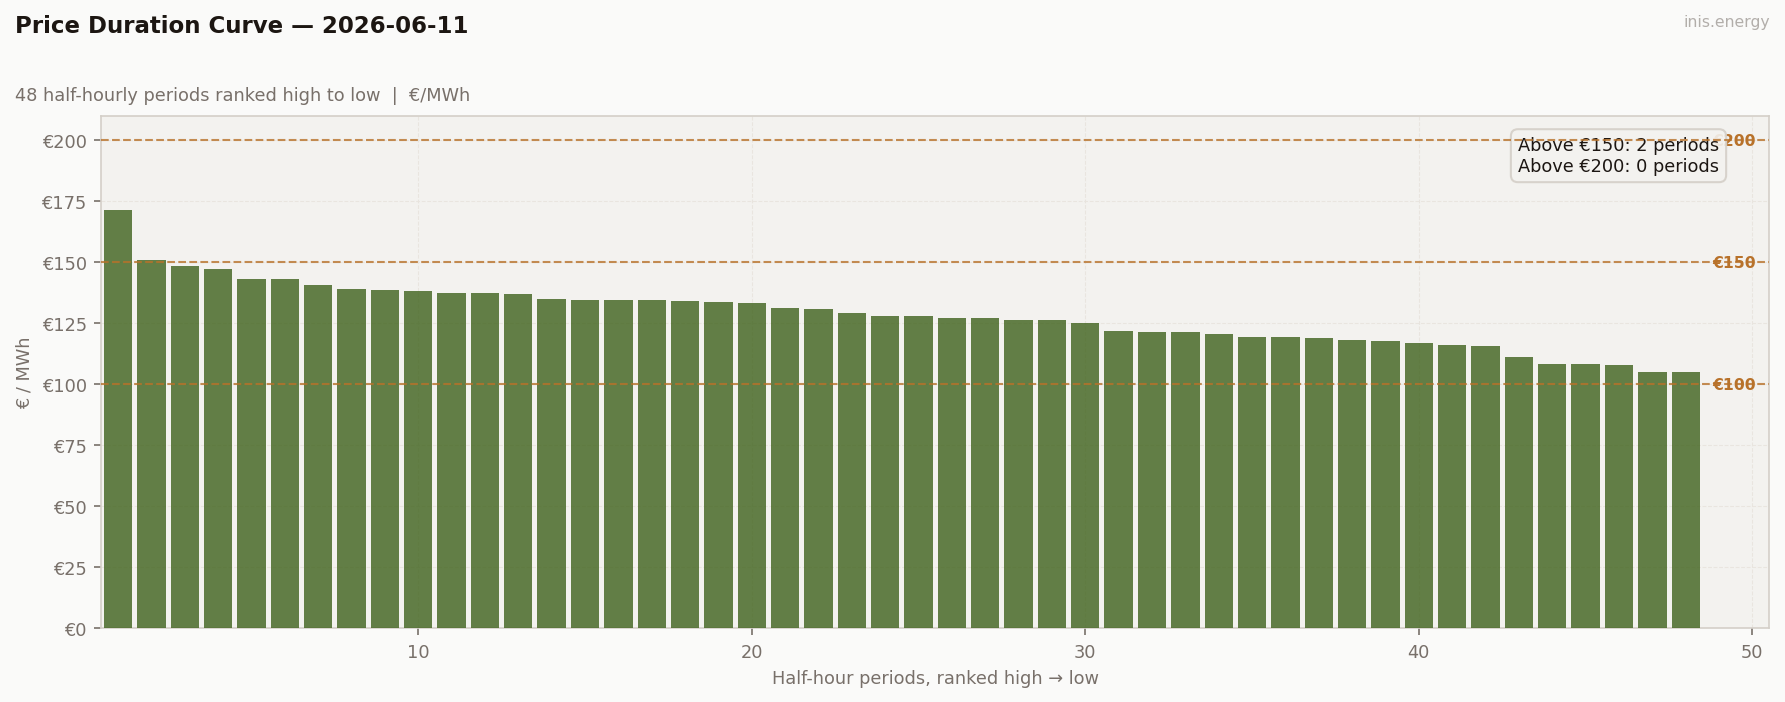
Periods above €150: 2 (4% of day) · Above €200: 0 (0% of day)
Only 2 of 48 periods clear €150, none clear €200. The curve is flat and low across its entire length — the signature of a well-supplied, gas-light day.
Peak / Off-Peak Spread #
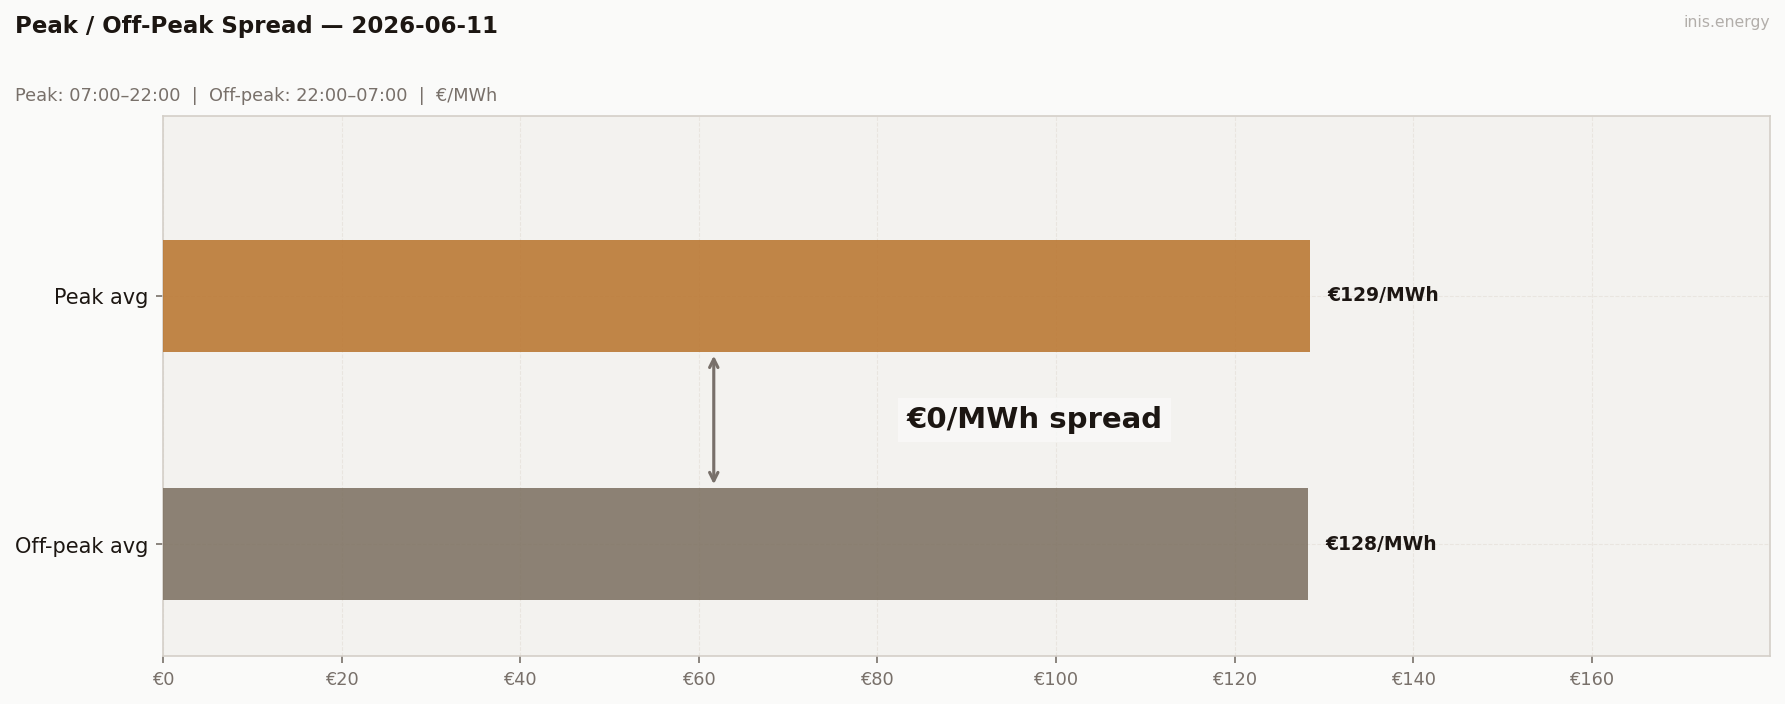
Peak avg (07:00–22:00): €128.5/MWh · Off-peak avg: €128.23/MWh · Spread: €0.27/MWh
As close to zero as this market gets. Peak and off-peak average almost the same price, because there’s no shape to the day for the windows to separate.
BESS Dispatch Signal #
| Price | Time | Energy | Value | |
|---|---|---|---|---|
| Charge | €106/MWh | 14:00 | 2 MWh | −€213 |
| Discharge | €146/MWh | 19:00 | 1.7 MWh (85% RTE) | +€247 |
| Gross profit | €34 | |||
| Price spread | €39/MWh | ROI: 16.1% |
Updated 2026-08-27: the BESS simulation previously allowed the discharge window to occur before the charge window ended, which is physically impossible for a battery — in this case, by picking periods 1–4 (23:00–00:30), which precede the 14:00 charge. Recalculated enforcing charge-before-discharge; gross profit corrected from €40 to €34.
Simulated 1MW/2MWh battery, one optimal DAM cycle. Gross before network charges and capacity costs.
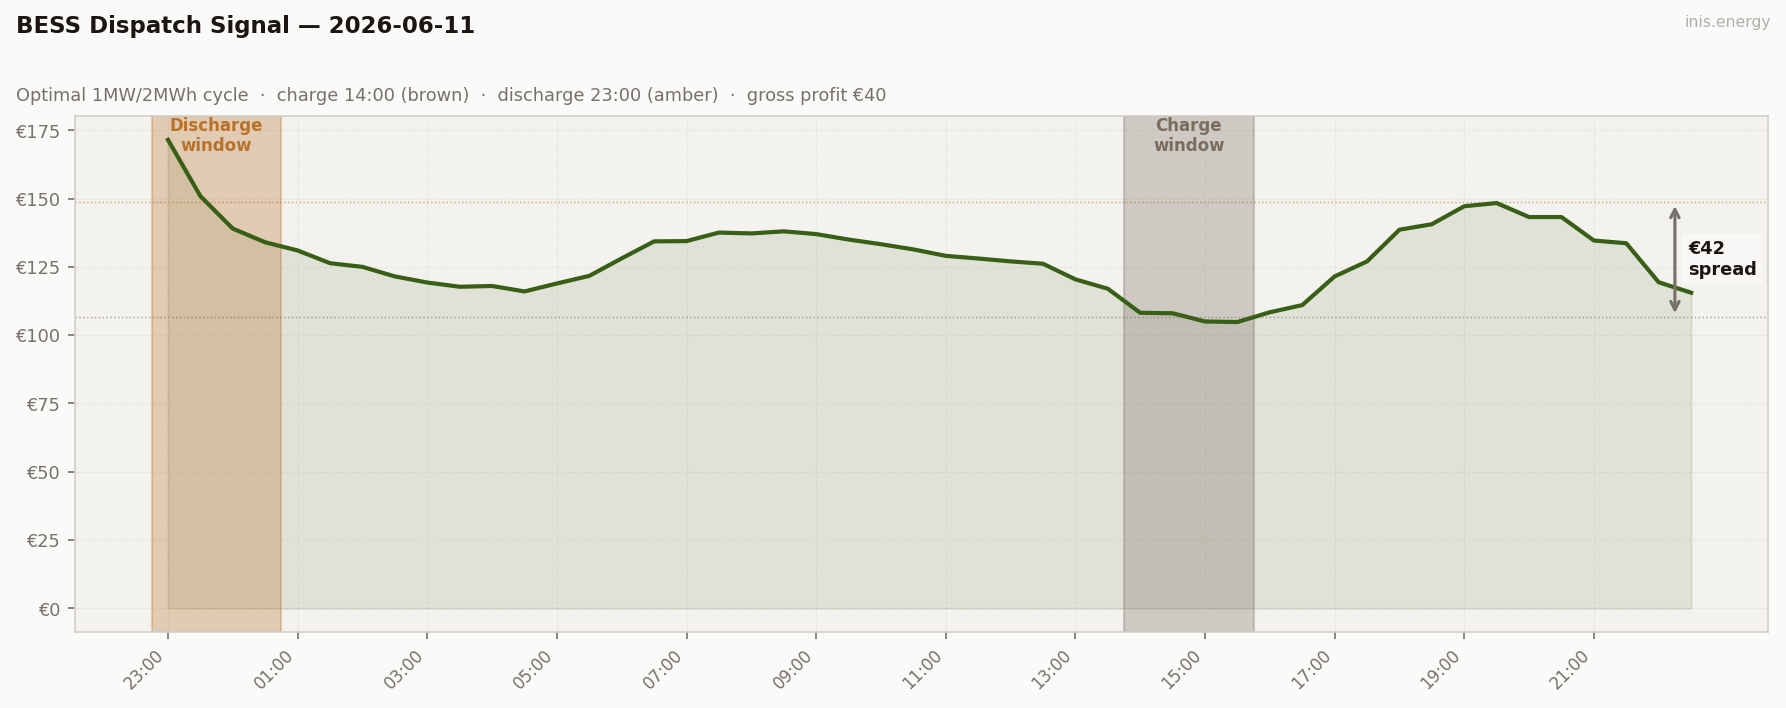
€34 gross, the worst of the week. With std dev this low there’s no volatility for a battery to exploit — the captured spread of €39 is barely above the charge price itself.
Commentary #
Wind built through the night to 71.1% and the day went flat: €13.28 std dev, the lowest of the week by a wide margin, and only 2 periods above €150.
Storage doesn’t reward flat days — €34 gross was the worst result of the week, because there was simply no spread to capture.
Wind above 50% for a second straight day tomorrow would mean more of the same. But if that surplus shifts toward midday instead of overnight, this flat shape could break into something much sharper.
Half-hourly data — 2026-06-11
| Period | Time | Price (€/MWh) | Wind % |
|---|---|---|---|
| 1 | 23:00 | 171.50 | 54.9% |
| 2 | 23:30 | 150.87 | 56.4% |
| 3 | 00:00 | 138.99 | 37.8% |
| 4 | 00:30 | 134.00 | 41.2% |
| 5 | 01:00 | 131.00 | 44.4% |
| 6 | 01:30 | 126.34 | 49.3% |
| 7 | 02:00 | 125.00 | 53.2% |
| 8 | 02:30 | 121.50 | 56.4% |
| 9 | 03:00 | 119.27 | 62.5% |
| 10 | 03:30 | 117.72 | 65.4% |
| 11 | 04:00 | 118.00 | 67.0% |
| 12 | 04:30 | 116.00 | 71.1% |
| 13 | 05:00 | 118.92 | 70.9% |
| 14 | 05:30 | 121.70 | 69.4% |
| 15 | 06:00 | 128.11 | 67.5% |
| 16 | 06:30 | 134.33 | 63.2% |
| 17 | 07:00 | 134.43 | 58.3% |
| 18 | 07:30 | 137.56 | 54.0% |
| 19 | 08:00 | 137.24 | 52.4% |
| 20 | 08:30 | 138.01 | 51.0% |
| 21 | 09:00 | 137.00 | 49.7% |
| 22 | 09:30 | 135.00 | 49.3% |
| 23 | 10:00 | 133.30 | 48.8% |
| 24 | 10:30 | 131.39 | 48.7% |
| 25 | 11:00 | 129.03 | 48.4% |
| 26 | 11:30 | 128.06 | 48.2% |
| 27 | 12:00 | 127.01 | 50.2% |
| 28 | 12:30 | 126.14 | 50.6% |
| 29 | 13:00 | 120.43 | 51.9% |
| 30 | 13:30 | 117.00 | 53.1% |
| 31 | 14:00 | 108.18 | 51.3% |
| 32 | 14:30 | 108.02 | 50.6% |
| 33 | 15:00 | 105.00 | 51.5% |
| 34 | 15:30 | 104.81 | 49.8% |
| 35 | 16:00 | 108.38 | 49.3% |
| 36 | 16:30 | 111.00 | 46.8% |
| 37 | 17:00 | 121.50 | 50.1% |
| 38 | 17:30 | 127.00 | 54.9% |
| 39 | 18:00 | 138.60 | 55.4% |
| 40 | 18:30 | 140.61 | 55.1% |
| 41 | 19:00 | 147.20 | 54.2% |
| 42 | 19:30 | 148.36 | 51.7% |
| 43 | 20:00 | 143.23 | 51.9% |
| 44 | 20:30 | 143.23 | 52.5% |
| 45 | 21:00 | 134.65 | 53.7% |
| 46 | 21:30 | 133.64 | 53.1% |
| 47 | 22:00 | 119.36 | 52.2% |
| 48 | 22:30 | 115.55 | 54.0% |
Compare your business electricity and gas rates in minutes with INIS Energy Brokers.
Compare rates