I-SEM Daily Briefing — 12 June 2026
Table of Contents
Market Snapshot
| Metric | Value |
|---|---|
| Mean DAM Price | €91.83/MWh |
| Median Price | €98.56/MWh |
| Std Dev | €31.35/MWh |
| Peak Price | €136.16/MWh (07:30) |
| Min Price | €28.17/MWh (15:00) |
| Price Range | €107.99/MWh |
| Periods above €150 | 0 of 48 (0%) |
| Periods above €200 | 0 of 48 (0%) |
| Peak Avg (07–22) | €84.41/MWh |
| Off-peak Avg (22–07) | €104.19/MWh |
| Peak/Off-Peak Spread | €-19.78/MWh |
| Wind % of Demand | 54.8% |
| Wind Range | 44.6%–63.4% |
| Mean Demand | 3700 MW |
Price Profile #
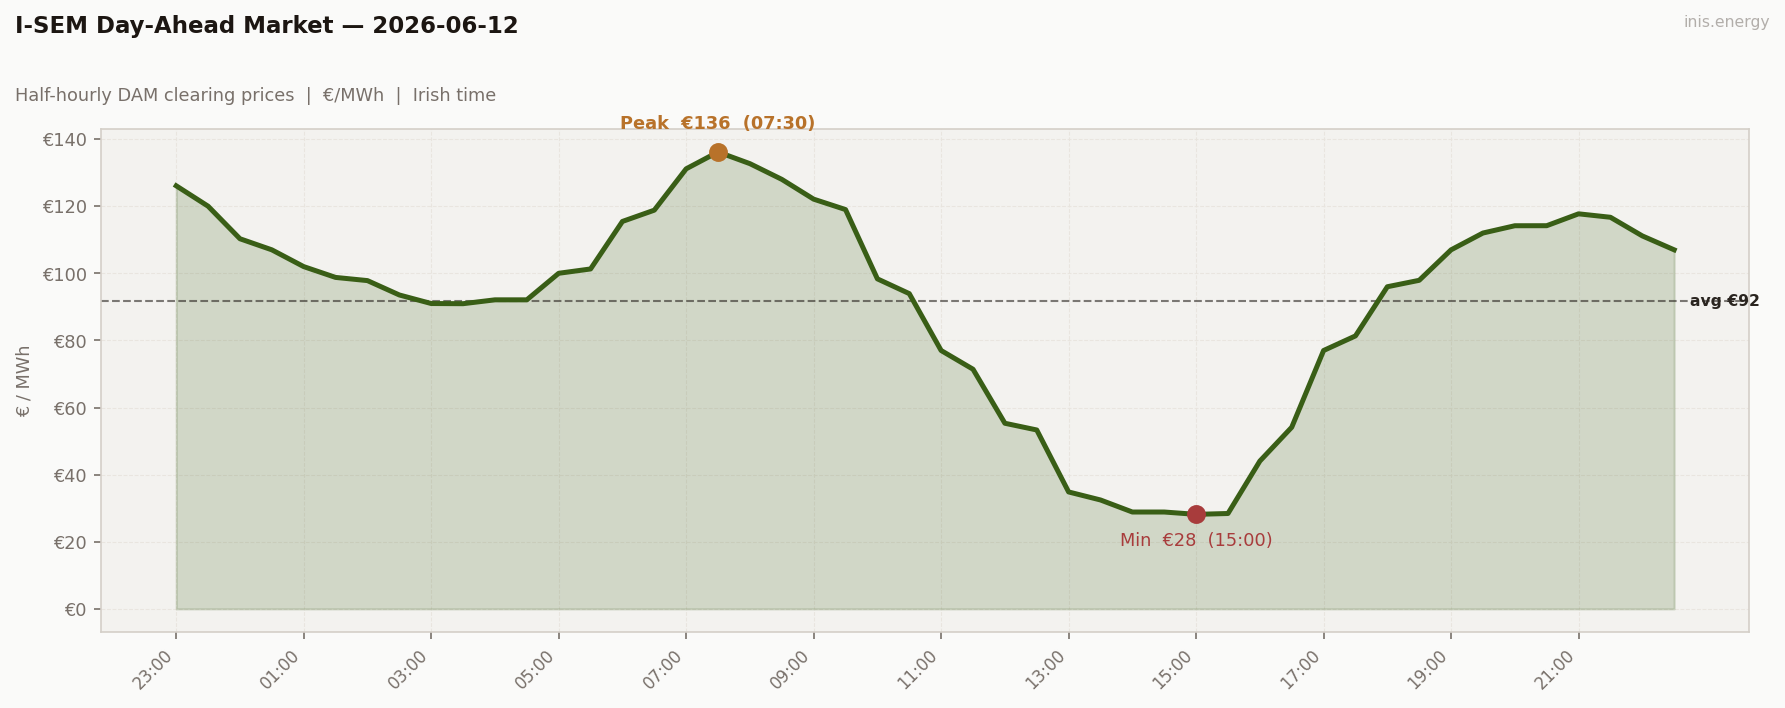
Std dev €31.35/MWh · Median €98.56/MWh · Periods above €150: 0 of 48 (0%)
The morning ramp peaks early — €136.16 at 07:30, with wind at 57.9%. From there the bottom falls out: by 15:00 the price is €28.17, just €28/MWh, as wind holds above 50% through the entire afternoon. The floor today isn’t the usual overnight floor — it’s a midday crash.
Price vs Wind #
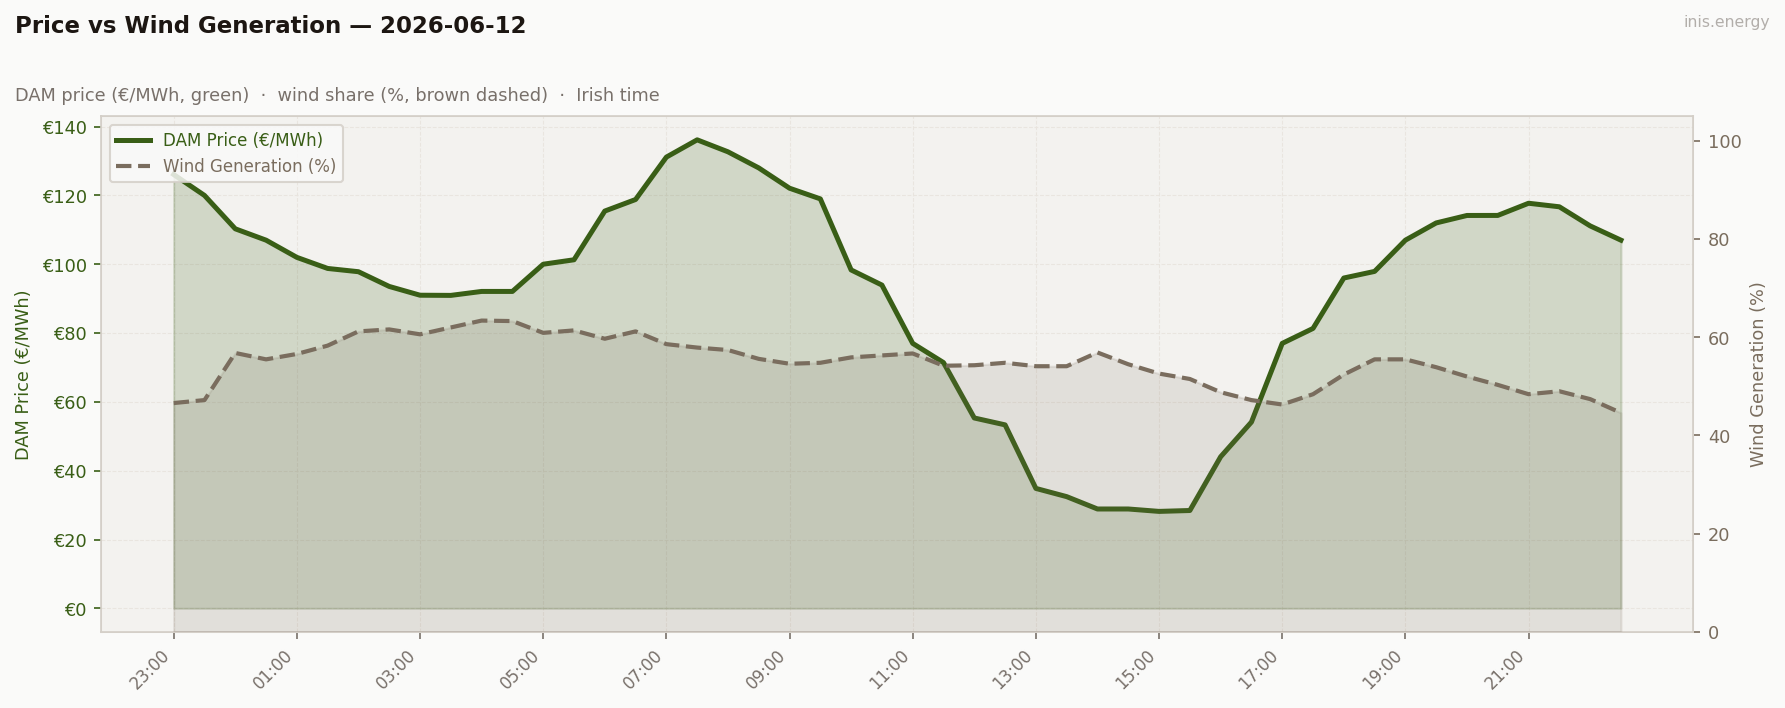
Mean wind: 54.8% · Range: 44.6%–63.4%
Wind never drops below 44.6% all day — the highest minimum of the week. With that much wind permanently in the merit order, gas barely sets price even at the morning peak (€136 is the cheapest ‘morning peak’ of the week). Cannibalisation isn’t a feature today, it’s the whole day.
Week in Context #
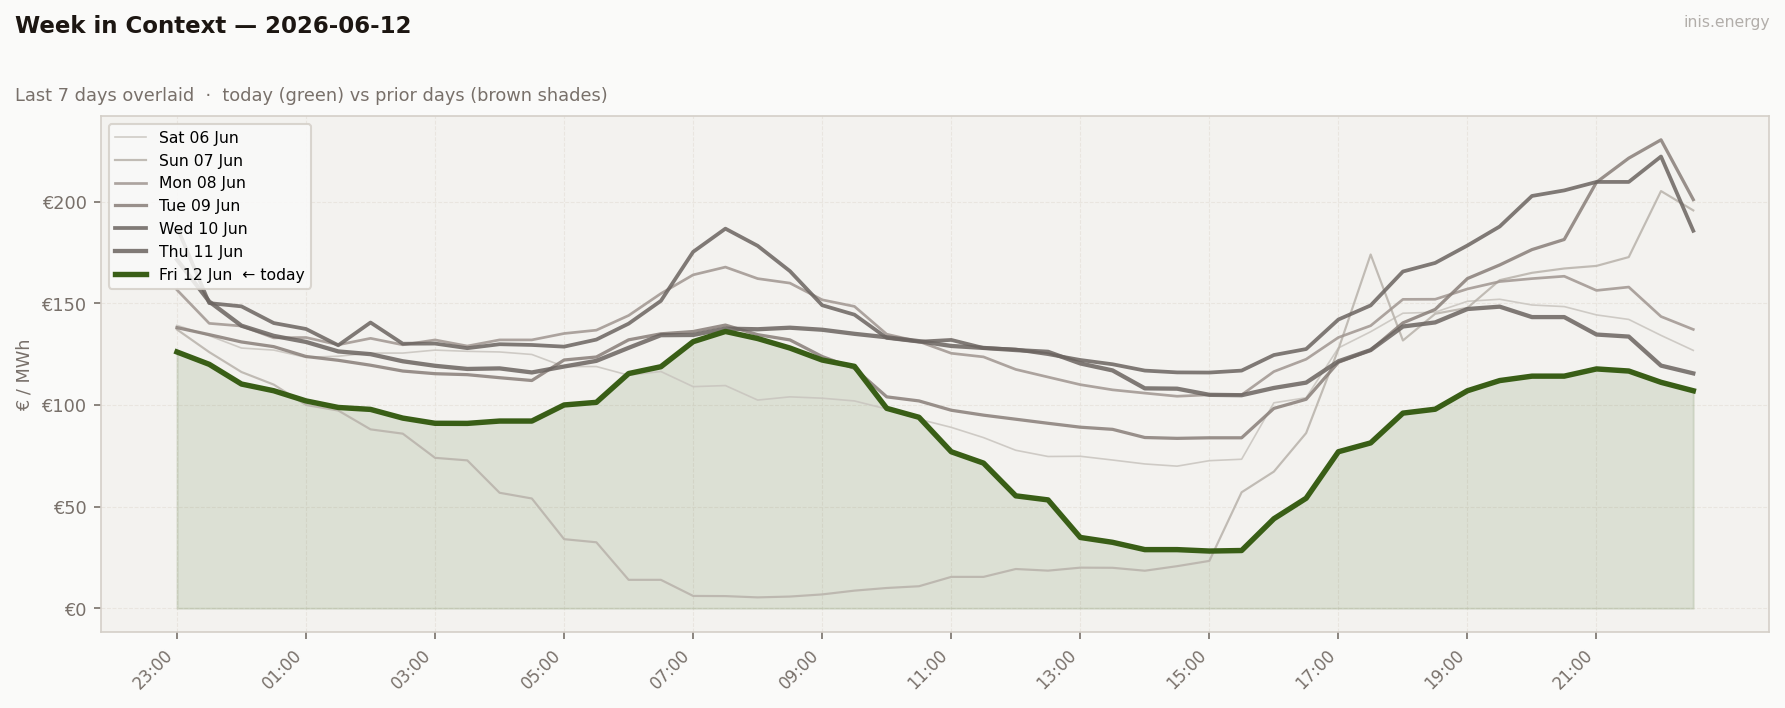
A second high-wind day in a row, but the shape has flipped. Yesterday was flat and low all day; today the same wind level produces a deep midday trough and an inverted peak/off-peak spread — proof that wind level alone doesn’t set the shape, timing does.
Price Duration Curve #
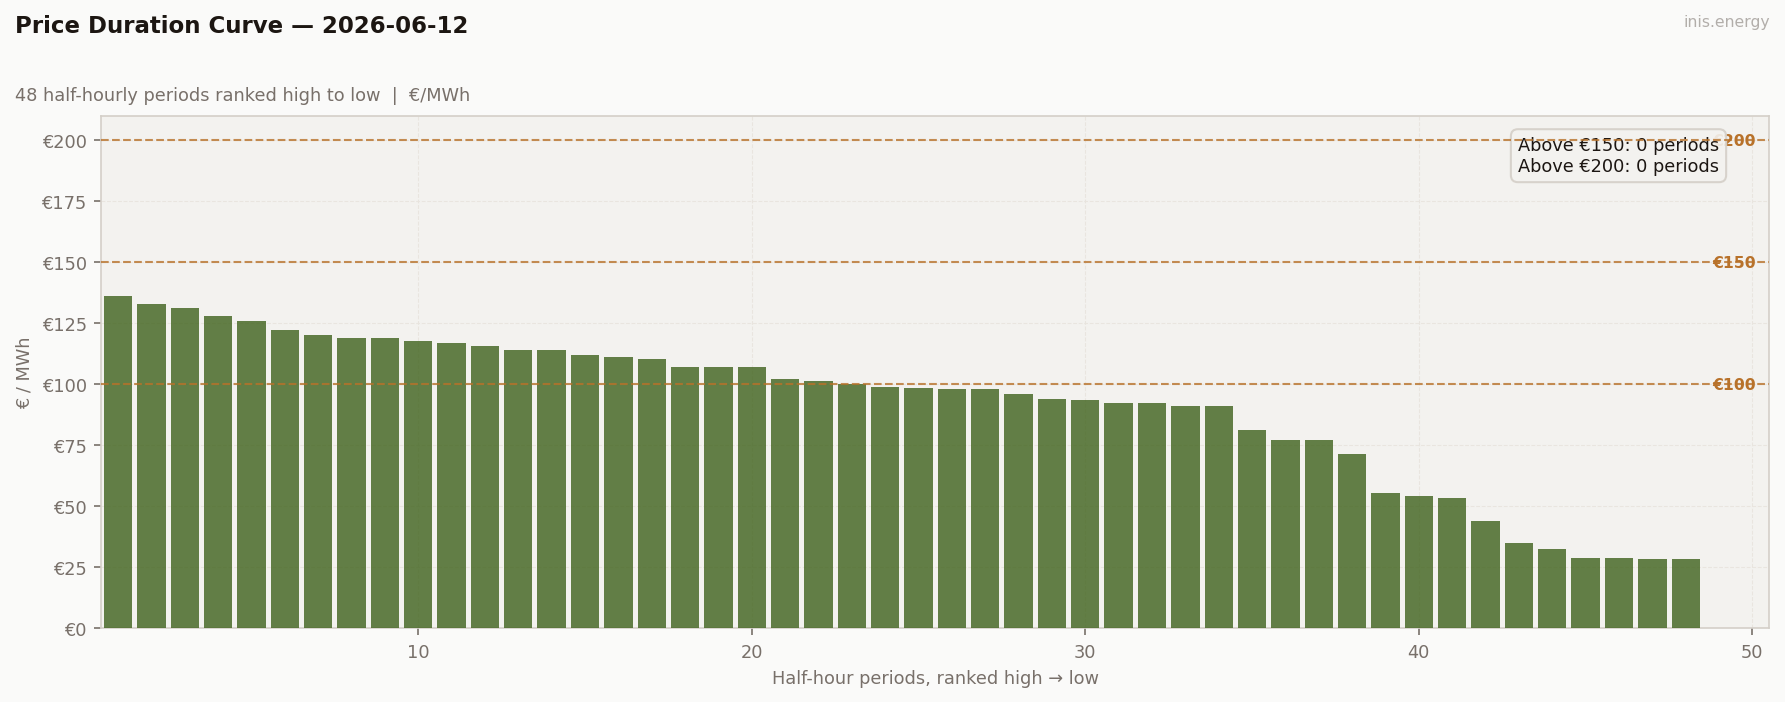
Periods above €150: 0 (0% of day) · Above €200: 0 (0% of day)
Zero periods above €150, zero above €200 — the flattest ceiling of the week. But the range (€107.99) is the second-widest, and all of it is on the downside. This curve doesn’t have a floor problem, it has a trough.
Peak / Off-Peak Spread #
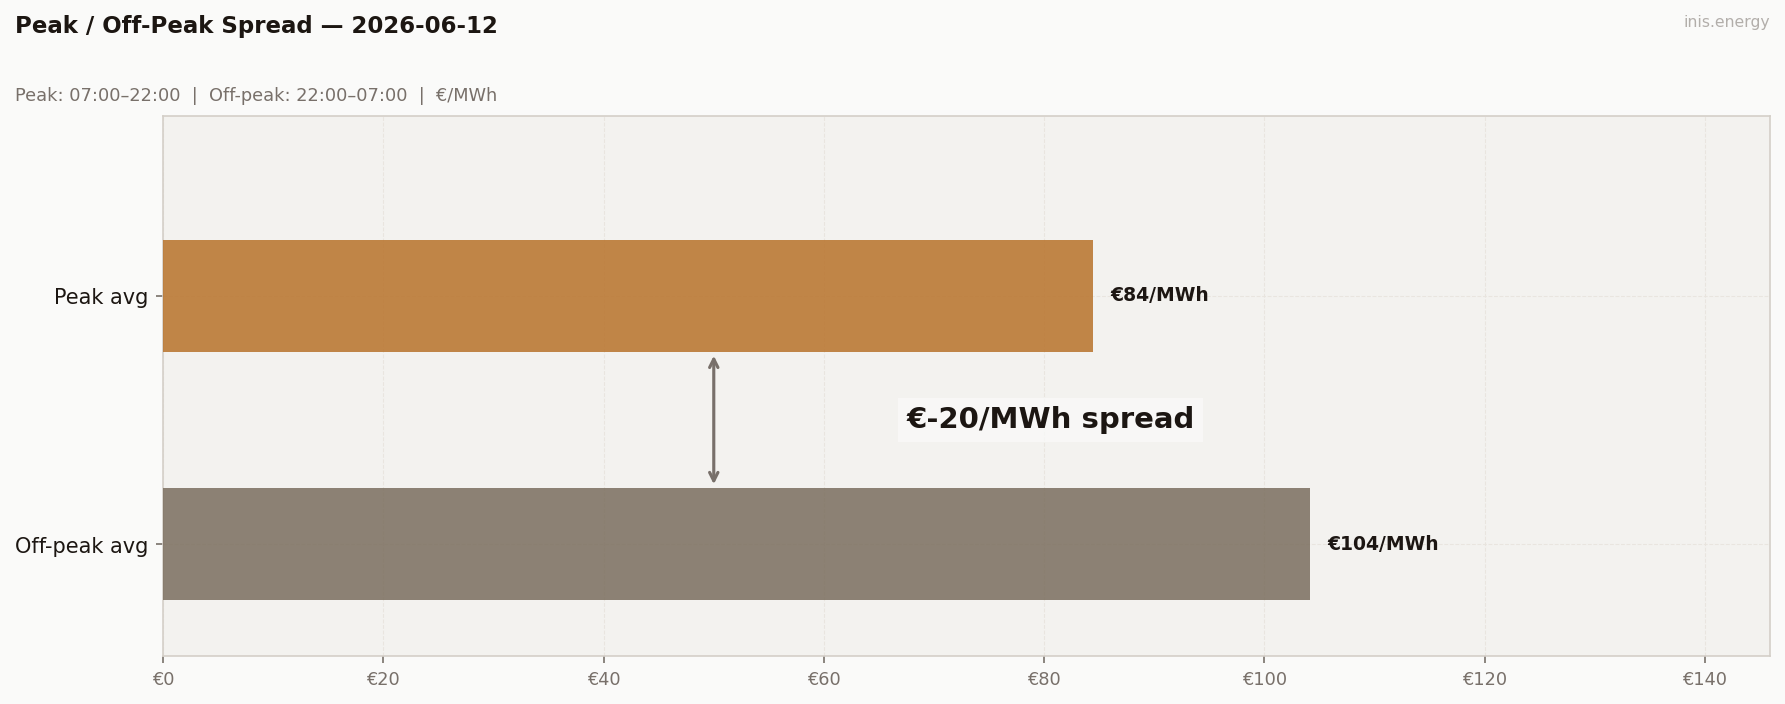
Peak avg (07:00–22:00): €84.41/MWh · Off-peak avg: €104.19/MWh · Spread: €-19.78/MWh
The spread is negative: -€19.78. Off-peak (€104.19) outprices peak (€84.41), because the midday wind surplus crashes the price inside the ‘peak’ window while the quieter overnight hours stay comparatively expensive. A genuinely inverted day.
BESS Dispatch Signal #
| Price | Time | Energy | Value | |
|---|---|---|---|---|
| Charge | €29/MWh | 14:00 | 2 MWh | −€57 |
| Discharge | €116/MWh | 20:00 | 1.7 MWh (85% RTE) | +€197 |
| Gross profit | €140 | |||
| Price spread | €87/MWh | ROI: 244.0% |
Simulated 1MW/2MWh battery, one optimal DAM cycle. Gross before network charges and capacity costs.
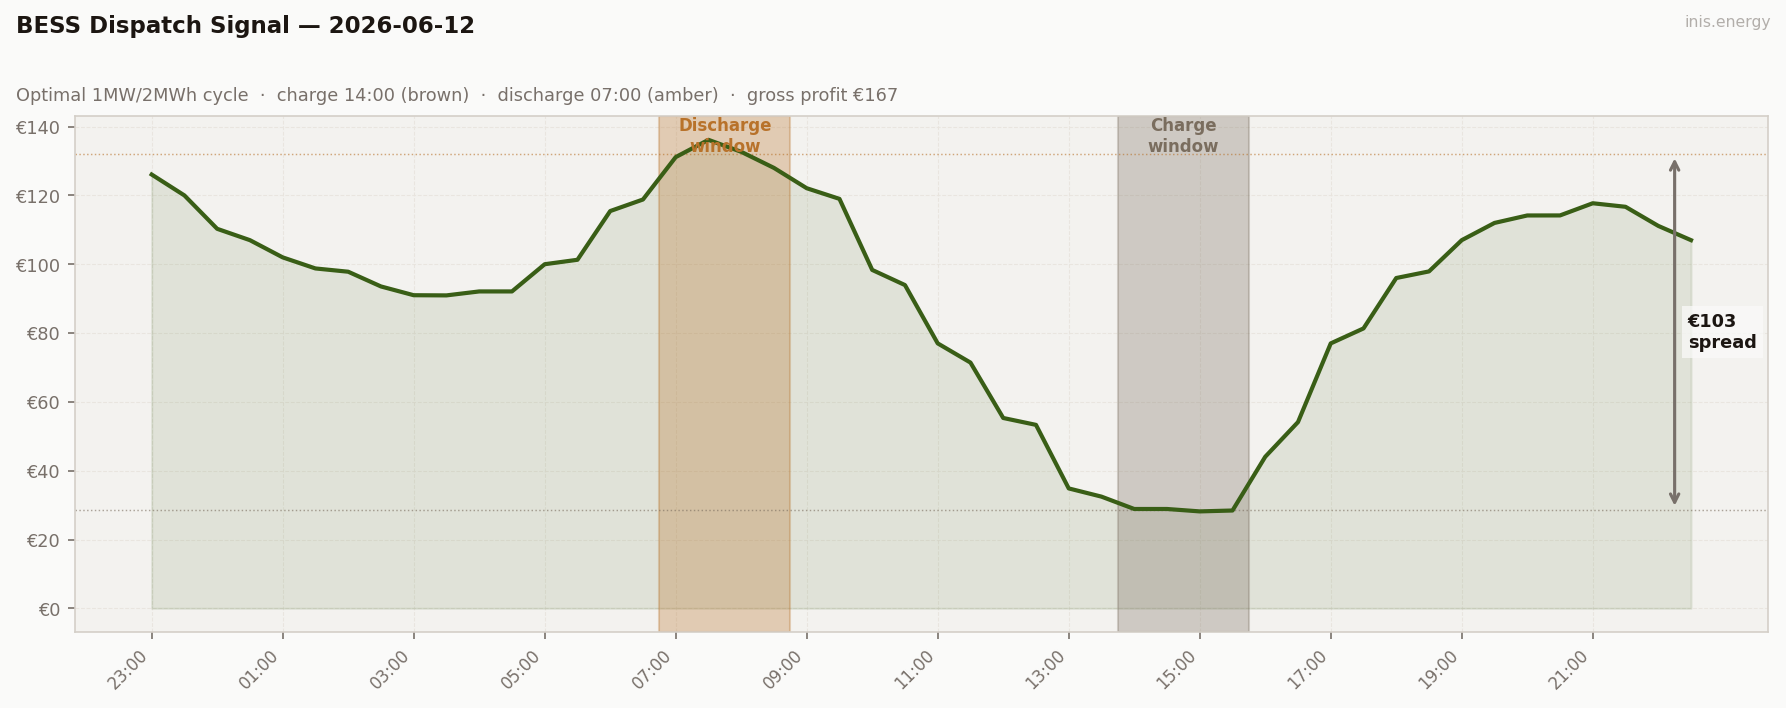
Updated 2026-08-27: the BESS simulation previously allowed the discharge window to occur before the charge window ended, which is physically impossible for a battery. This day’s figure was recalculated enforcing charge-before-discharge; gross profit corrected from €167 to €140.
€140 gross, ROI 244.0% — still the best day of the week so far. The battery charges at €29 into the midday trough and discharges at €116 into the evening peak (20:00) — the morning peak was higher, but it happened before the midday charge, so a same-day cycle can’t reach it.
Commentary #
A morning peak of €136.16, then the floor drops to €28.17 by mid-afternoon — wind never below 44.6% all day saw to that. Zero scarcity hours, but the second-widest range of the week, all of it downside.
That inversion flipped the spread negative (-€19.78) and made today the best BESS day so far: €140 gross from charging straight into the midday surplus and discharging into the evening peak — the one causally-reachable window after the charge.
If wind eases off this afternoon high, the cheap window could shift. And if it falls hard towards evening instead, the ceiling could lift fast.
Half-hourly data — 2026-06-12
| Period | Time | Price (€/MWh) | Wind % |
|---|---|---|---|
| 1 | 23:00 | 126.08 | 46.6% |
| 2 | 23:30 | 120.00 | 47.2% |
| 3 | 00:00 | 110.30 | 56.8% |
| 4 | 00:30 | 107.00 | 55.5% |
| 5 | 01:00 | 102.00 | 56.6% |
| 6 | 01:30 | 98.78 | 58.3% |
| 7 | 02:00 | 97.83 | 61.2% |
| 8 | 02:30 | 93.55 | 61.6% |
| 9 | 03:00 | 91.00 | 60.6% |
| 10 | 03:30 | 90.95 | 62.0% |
| 11 | 04:00 | 92.10 | 63.4% |
| 12 | 04:30 | 92.10 | 63.3% |
| 13 | 05:00 | 100.01 | 60.9% |
| 14 | 05:30 | 101.30 | 61.4% |
| 15 | 06:00 | 115.46 | 59.7% |
| 16 | 06:30 | 118.82 | 61.2% |
| 17 | 07:00 | 131.14 | 58.6% |
| 18 | 07:30 | 136.16 | 57.9% |
| 19 | 08:00 | 132.68 | 57.4% |
| 20 | 08:30 | 128.00 | 55.6% |
| 21 | 09:00 | 122.10 | 54.6% |
| 22 | 09:30 | 119.00 | 54.8% |
| 23 | 10:00 | 98.35 | 55.9% |
| 24 | 10:30 | 93.95 | 56.3% |
| 25 | 11:00 | 77.00 | 56.7% |
| 26 | 11:30 | 71.42 | 54.2% |
| 27 | 12:00 | 55.32 | 54.3% |
| 28 | 12:30 | 53.32 | 54.8% |
| 29 | 13:00 | 34.85 | 54.1% |
| 30 | 13:30 | 32.46 | 54.1% |
| 31 | 14:00 | 28.87 | 56.9% |
| 32 | 14:30 | 28.87 | 54.5% |
| 33 | 15:00 | 28.17 | 52.6% |
| 34 | 15:30 | 28.43 | 51.5% |
| 35 | 16:00 | 44.05 | 48.8% |
| 36 | 16:30 | 54.13 | 47.2% |
| 37 | 17:00 | 77.00 | 46.3% |
| 38 | 17:30 | 81.35 | 48.4% |
| 39 | 18:00 | 96.00 | 52.4% |
| 40 | 18:30 | 97.92 | 55.5% |
| 41 | 19:00 | 107.00 | 55.5% |
| 42 | 19:30 | 112.01 | 53.9% |
| 43 | 20:00 | 114.18 | 52.0% |
| 44 | 20:30 | 114.19 | 50.3% |
| 45 | 21:00 | 117.73 | 48.4% |
| 46 | 21:30 | 116.70 | 49.0% |
| 47 | 22:00 | 111.15 | 47.4% |
| 48 | 22:30 | 107.00 | 44.6% |
Compare your business electricity and gas rates in minutes with INIS Energy Brokers.
Compare rates