I-SEM Daily Briefing — 13 June 2026
Table of Contents
Market Snapshot
| Metric | Value |
|---|---|
| Mean DAM Price | €82.51/MWh |
| Median Price | €55.84/MWh |
| Std Dev | €56.56/MWh |
| Peak Price | €222.56/MWh (22:00) |
| Min Price | €34.96/MWh (14:30) |
| Price Range | €187.6/MWh |
| Periods above €150 | 8 of 48 (17%) |
| Periods above €200 | 4 of 48 (8%) |
| Peak Avg (07–22) | €87.02/MWh |
| Off-peak Avg (22–07) | €74.99/MWh |
| Peak/Off-Peak Spread | €12.03/MWh |
| Wind % of Demand | 24.4% |
| Wind Range | 4.3%–48.1% |
| Mean Demand | 3453 MW |
Price Profile #
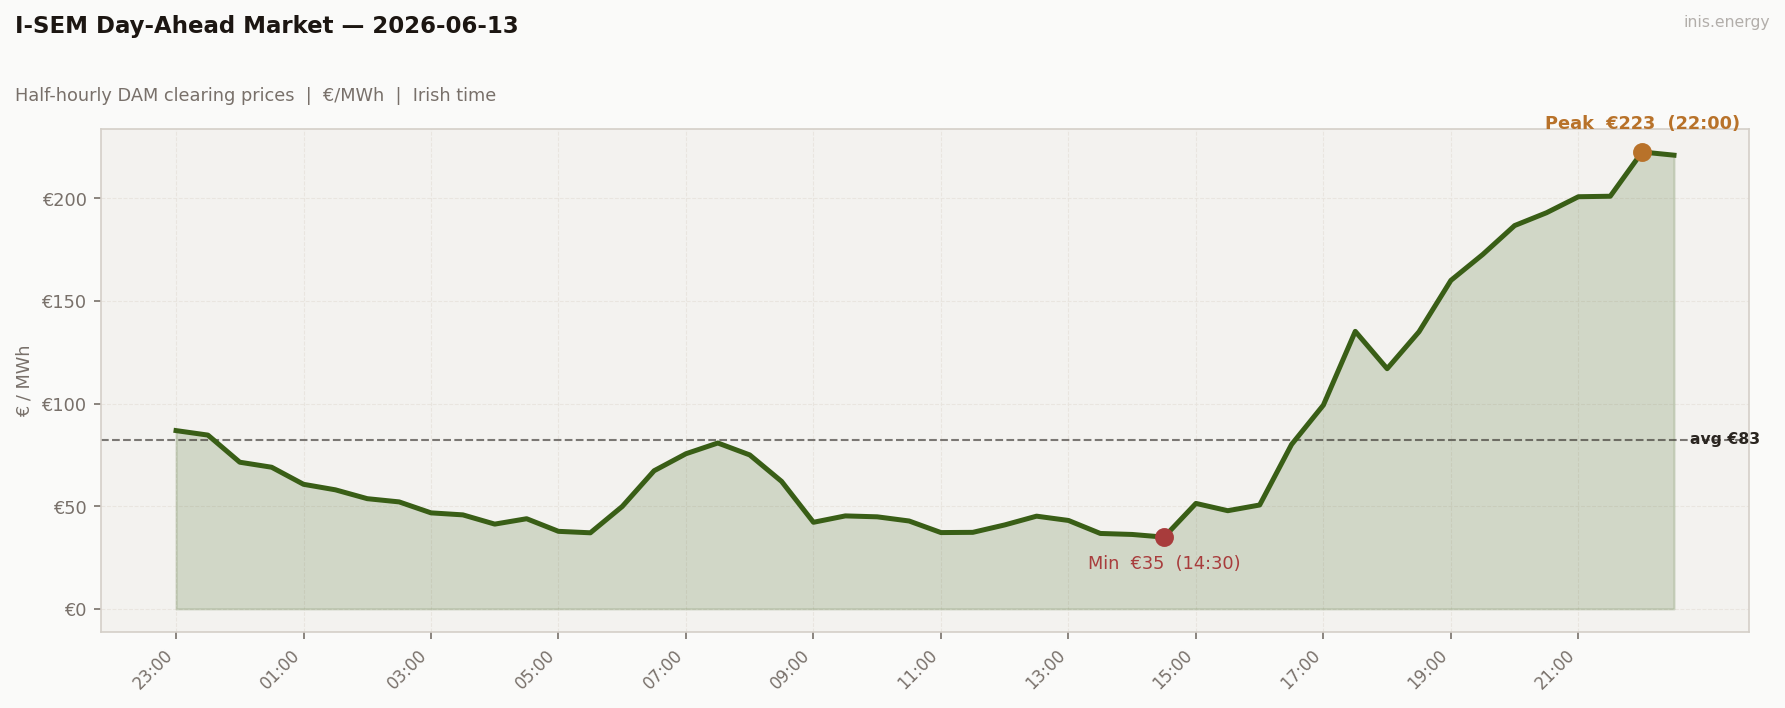
Std dev €56.56/MWh · Median €55.84/MWh · Periods above €150: 8 of 48 (17%)
Today has two faces. With wind in the 20-48% range through the afternoon, prices sit cheap and flat, bottoming at €34.96 (14:30). Then wind falls off a cliff — from 13.6% at 17:30 to just 4.3% by 21:00 — and price responds violently: €135.18 (17:30) → €222.56 (22:00), the steepest climb of the week.
Price vs Wind #
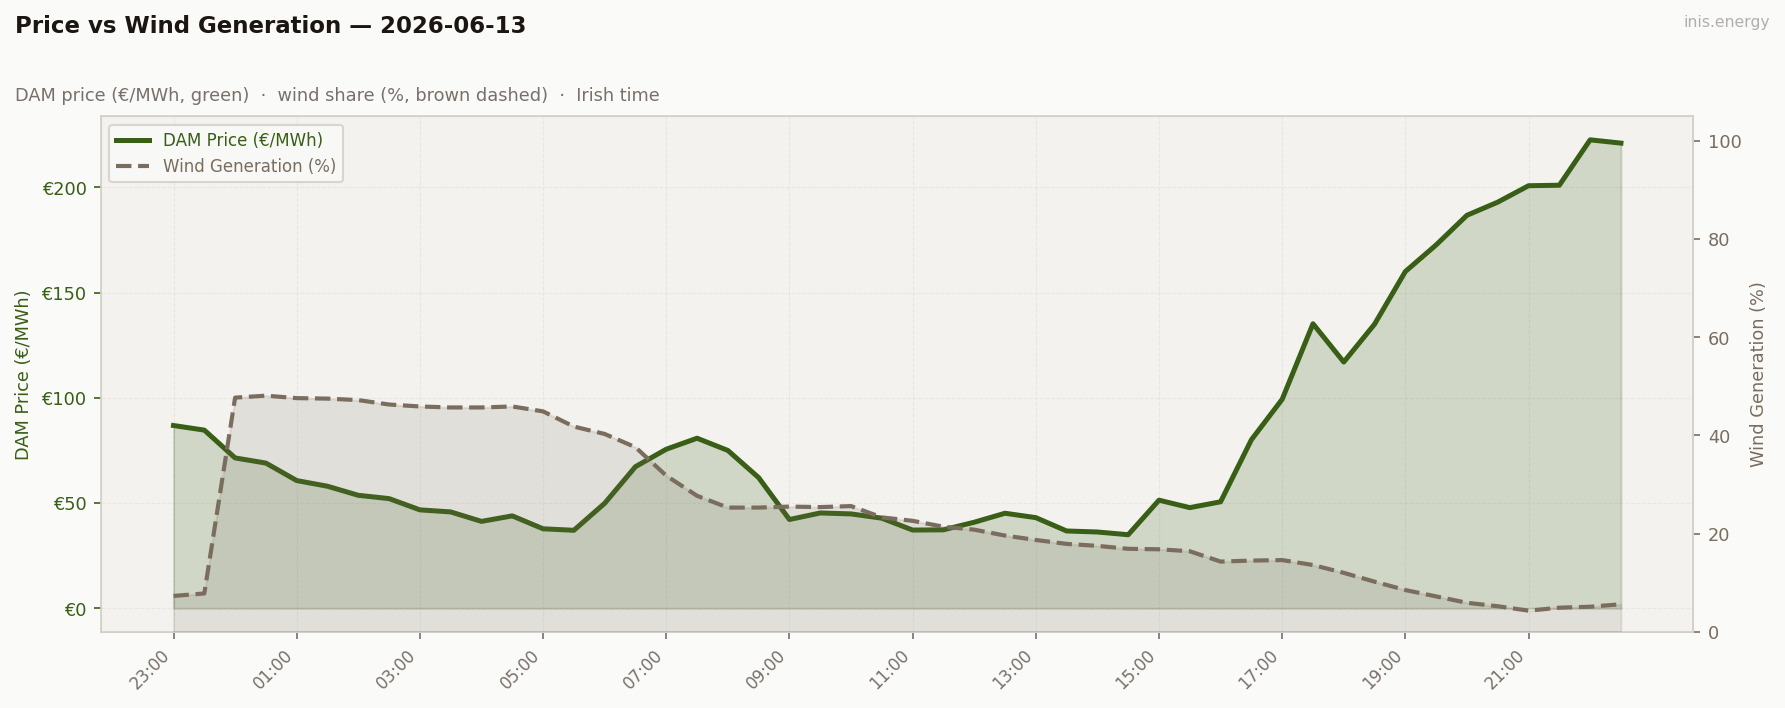
Mean wind: 24.4% · Range: 4.3%–48.1%
The morning and afternoon show wind doing its usual job — 20-48%, prices cheap and flat. The evening is the story: wind collapses to single digits exactly as the market needs it most, and instead of the usual gentle evening shape, gas scrambles to cover the gap and the price more than doubles in four hours.
Week in Context #
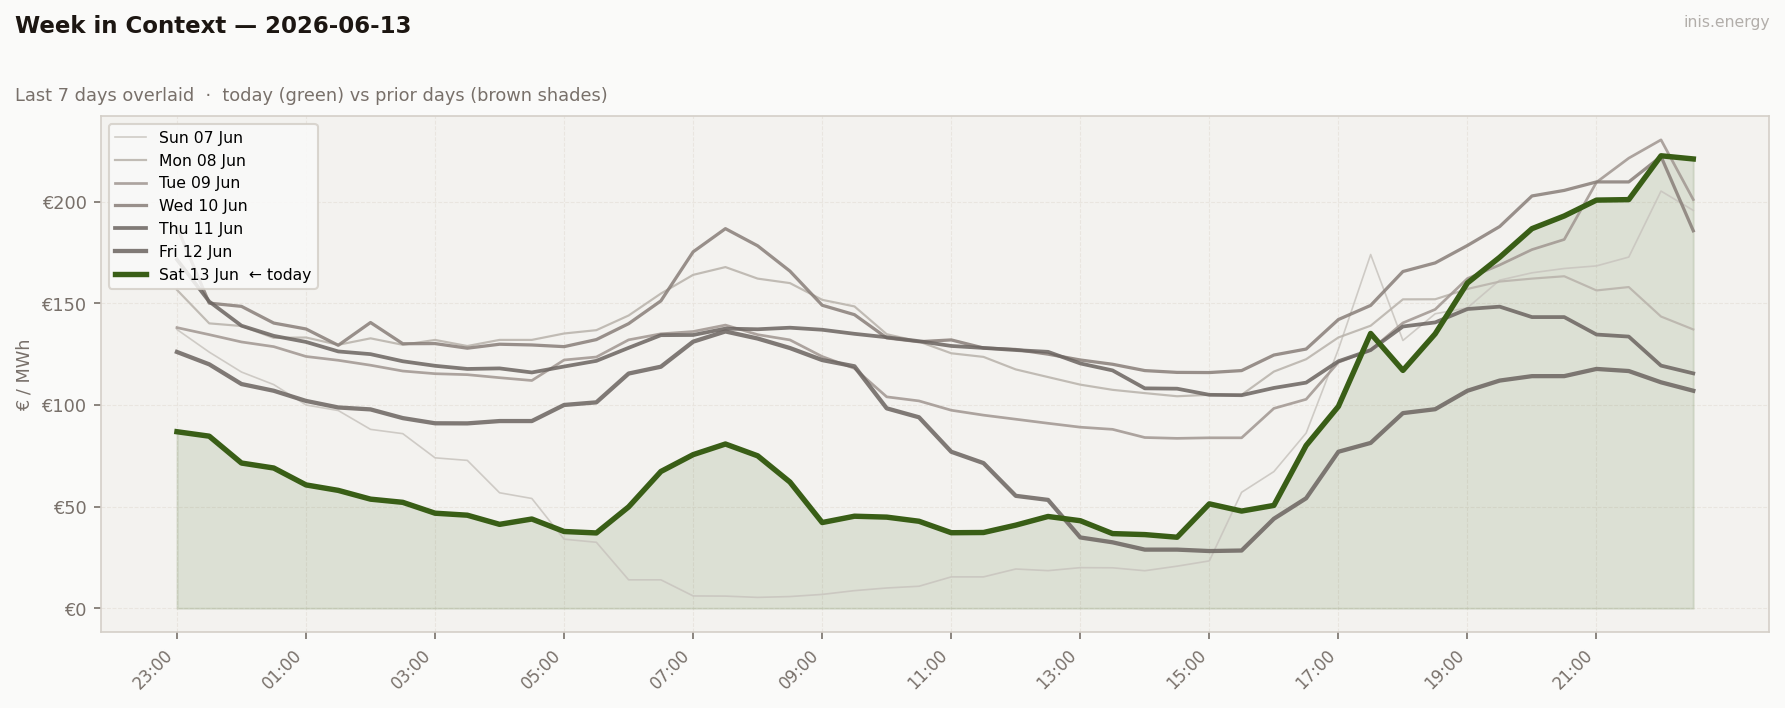
The median (€55.84) is barely a third of where the peak sits, and well below the mean (€82.51) — a day skewed hard by a handful of expensive hours. After two flat, wind-heavy days, this is the first real spike of the week.
Price Duration Curve #
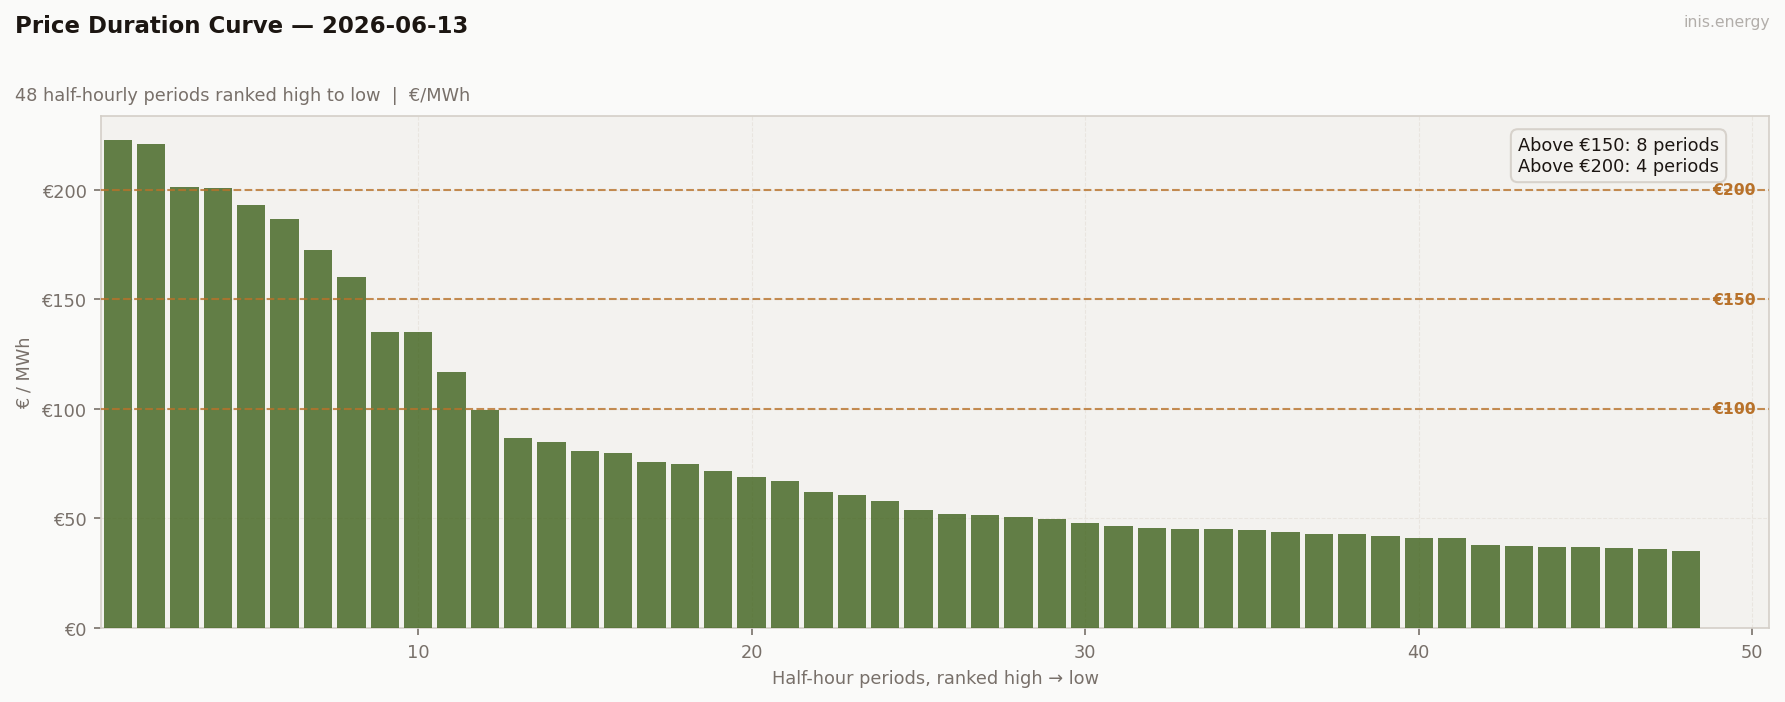
Periods above €150: 8 (17% of day) · Above €200: 4 (8% of day)
Only 8 periods above €150 and 4 above €200, but the range is €187.6 — second-widest of the week. This curve is mostly a long, cheap plateau with a sharp tail at the very end.
Peak / Off-Peak Spread #
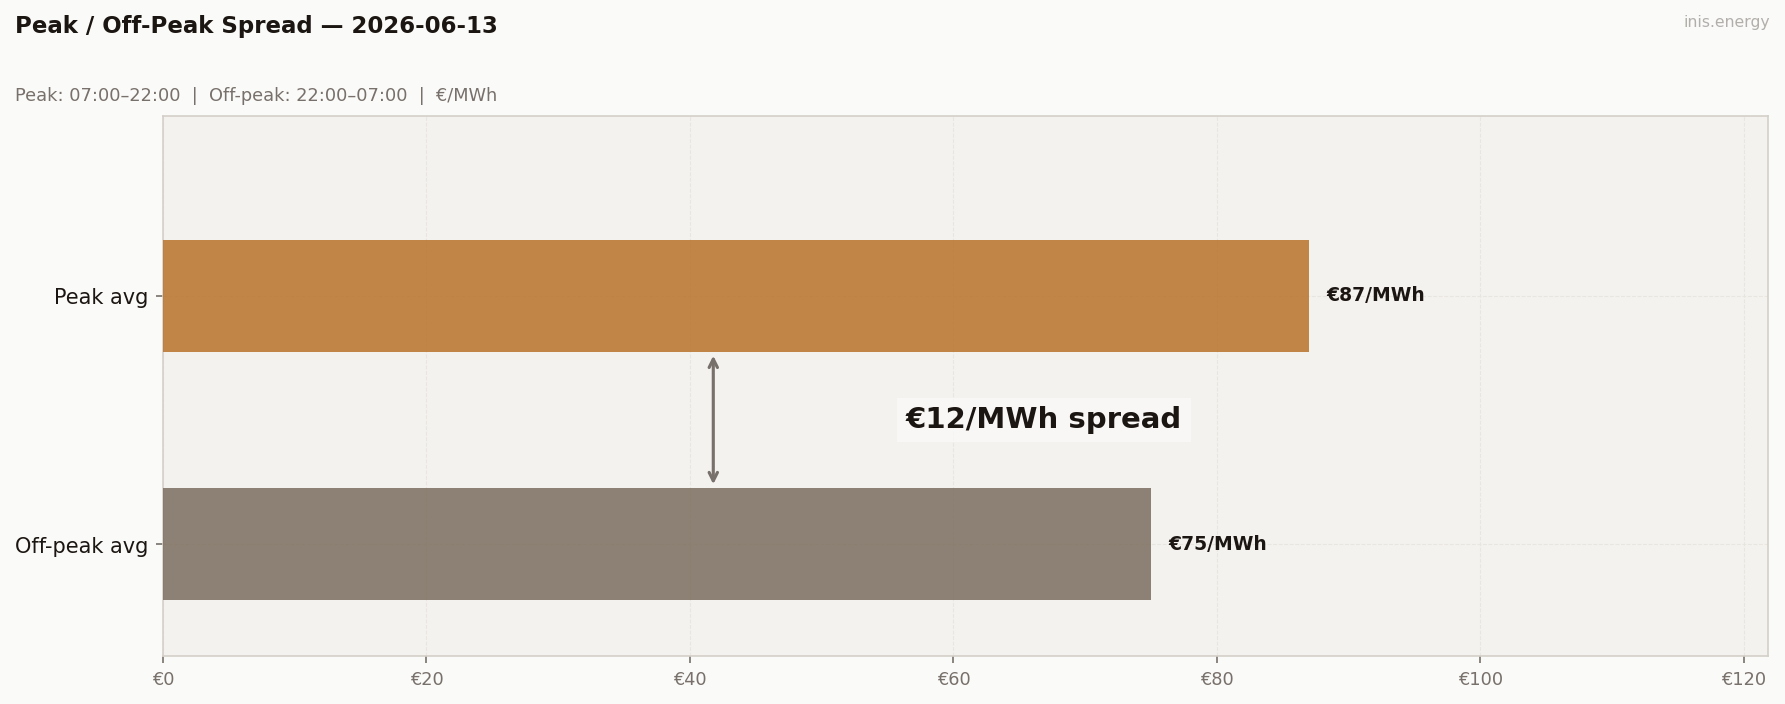
Peak avg (07:00–22:00): €87.02/MWh · Off-peak avg: €74.99/MWh · Spread: €12.03/MWh
A small but positive spread, unlike yesterday’s inversion. The evening spike sits right at the edge of the peak window, pulling its average up just enough to beat off-peak — but most of the day’s cheapness also falls inside the peak window, so the two effects roughly cancel out.
BESS Dispatch Signal #
| Price | Time | Energy | Value | |
|---|---|---|---|---|
| Charge | €38/MWh | 13:00 | 2 MWh | −€76 |
| Discharge | €211/MWh | 21:00 | 1.7 MWh (85% RTE) | +€359 |
| Gross profit | €284 | |||
| Price spread | €174/MWh | ROI: 375.7% |
Simulated 1MW/2MWh battery, one optimal DAM cycle. Gross before network charges and capacity costs.
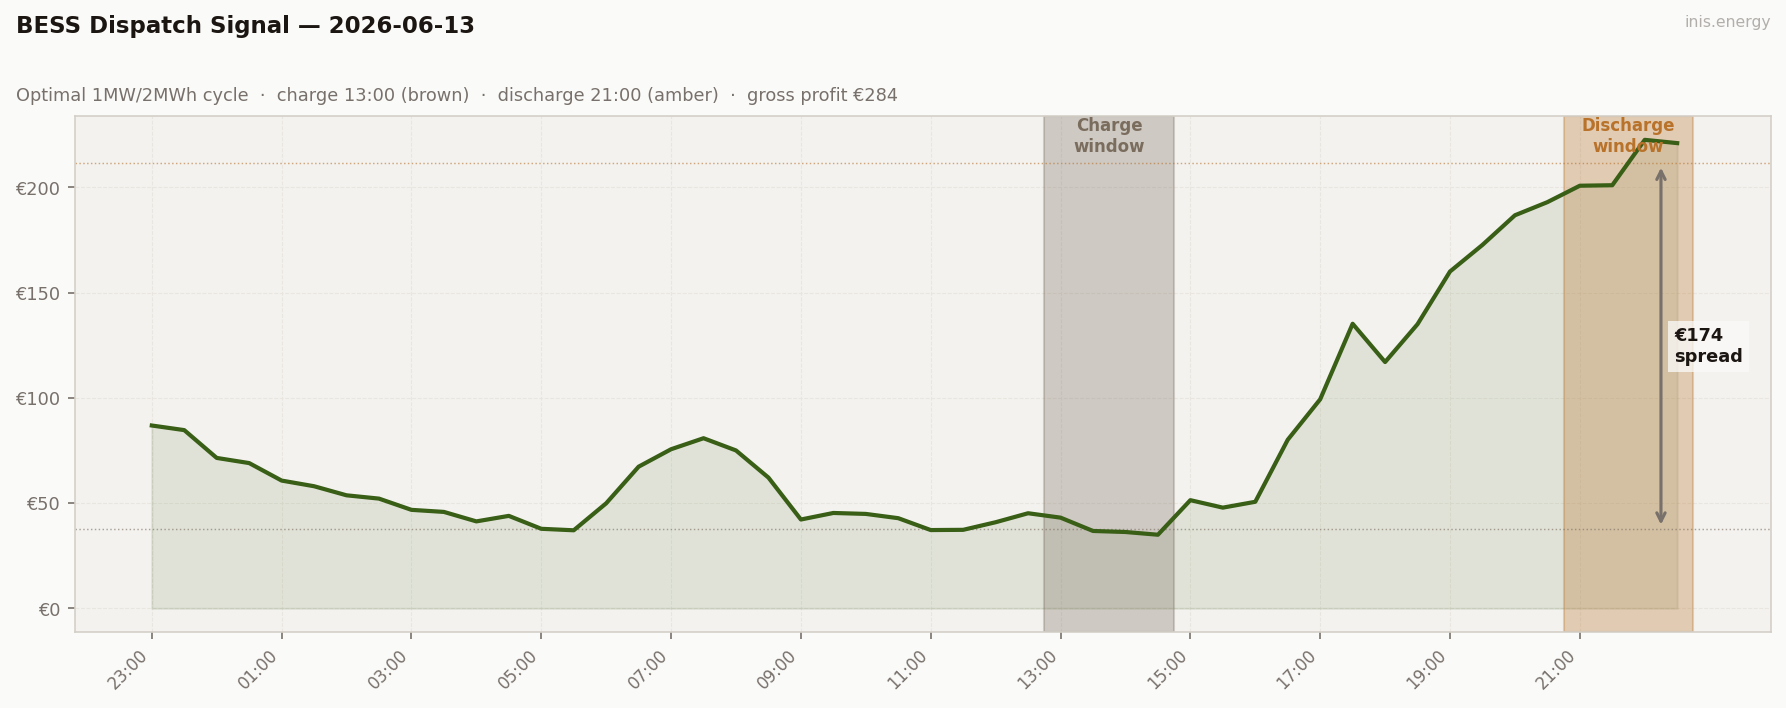
€284 gross, ROI 375.7% — the best day of the week by a wide margin. Charging at €38 into the afternoon trough and discharging at €211 into the evening wind-collapse spike captures almost the entire daily range.
Commentary #
A long, cheap afternoon on the back of 20-48% wind, then a violent reversal: wind falls to 4.3% by 21:00 and the price more than doubles in four hours, peaking at €222.56.
That collapse made today the best BESS day of the week — €284 gross, more than double yesterday’s already-strong result. Storage doesn’t care which half of the day the volatility lands in, only that it’s there.
Wind closed the day at just 5.6%. If that holds into tomorrow, expect the ceiling to stay high rather than reset.
Half-hourly data — 2026-06-13
| Period | Time | Price (€/MWh) | Wind % |
|---|---|---|---|
| 1 | 23:00 | 86.85 | 7.3% |
| 2 | 23:30 | 84.66 | 7.8% |
| 3 | 00:00 | 71.45 | 47.7% |
| 4 | 00:30 | 69.00 | 48.1% |
| 5 | 01:00 | 60.69 | 47.6% |
| 6 | 01:30 | 58.00 | 47.5% |
| 7 | 02:00 | 53.69 | 47.2% |
| 8 | 02:30 | 52.12 | 46.3% |
| 9 | 03:00 | 46.78 | 45.9% |
| 10 | 03:30 | 45.80 | 45.7% |
| 11 | 04:00 | 41.30 | 45.7% |
| 12 | 04:30 | 43.92 | 45.9% |
| 13 | 05:00 | 37.78 | 44.9% |
| 14 | 05:30 | 37.07 | 41.8% |
| 15 | 06:00 | 49.89 | 40.3% |
| 16 | 06:30 | 67.29 | 37.6% |
| 17 | 07:00 | 75.58 | 31.8% |
| 18 | 07:30 | 80.81 | 27.7% |
| 19 | 08:00 | 75.00 | 25.3% |
| 20 | 08:30 | 62.10 | 25.3% |
| 21 | 09:00 | 42.19 | 25.5% |
| 22 | 09:30 | 45.30 | 25.4% |
| 23 | 10:00 | 44.85 | 25.6% |
| 24 | 10:30 | 42.82 | 23.3% |
| 25 | 11:00 | 37.18 | 22.6% |
| 26 | 11:30 | 37.29 | 21.4% |
| 27 | 12:00 | 40.90 | 20.8% |
| 28 | 12:30 | 45.17 | 19.6% |
| 29 | 13:00 | 43.08 | 18.7% |
| 30 | 13:30 | 36.75 | 17.9% |
| 31 | 14:00 | 36.26 | 17.5% |
| 32 | 14:30 | 34.96 | 16.9% |
| 33 | 15:00 | 51.38 | 16.8% |
| 34 | 15:30 | 47.83 | 16.4% |
| 35 | 16:00 | 50.61 | 14.3% |
| 36 | 16:30 | 80.07 | 14.5% |
| 37 | 17:00 | 99.30 | 14.6% |
| 38 | 17:30 | 135.18 | 13.6% |
| 39 | 18:00 | 117.00 | 12.0% |
| 40 | 18:30 | 135.00 | 10.2% |
| 41 | 19:00 | 160.01 | 8.5% |
| 42 | 19:30 | 172.65 | 7.2% |
| 43 | 20:00 | 186.72 | 5.9% |
| 44 | 20:30 | 192.96 | 5.2% |
| 45 | 21:00 | 200.76 | 4.3% |
| 46 | 21:30 | 201.00 | 4.9% |
| 47 | 22:00 | 222.56 | 5.1% |
| 48 | 22:30 | 221.00 | 5.6% |
Compare your business electricity and gas rates in minutes with INIS Energy Brokers.
Compare rates