I-SEM Daily Briefing — 14 June 2026
Table of Contents
Market Snapshot
| Metric | Value |
|---|---|
| Mean DAM Price | €190.43/MWh |
| Median Price | €185.63/MWh |
| Std Dev | €47.65/MWh |
| Peak Price | €306.57/MWh (03:00) |
| Min Price | €115.09/MWh (14:30) |
| Price Range | €191.48/MWh |
| Periods above €150 | 38 of 48 (79%) |
| Periods above €200 | 17 of 48 (35%) |
| Peak Avg (07–22) | €168.01/MWh |
| Off-peak Avg (22–07) | €227.81/MWh |
| Peak/Off-Peak Spread | €-59.8/MWh |
| Wind % of Demand | 21.7% |
| Wind Range | 8.2%–40.7% |
| Mean Demand | 3365 MW |
Price Profile #
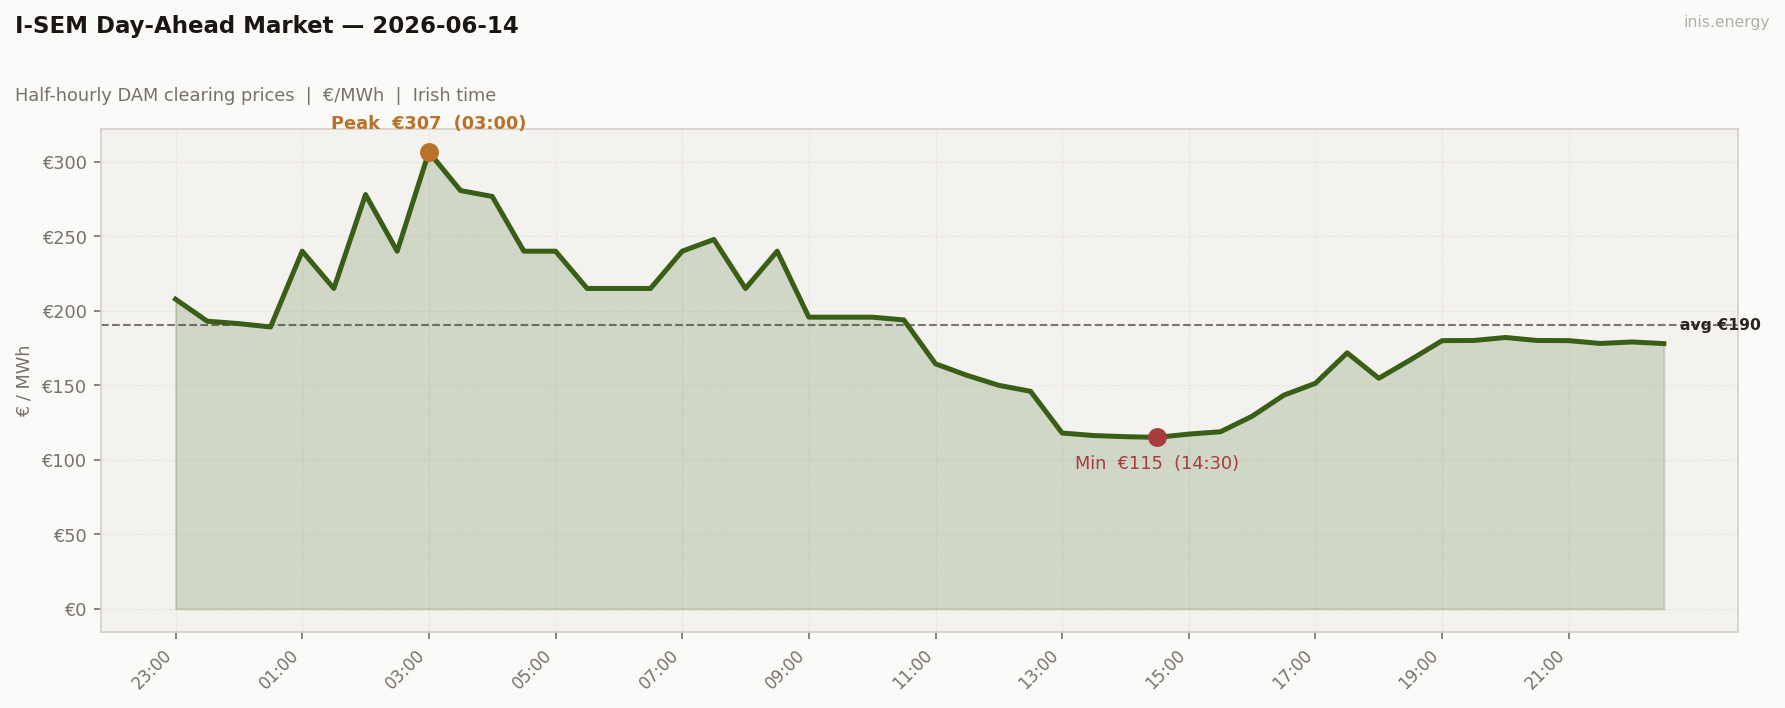
Std dev €47.65/MWh · Median €185.63/MWh · Periods above €150: 38 of 48 (79%)
Yesterday’s evening wind collapse carries straight through into tonight’s small hours. Wind bottoms at 8.2% at 00:00, and the price responds immediately — climbing from €191.40 to a peak of €306.57 at 03:00, the highest price of the week by a wide margin. Prices stay elevated (€215-280) through the overnight and into the morning, only easing once wind recovers past 20% after lunch, bottoming at €115.09 (14:30) before settling into a steady €178-182 through the evening.
Price vs Wind #
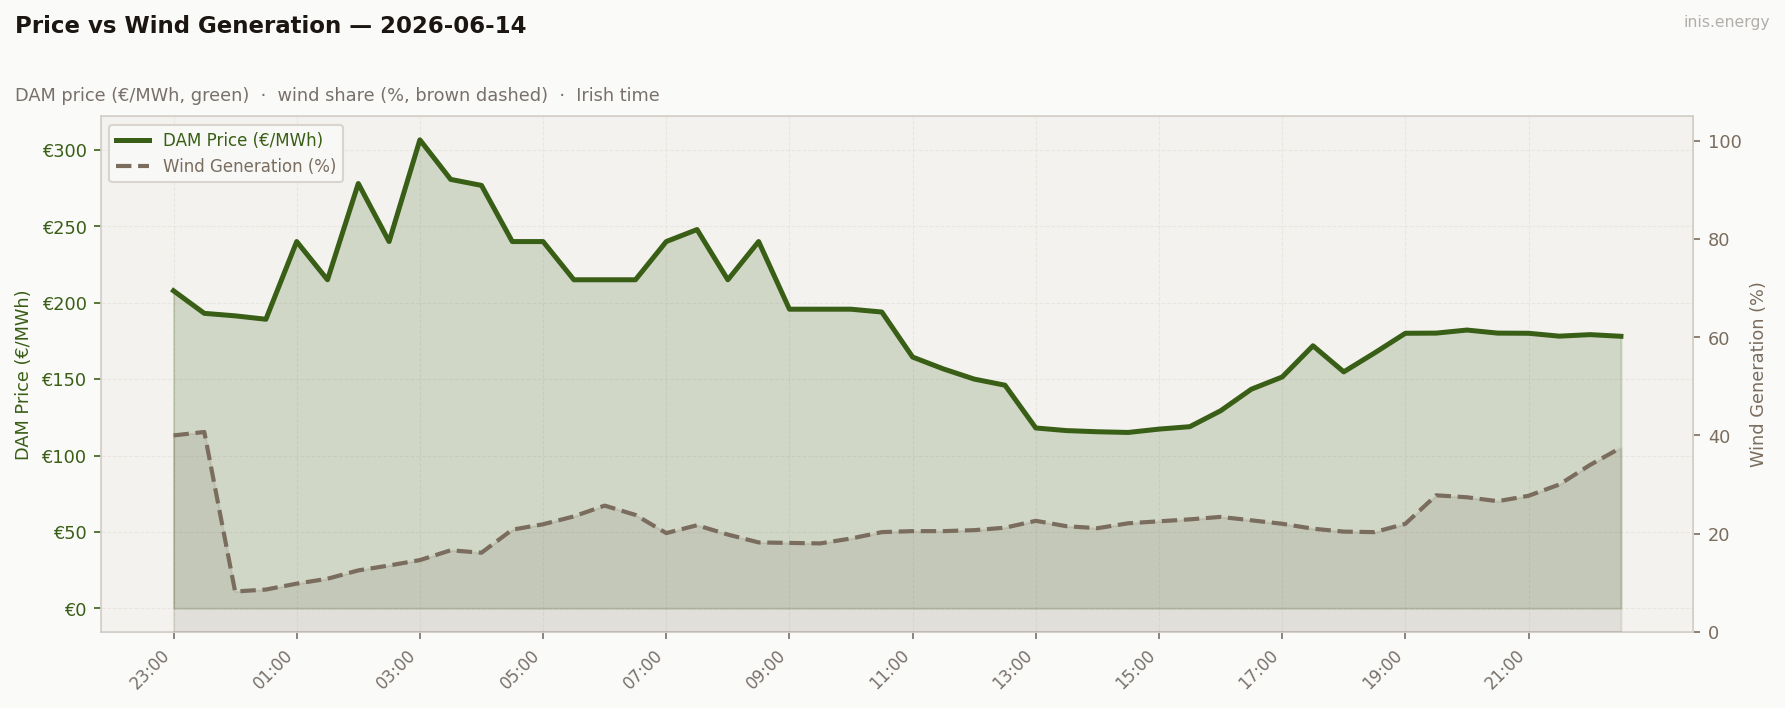
Mean wind: 21.7% · Range: 8.2%–40.7%
Wind sits below 15% for the first nine periods of the day (00:00-04:00) — exactly when the price peaks. This is the same collapse seen at the end of yesterday, simply continuing into the small hours. Once wind recovers above 20% after lunch, prices ease to the day’s only relief, €115.09, before climbing back as evening demand returns.
Week in Context #
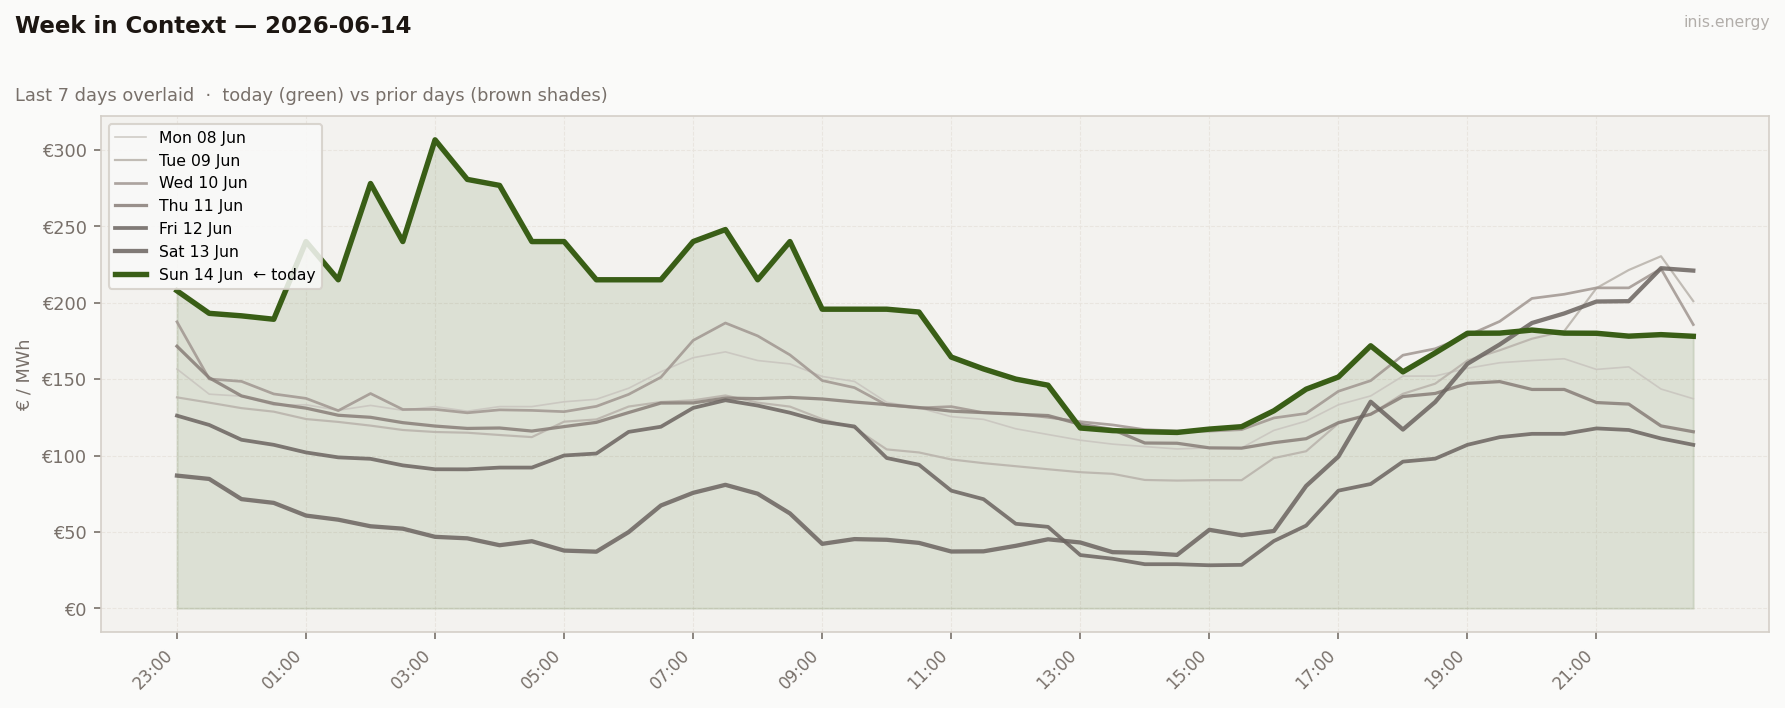
Highest mean (€190.43), highest peak (€306.57), and the widest range (€191.48) of the week — all driven by the same low-wind stretch that began yesterday evening. Two consecutive low-wind days have bookended the week with its two most expensive spikes.
Price Duration Curve #
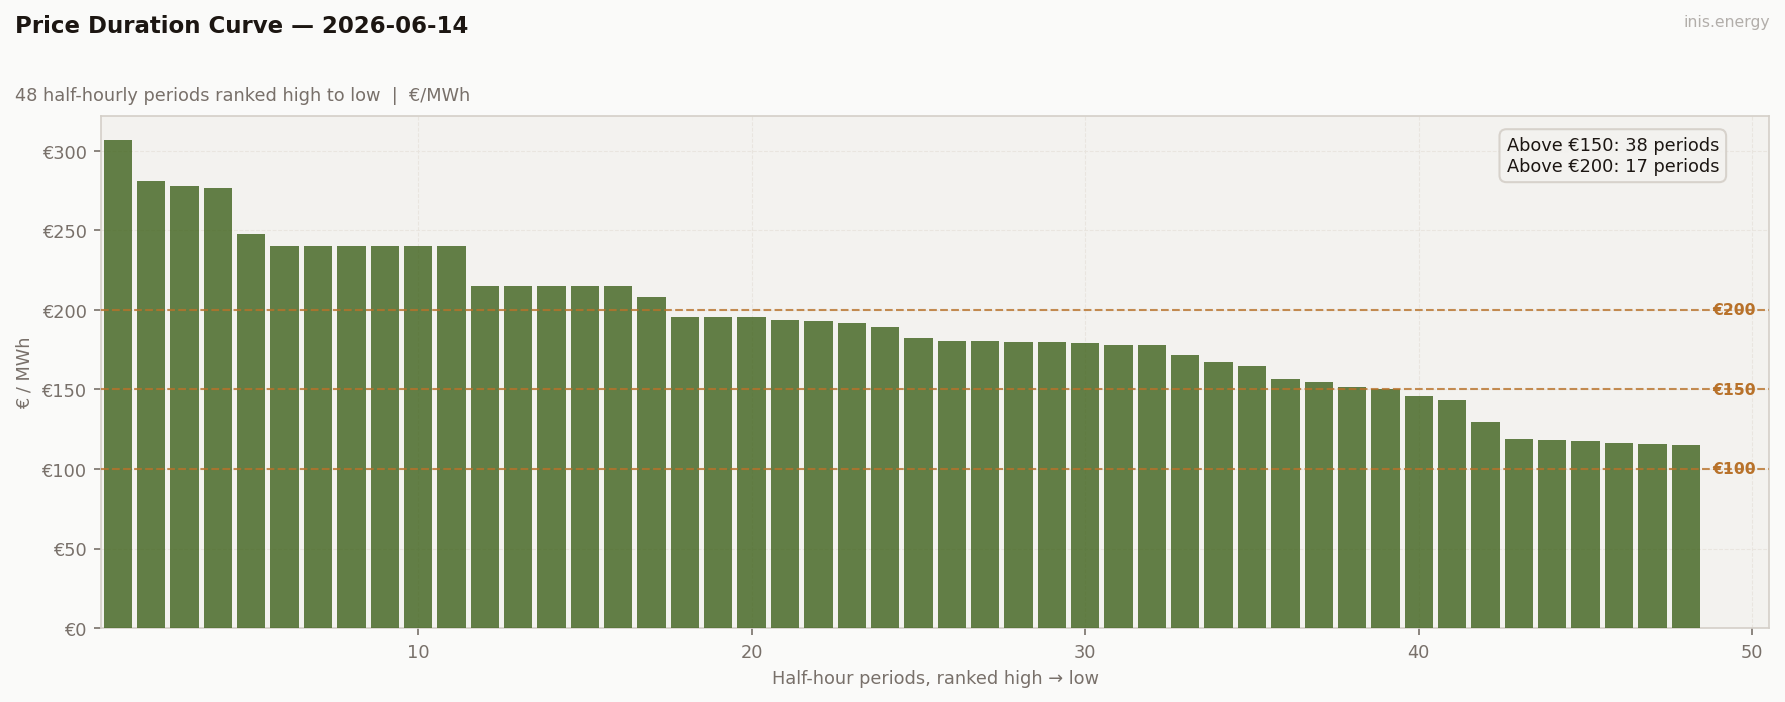
Periods above €150: 38 (79% of day) · Above €200: 17 (35% of day)
38 of 48 periods clear €150 and 17 clear €200 — by far the most scarcity-heavy curve of the week. This is a flat-and-high day with a long expensive plateau, not a single spike.
Peak / Off-Peak Spread #
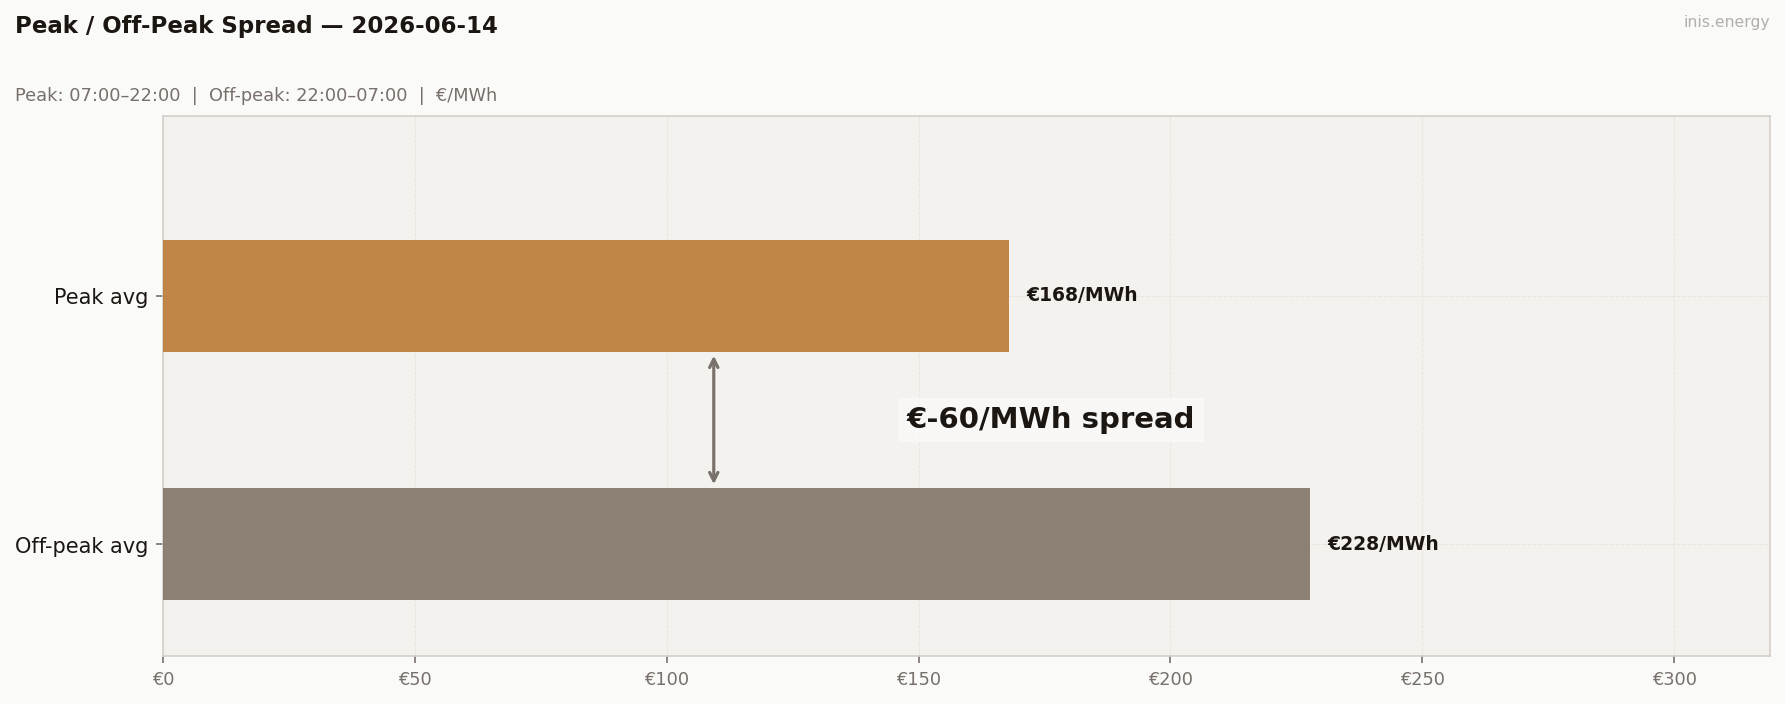
Peak avg (07:00–22:00): €168.01/MWh · Off-peak avg: €227.81/MWh · Spread: €-59.8/MWh
A sharply negative spread: -€59.8. Off-peak (€227.81) is the most expensive window of the entire week, while peak (€168.01) — still high in its own right — looks cheap by comparison. The overnight scarcity hours fall entirely inside the off-peak window, inverting the usual relationship.
BESS Dispatch Signal #
| Price | Time | Energy | Value | |
|---|---|---|---|---|
| Charge | €116/MWh | 13:30 | 2 MWh | −€232 |
| Discharge | €181/MWh | 19:00 | 1.7 MWh (85% RTE) | +€307 |
| Gross profit | €75 | |||
| Price spread | €65/MWh | ROI: 32.2% |
Simulated 1MW/2MWh battery, one optimal DAM cycle. Gross before network charges and capacity costs.
Updated 2026-08-25: the BESS simulation previously allowed the discharge window to occur before the charge window ended, which is physically impossible for a battery. This day’s figure was recalculated enforcing charge-before-discharge; gross profit corrected from €238 to €75.
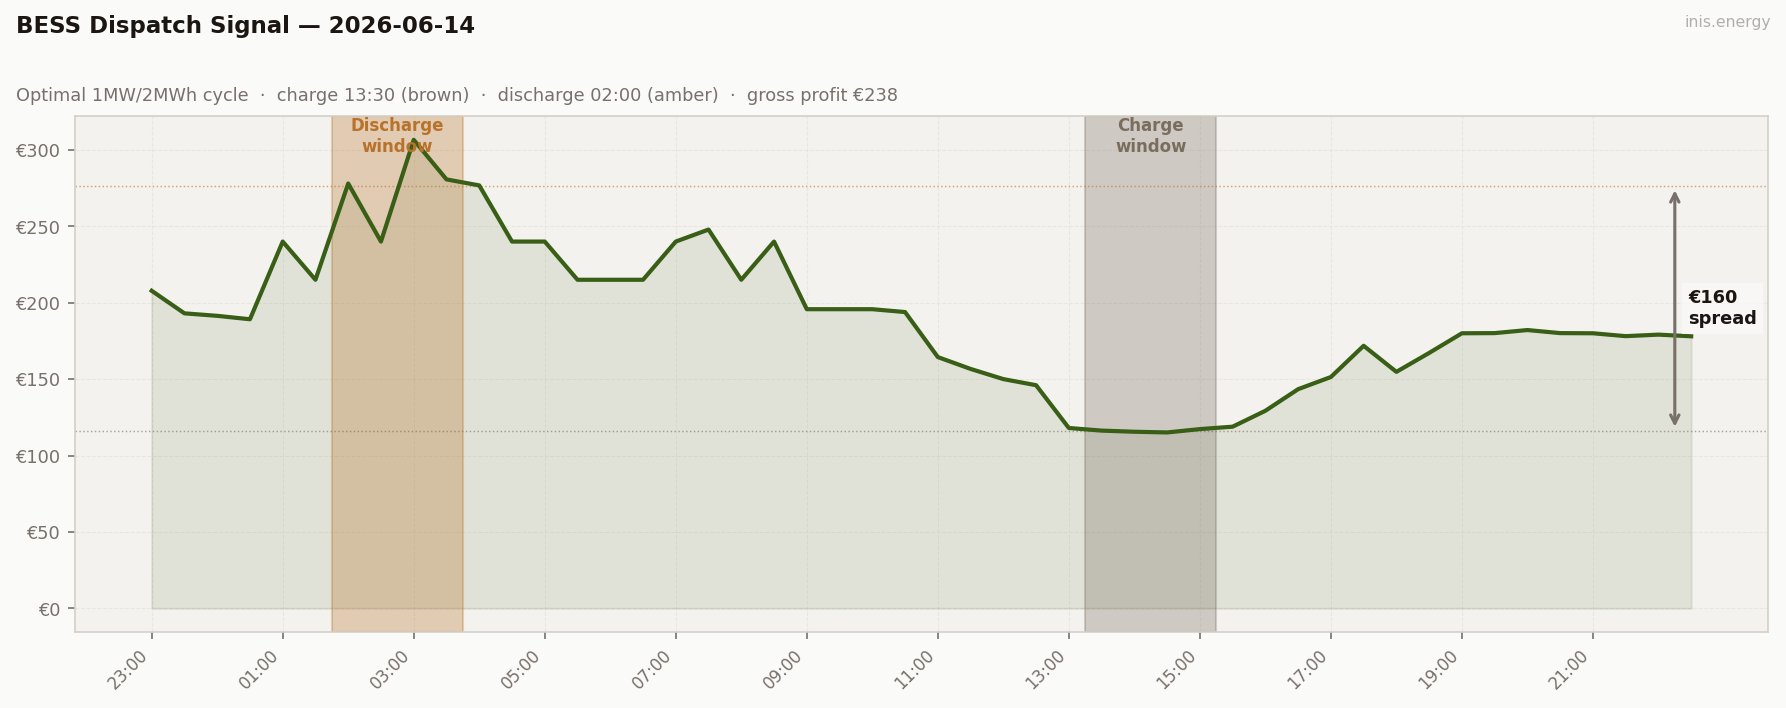
€75 gross, ROI 32.2%. Charging at €116 in the afternoon lull and discharging at €181 into the 19:00 evening peak — the day’s real overnight scarcity spike (€276 at 02:00) fell before the charge window, so a same-day cycle couldn’t reach it.
Commentary #
An 8.2% wind floor at midnight set off the highest price of the week — €306.57 at 03:00 — and kept the overnight hours expensive for the rest of the night. The only relief came after lunch, once wind climbed back past 20% and the price eased to €115.09.
Storage caught only part of it: €75 gross. The overnight scarcity spike was the day’s real story, but it landed before the afternoon charge window closed, so a same-day cycle could only reach the evening peak, not the 03:00 record.
The pattern this week has been consistent — when wind falls away, the ceiling lifts and storage gets paid. Worth watching whether wind recovers into next week, or whether this becomes the new normal.
Half-hourly data — 2026-06-14
| Period | Time | Price (€/MWh) | Wind % |
|---|---|---|---|
| 1 | 23:00 | 207.80 | 40.0% |
| 2 | 23:30 | 193.03 | 40.7% |
| 3 | 00:00 | 191.40 | 8.2% |
| 4 | 00:30 | 189.16 | 8.6% |
| 5 | 01:00 | 240.00 | 9.8% |
| 6 | 01:30 | 215.00 | 10.8% |
| 7 | 02:00 | 278.00 | 12.5% |
| 8 | 02:30 | 240.00 | 13.5% |
| 9 | 03:00 | 306.57 | 14.6% |
| 10 | 03:30 | 280.68 | 16.6% |
| 11 | 04:00 | 276.75 | 16.1% |
| 12 | 04:30 | 240.00 | 20.8% |
| 13 | 05:00 | 240.00 | 21.9% |
| 14 | 05:30 | 215.00 | 23.5% |
| 15 | 06:00 | 215.00 | 25.7% |
| 16 | 06:30 | 215.00 | 23.8% |
| 17 | 07:00 | 240.00 | 20.1% |
| 18 | 07:30 | 247.86 | 21.7% |
| 19 | 08:00 | 215.00 | 19.8% |
| 20 | 08:30 | 240.00 | 18.2% |
| 21 | 09:00 | 195.74 | 18.1% |
| 22 | 09:30 | 195.74 | 18.0% |
| 23 | 10:00 | 195.74 | 19.0% |
| 24 | 10:30 | 193.88 | 20.3% |
| 25 | 11:00 | 164.42 | 20.5% |
| 26 | 11:30 | 156.66 | 20.5% |
| 27 | 12:00 | 150.00 | 20.7% |
| 28 | 12:30 | 146.00 | 21.2% |
| 29 | 13:00 | 118.01 | 22.6% |
| 30 | 13:30 | 116.30 | 21.5% |
| 31 | 14:00 | 115.55 | 21.1% |
| 32 | 14:30 | 115.09 | 22.1% |
| 33 | 15:00 | 117.28 | 22.5% |
| 34 | 15:30 | 118.86 | 22.9% |
| 35 | 16:00 | 129.27 | 23.4% |
| 36 | 16:30 | 143.40 | 22.7% |
| 37 | 17:00 | 151.37 | 22.0% |
| 38 | 17:30 | 171.80 | 21.0% |
| 39 | 18:00 | 154.74 | 20.4% |
| 40 | 18:30 | 167.12 | 20.3% |
| 41 | 19:00 | 179.99 | 22.0% |
| 42 | 19:30 | 180.09 | 27.8% |
| 43 | 20:00 | 182.10 | 27.4% |
| 44 | 20:30 | 180.09 | 26.6% |
| 45 | 21:00 | 179.99 | 27.7% |
| 46 | 21:30 | 178.10 | 30.0% |
| 47 | 22:00 | 179.10 | 34.0% |
| 48 | 22:30 | 178.01 | 37.5% |
Compare your business electricity and gas rates in minutes with INIS Energy Brokers.
Compare rates