I-SEM Daily Briefing — 14 July 2026
·2 mins
Table of Contents
Market Snapshot
| Metric | Value |
|---|---|
| Mean DAM Price | €146.15/MWh |
| Median Price | €137.73/MWh |
| Std Dev | €25.65/MWh |
| Peak Price | €201.0/MWh (20:30) |
| Min Price | €110.01/MWh (14:30) |
| Price Range | €90.99/MWh |
| Periods above €150 | 17 of 48 (35%) |
| Periods above €200 | 1 of 48 (2%) |
| Peak Avg (07–22) | €147.14/MWh |
| Off-peak Avg (22–07) | €144.5/MWh |
| Peak/Off-Peak Spread | €2.64/MWh |
| Wind % of Demand | 25.6% |
| Wind Range | 15.2%–37.1% |
| Mean Demand | 3714 MW |
Price Profile #
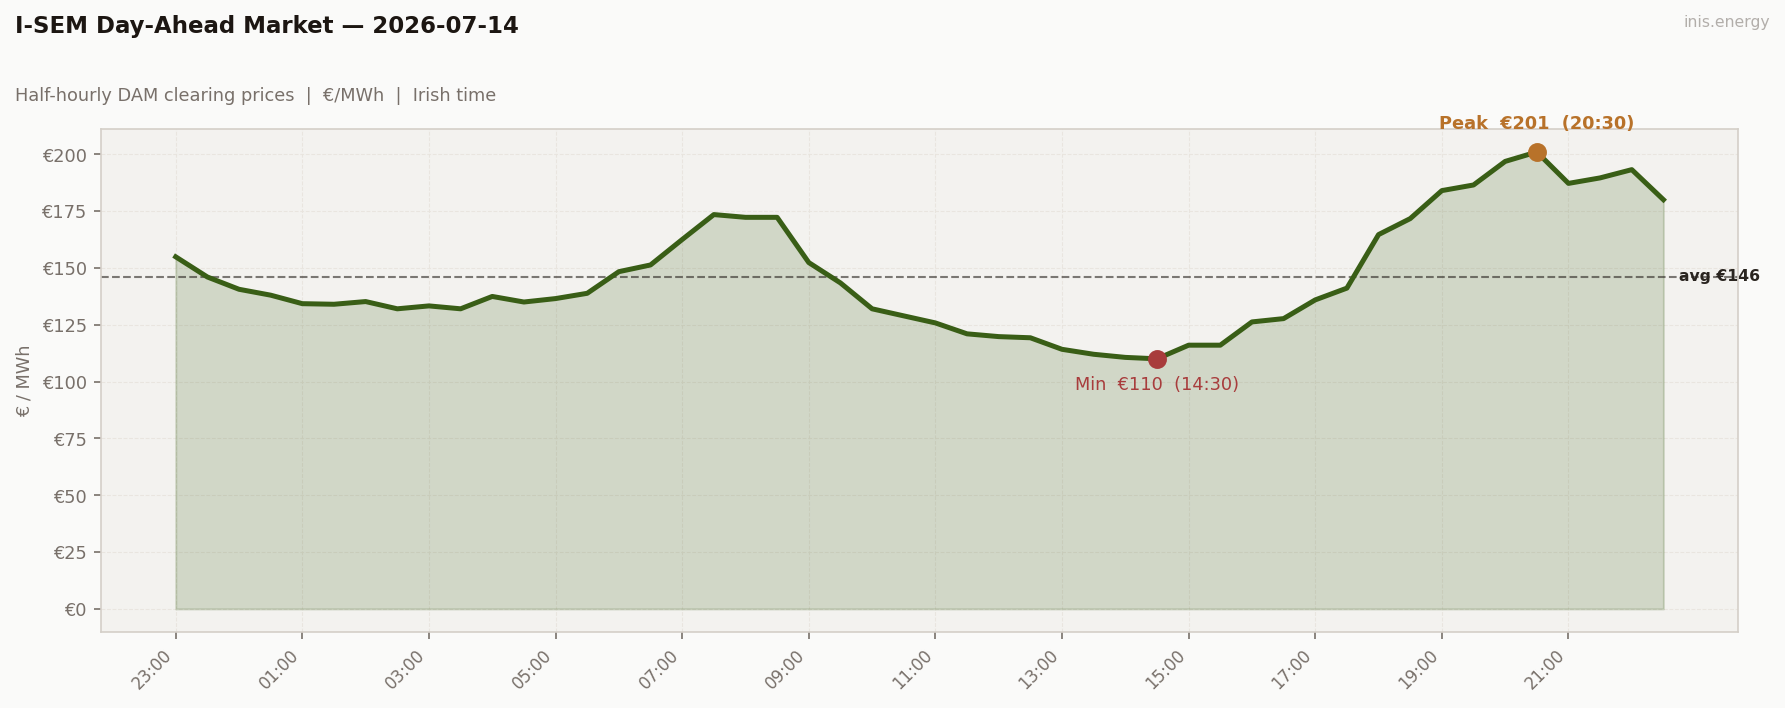
Std dev €25.65/MWh · Median €137.73/MWh · Periods above €150: 17 of 48 (35%)
Price vs Wind #
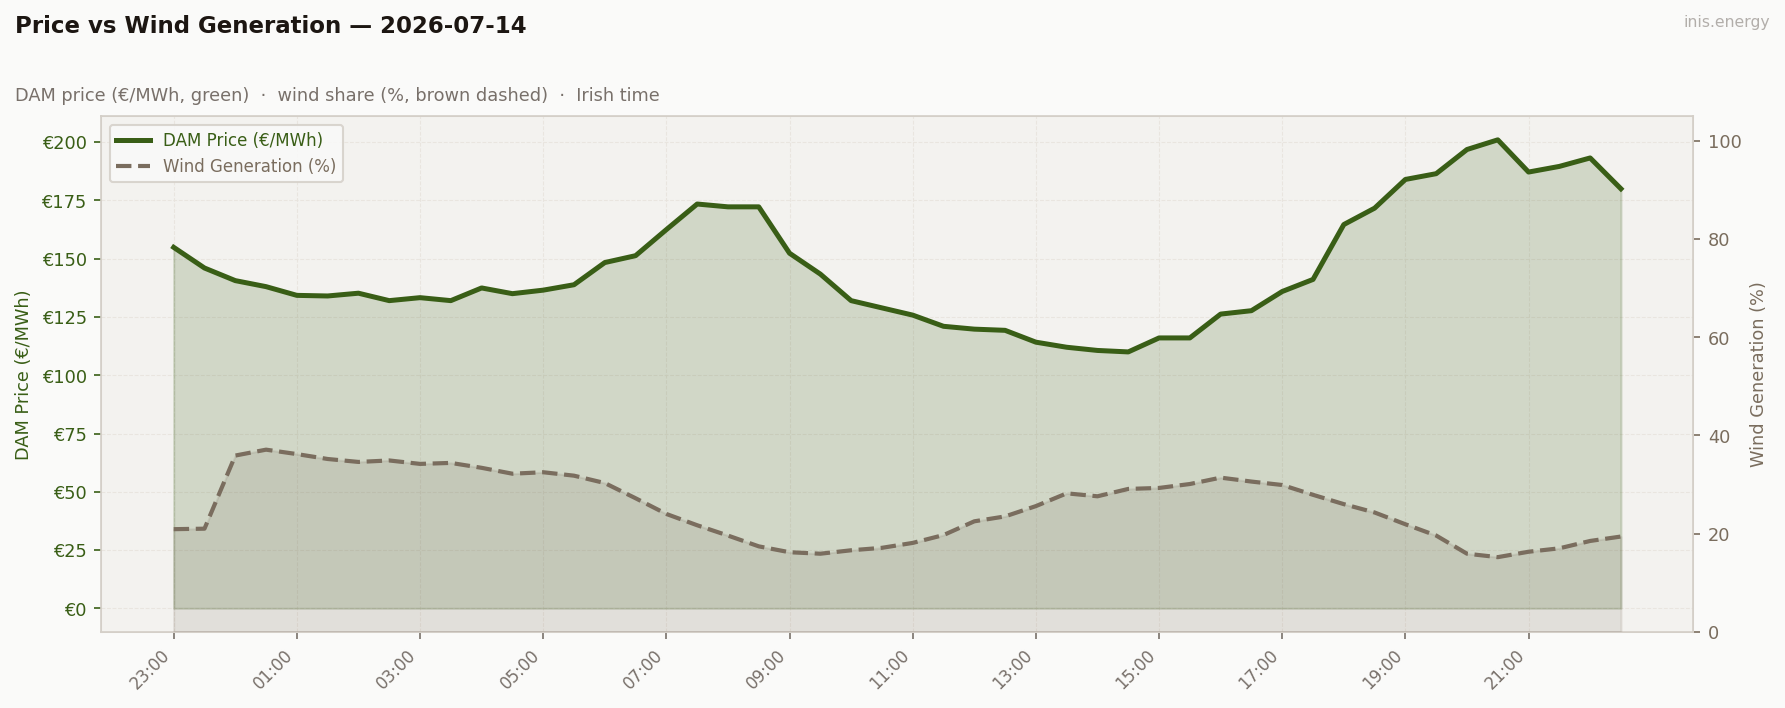
Mean wind: 25.6% · Range: 15.2%–37.1%
Week in Context #
Price Duration Curve #
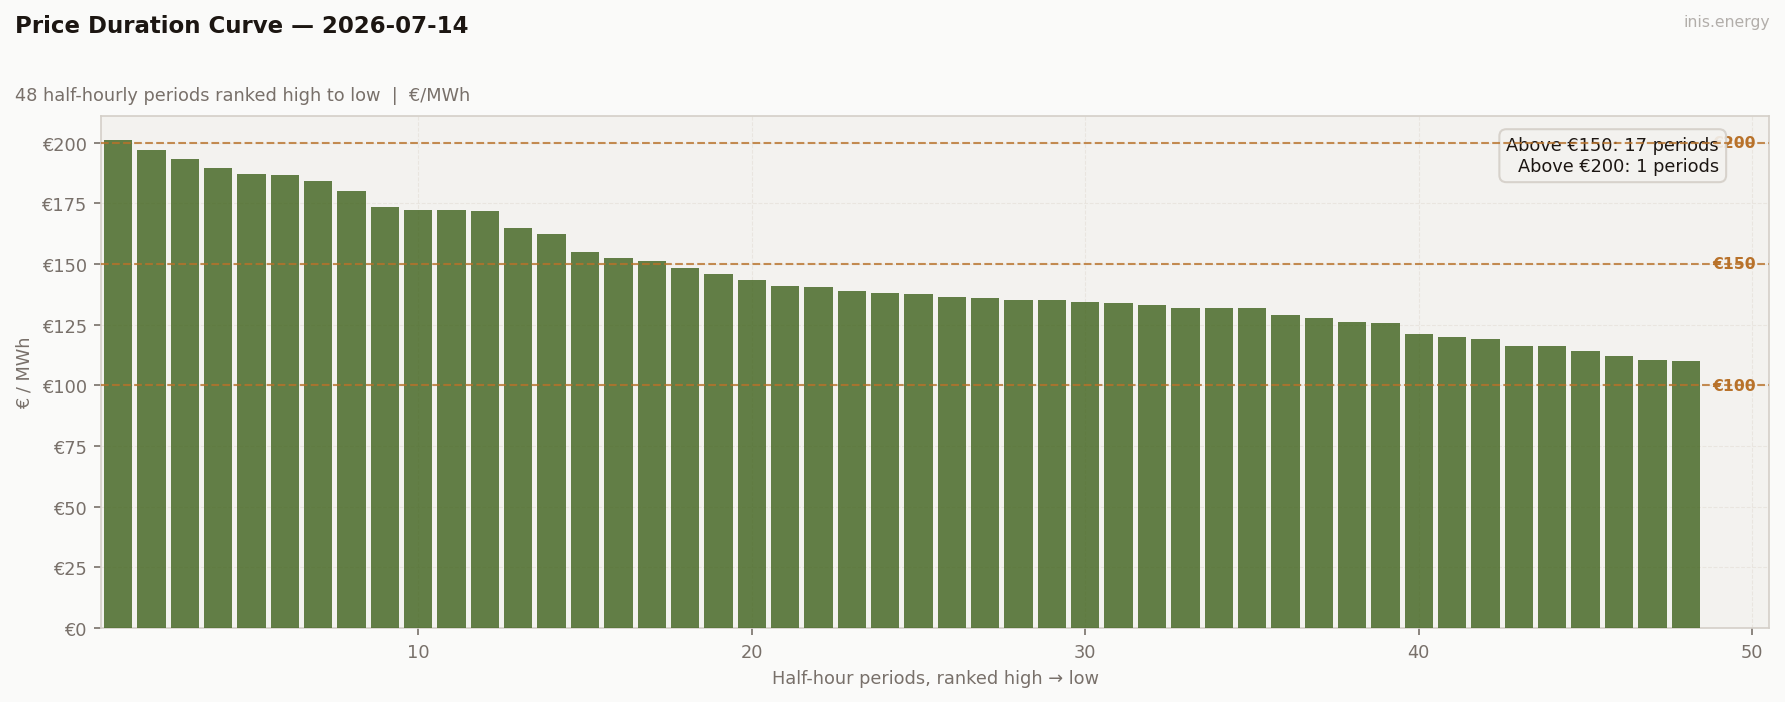
Periods above €150: 17 (35% of day) · Above €200: 1 (2% of day)
Peak / Off-Peak Spread #
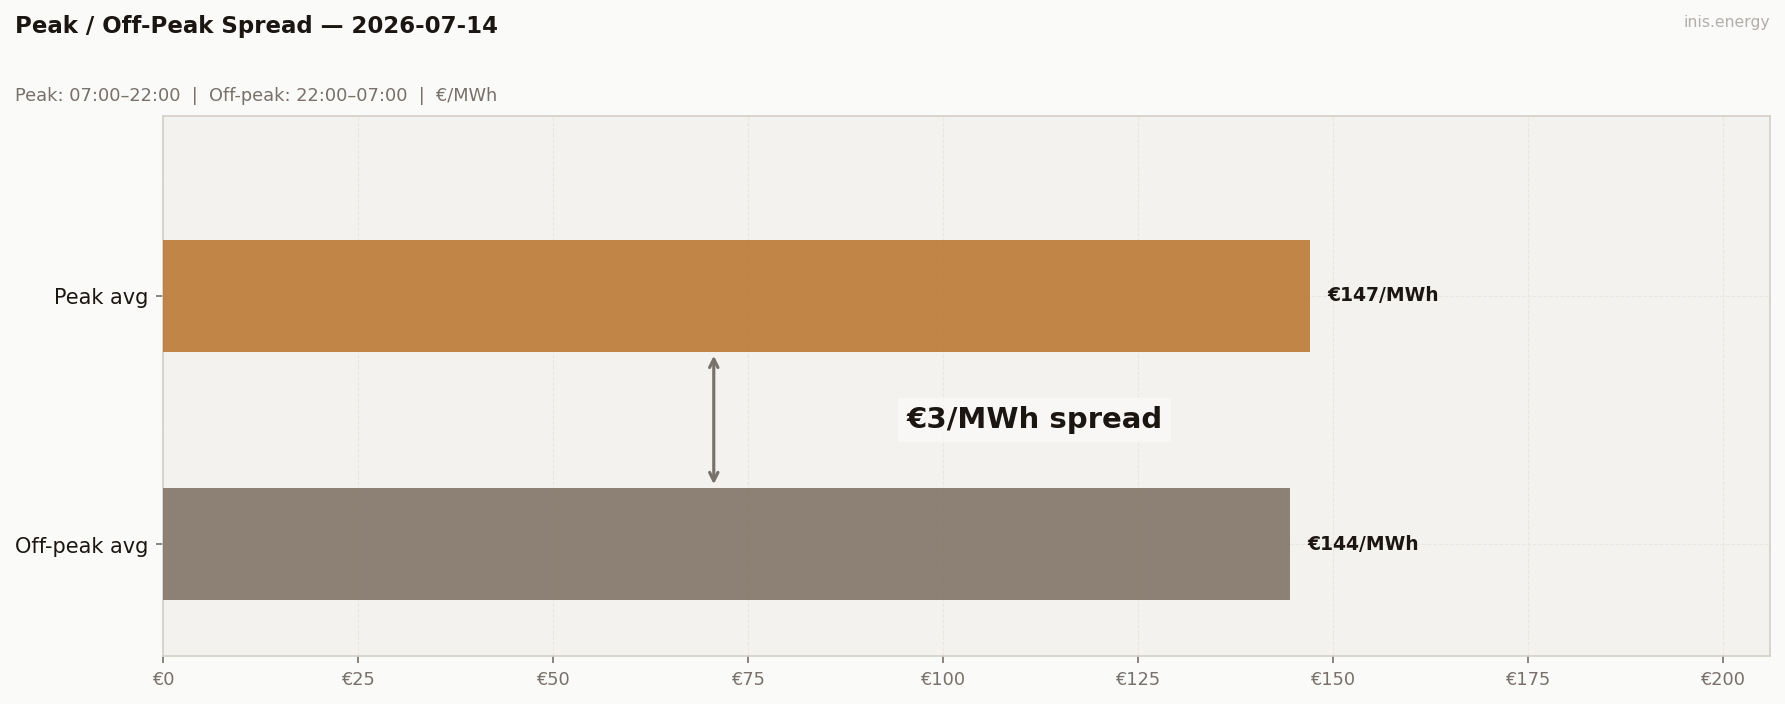
Peak avg (07:00–22:00): €147.14/MWh · Off-peak avg: €144.5/MWh · Spread: €2.64/MWh
BESS Dispatch Signal #
| Price | Time | Energy | Value | |
|---|---|---|---|---|
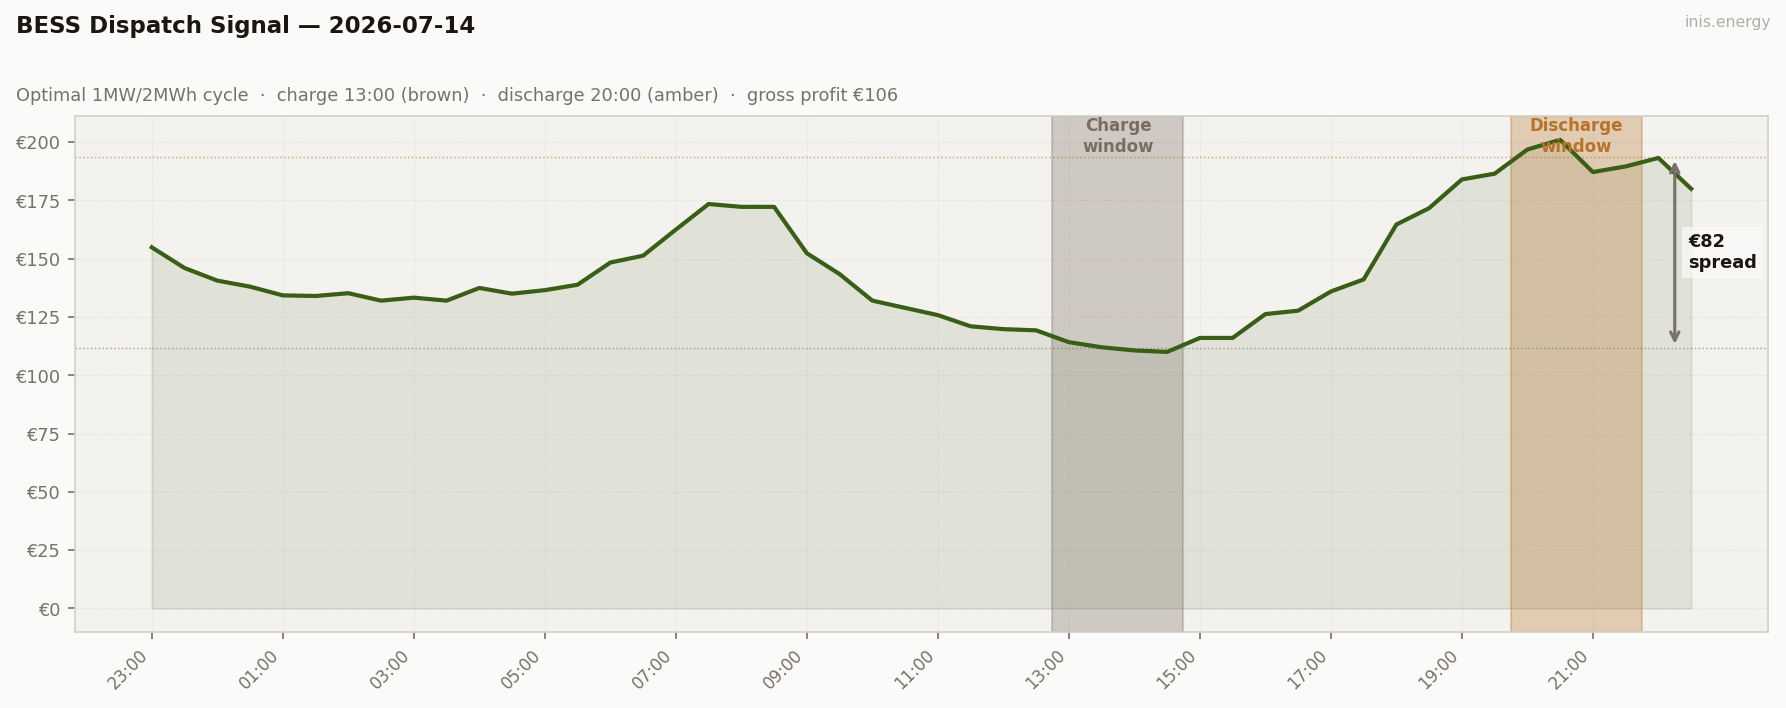
| Charge | €112/MWh | 13:00 | 2 MWh | −€223 |
| Discharge | €194/MWh | 20:00 | 1.7 MWh (85% RTE) | +€329 |
| Gross profit | €106 | |||
| Price spread | €82/MWh | ROI: 47.4% |
Simulated 1MW/2MWh battery, one optimal DAM cycle. Gross before network charges and capacity costs.
Commentary #
Half-hourly data — 2026-07-14
| Period | Time | Price (€/MWh) | Wind % |
|---|---|---|---|
| 1 | 23:00 | 154.88 | 20.9% |
| 2 | 23:30 | 146.01 | 21.0% |
| 3 | 00:00 | 140.60 | 35.9% |
| 4 | 00:30 | 138.01 | 37.1% |
| 5 | 01:00 | 134.27 | 36.2% |
| 6 | 01:30 | 134.01 | 35.2% |
| 7 | 02:00 | 135.20 | 34.6% |
| 8 | 02:30 | 132.01 | 34.9% |
| 9 | 03:00 | 133.29 | 34.2% |
| 10 | 03:30 | 132.01 | 34.4% |
| 11 | 04:00 | 137.45 | 33.4% |
| 12 | 04:30 | 135.00 | 32.2% |
| 13 | 05:00 | 136.51 | 32.5% |
| 14 | 05:30 | 138.83 | 31.8% |
| 15 | 06:00 | 148.35 | 30.3% |
| 16 | 06:30 | 151.30 | 27.2% |
| 17 | 07:00 | 162.49 | 24.0% |
| 18 | 07:30 | 173.46 | 21.7% |
| 19 | 08:00 | 172.25 | 19.6% |
| 20 | 08:30 | 172.25 | 17.4% |
| 21 | 09:00 | 152.35 | 16.2% |
| 22 | 09:30 | 143.40 | 15.9% |
| 23 | 10:00 | 132.01 | 16.6% |
| 24 | 10:30 | 128.90 | 17.1% |
| 25 | 11:00 | 125.80 | 18.1% |
| 26 | 11:30 | 121.00 | 19.7% |
| 27 | 12:00 | 119.78 | 22.5% |
| 28 | 12:30 | 119.27 | 23.5% |
| 29 | 13:00 | 114.19 | 25.6% |
| 30 | 13:30 | 112.01 | 28.2% |
| 31 | 14:00 | 110.64 | 27.6% |
| 32 | 14:30 | 110.01 | 29.1% |
| 33 | 15:00 | 116.01 | 29.3% |
| 34 | 15:30 | 116.01 | 30.1% |
| 35 | 16:00 | 126.24 | 31.4% |
| 36 | 16:30 | 127.70 | 30.6% |
| 37 | 17:00 | 135.93 | 29.9% |
| 38 | 17:30 | 141.11 | 27.9% |
| 39 | 18:00 | 164.66 | 26.0% |
| 40 | 18:30 | 171.69 | 24.3% |
| 41 | 19:00 | 184.01 | 21.9% |
| 42 | 19:30 | 186.48 | 19.6% |
| 43 | 20:00 | 196.85 | 15.9% |
| 44 | 20:30 | 201.00 | 15.2% |
| 45 | 21:00 | 187.18 | 16.3% |
| 46 | 21:30 | 189.60 | 17.0% |
| 47 | 22:00 | 193.23 | 18.5% |
| 48 | 22:30 | 180.00 | 19.4% |
Compare your business electricity and gas rates in minutes with INIS Energy Brokers.
Compare rates