I-SEM Daily Briefing — 23 July 2026
Table of Contents
Market Snapshot
| Metric | Value |
|---|---|
| Mean DAM Price | €194.93/MWh |
| Median Price | €188.34/MWh |
| Std Dev | €24.39/MWh |
| Peak Price | €240.8/MWh (08:30) |
| Min Price | €161.68/MWh (00:30) |
| Price Range | €79.12/MWh |
| Periods above €150 | 48 of 48 (100%) |
| Periods above €200 | 19 of 48 (40%) |
| Peak Avg (07–22) | €204.86/MWh |
| Off-peak Avg (22–07) | €178.38/MWh |
| Peak/Off-Peak Spread | €26.48/MWh |
| Wind % of Demand | 10.0% |
| Wind Range | 5.1%–21.1% |
| Mean Demand | 3826 MW |
Price Profile #
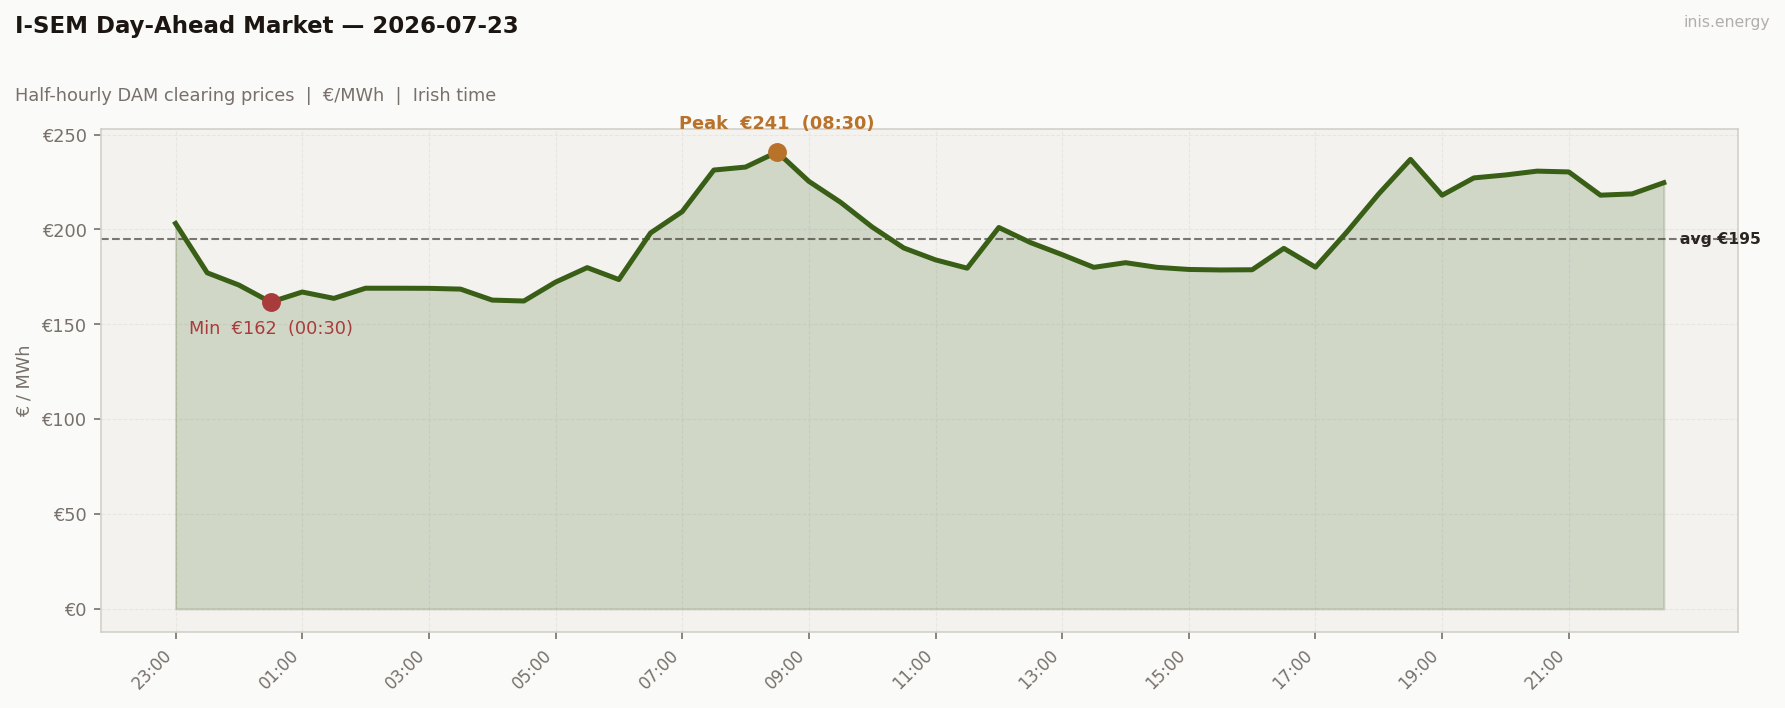
Std dev €24.39/MWh · Median €188.34/MWh · Periods above €150: 48 of 48 (100%)
Price vs Wind #
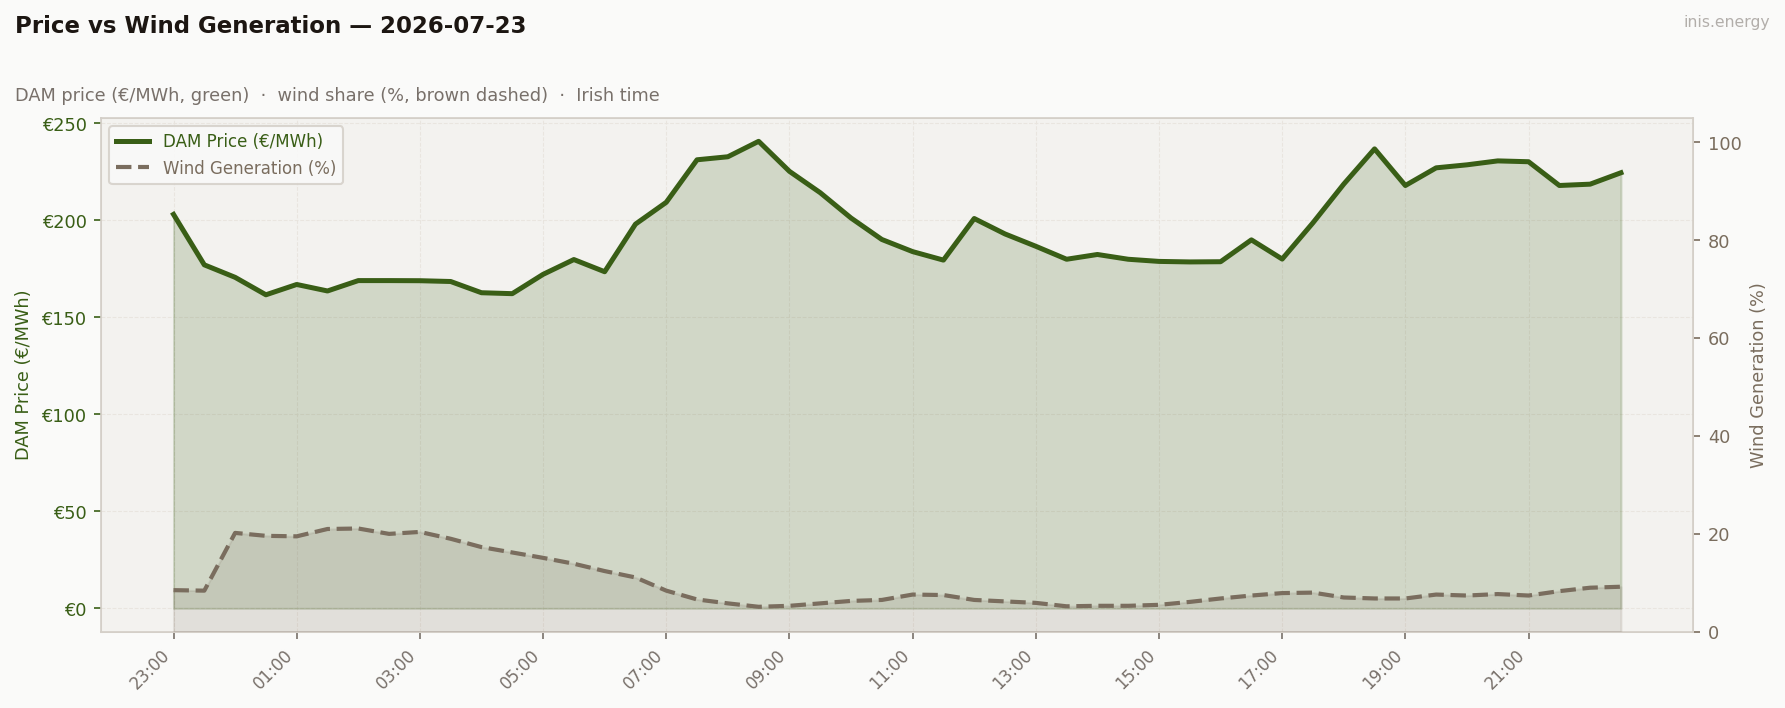
Mean wind: 10.0% · Range: 5.1%–21.1%
Week in Context #
Price Duration Curve #
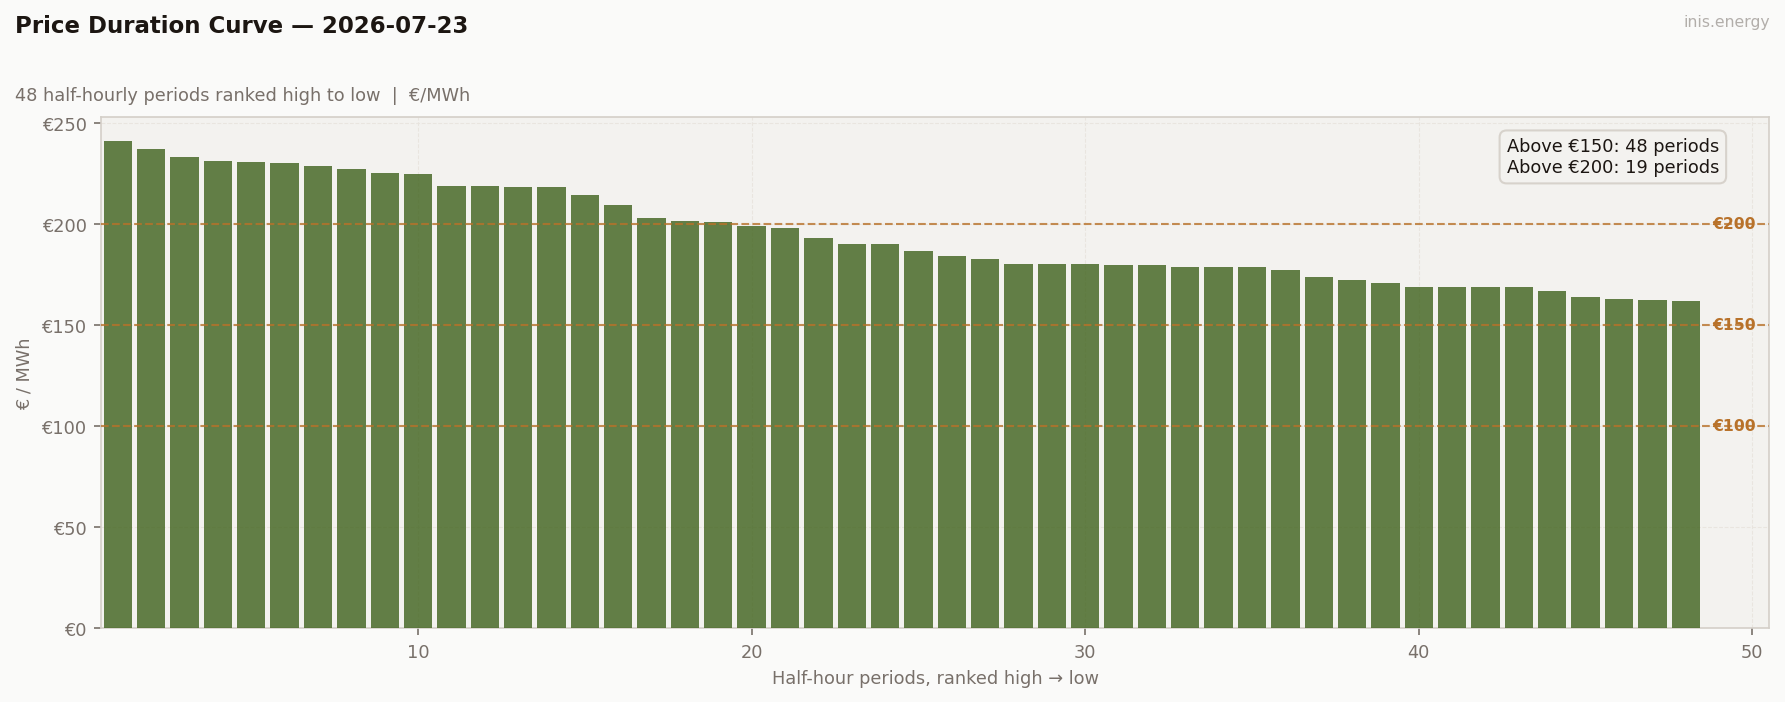
Periods above €150: 48 (100% of day) · Above €200: 19 (40% of day)
Peak / Off-Peak Spread #
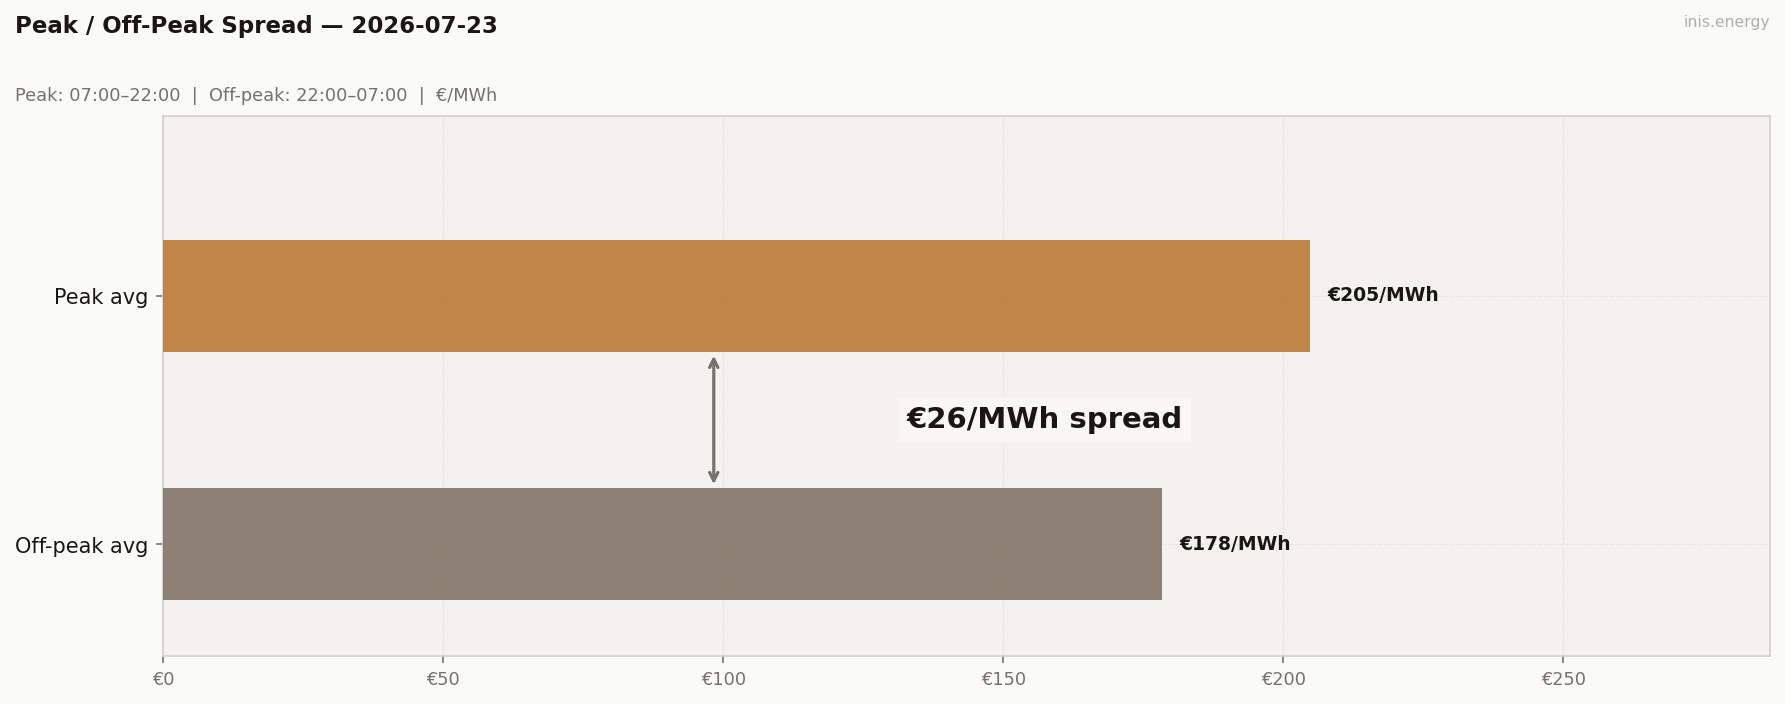
Peak avg (07:00–22:00): €204.86/MWh · Off-peak avg: €178.38/MWh · Spread: €26.48/MWh
BESS Dispatch Signal #
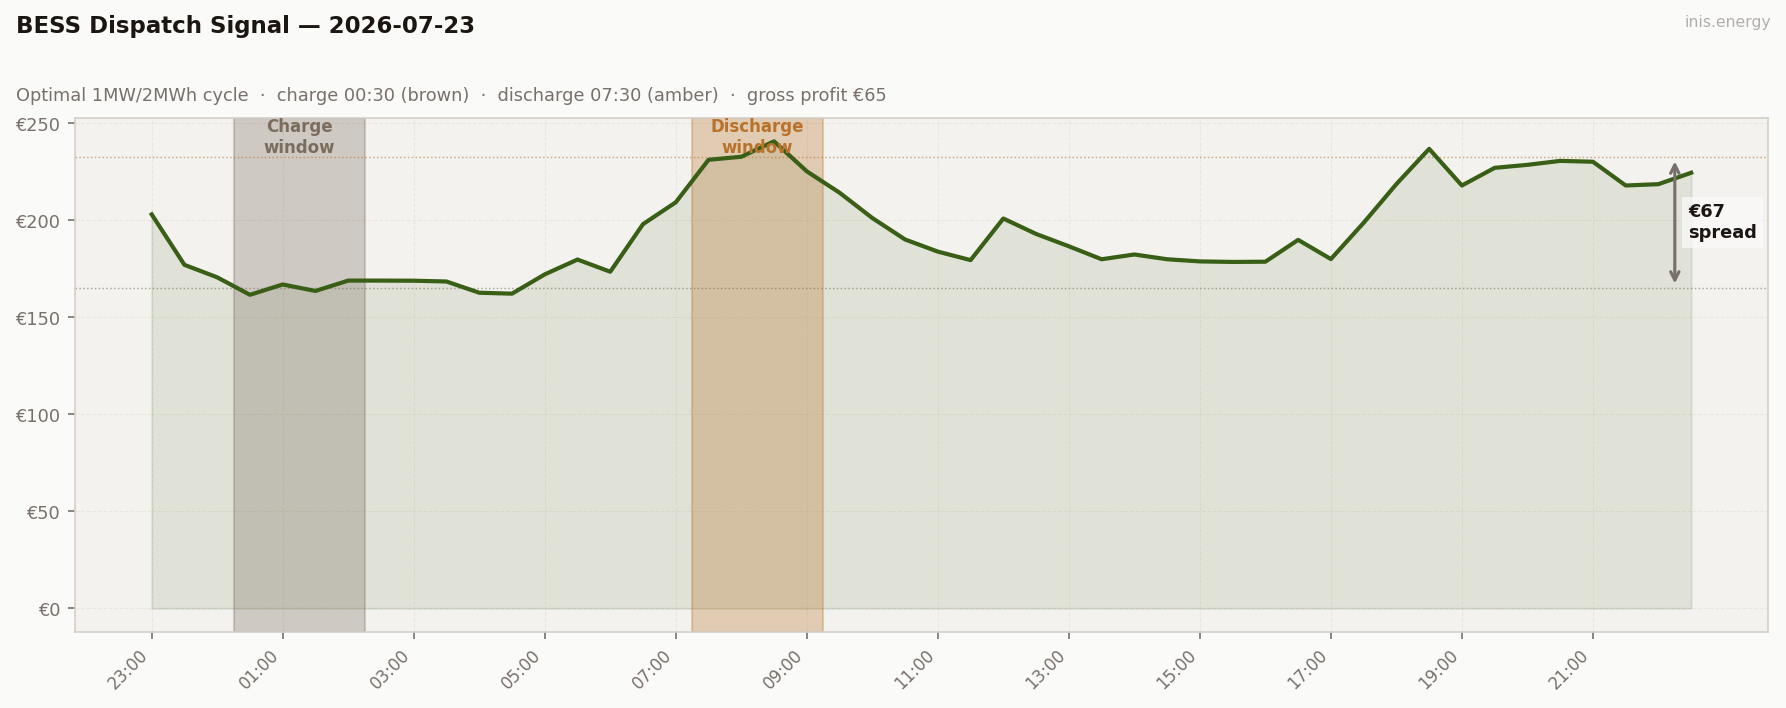
| Price | Time | Energy | Value | |
|---|---|---|---|---|
| Charge | €165/MWh | 00:30 | 2 MWh | −€331 |
| Discharge | €233/MWh | 07:30 | 1.7 MWh (85% RTE) | +€395 |
| Gross profit | €65 | |||
| Price spread | €67/MWh | ROI: 19.6% |
Simulated 1MW/2MWh battery, one optimal DAM cycle. Gross before network charges and capacity costs.
Commentary #
Wind sat at 10.0% of demand all day and never got above 21%. That’s a thin margin for the system to work with, and it showed: every single half-hour period cleared above €150, and the morning ramp from 6am to 8:30am pushed straight through €240 as wind fell to 5.1% right when demand was climbing hardest. Flat and high, with the ceiling breached at the worst possible moment for consumers.
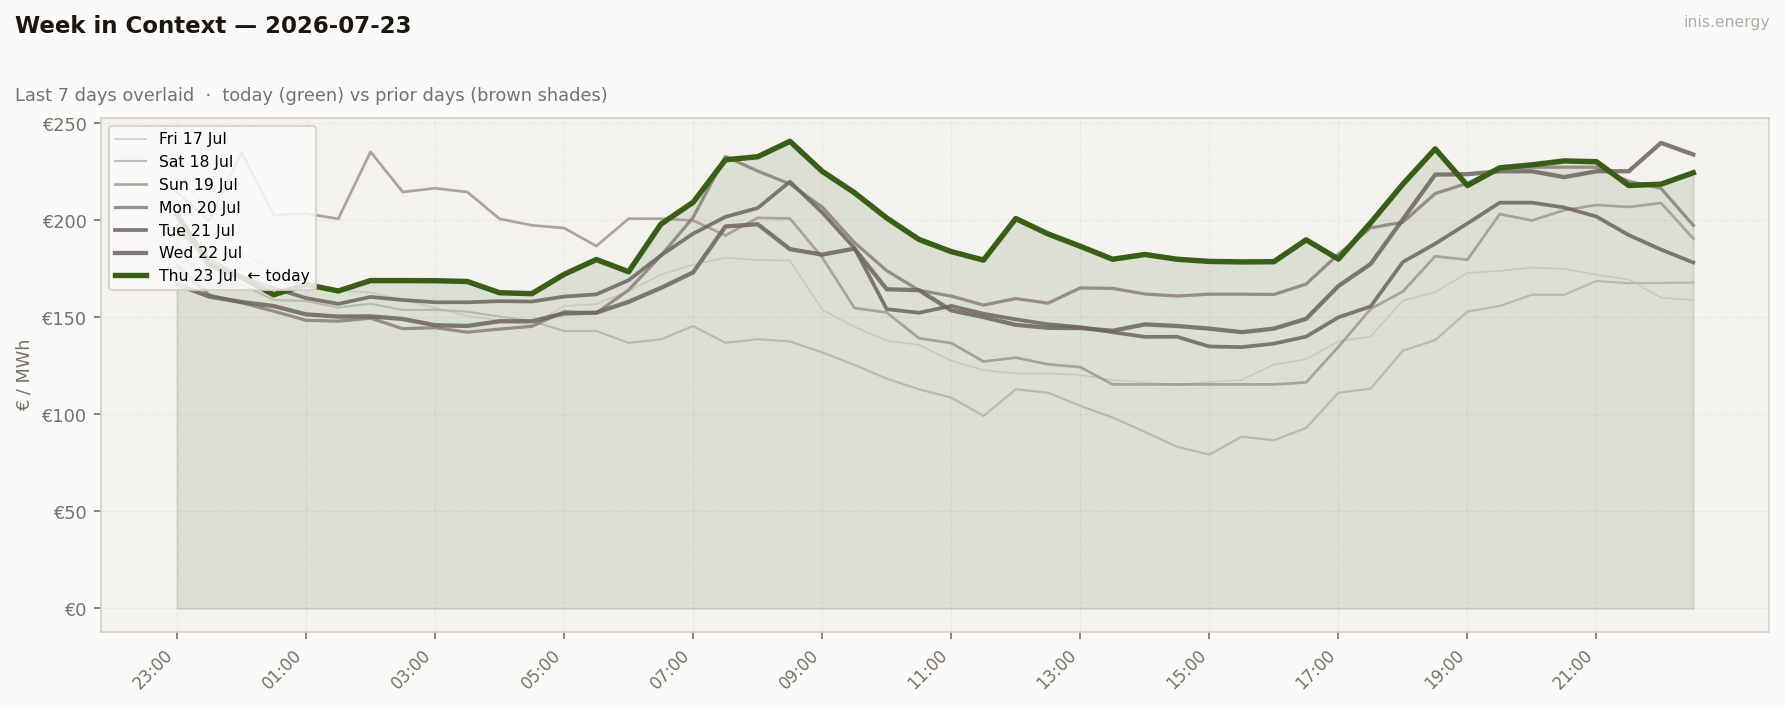
The trough at 00:30 (€161.68) was still the second-highest daily minimum of the week — this was a day with a floor but no real trough. Peak/off-peak spread came in at a modest €26.48, unremarkable by this week’s standards, because there was nothing to squeeze against. Low wind flattens the whole curve upward rather than creating shape.
That flatness is exactly what makes storage struggle. The battery cleared only €65 gross, the weakest day of the week, on a spread of just €67/MWh. This is a nightmare situation for wind and a mediocre one for BESS — no volatility, no opportunity. Give us a windy day next.
Half-hourly data — 2026-07-23
| Period | Time | Price (€/MWh) | Wind % |
|---|---|---|---|
| 1 | 23:00 | 203.13 | 8.5% |
| 2 | 23:30 | 177.12 | 8.4% |
| 3 | 00:00 | 170.68 | 20.2% |
| 4 | 00:30 | 161.68 | 19.6% |
| 5 | 01:00 | 167.00 | 19.5% |
| 6 | 01:30 | 163.65 | 21.0% |
| 7 | 02:00 | 169.00 | 21.1% |
| 8 | 02:30 | 169.00 | 20.0% |
| 9 | 03:00 | 168.94 | 20.4% |
| 10 | 03:30 | 168.53 | 19.0% |
| 11 | 04:00 | 162.74 | 17.3% |
| 12 | 04:30 | 162.26 | 16.2% |
| 13 | 05:00 | 172.21 | 15.1% |
| 14 | 05:30 | 179.85 | 13.9% |
| 15 | 06:00 | 173.57 | 12.4% |
| 16 | 06:30 | 198.11 | 11.1% |
| 17 | 07:00 | 209.36 | 8.4% |
| 18 | 07:30 | 231.28 | 6.6% |
| 19 | 08:00 | 232.84 | 5.8% |
| 20 | 08:30 | 240.80 | 5.1% |
| 21 | 09:00 | 225.33 | 5.3% |
| 22 | 09:30 | 214.31 | 5.8% |
| 23 | 10:00 | 201.26 | 6.3% |
| 24 | 10:30 | 190.20 | 6.5% |
| 25 | 11:00 | 183.94 | 7.6% |
| 26 | 11:30 | 179.56 | 7.5% |
| 27 | 12:00 | 201.00 | 6.5% |
| 28 | 12:30 | 193.05 | 6.2% |
| 29 | 13:00 | 186.69 | 5.9% |
| 30 | 13:30 | 180.00 | 5.2% |
| 31 | 14:00 | 182.46 | 5.3% |
| 32 | 14:30 | 180.00 | 5.3% |
| 33 | 15:00 | 178.89 | 5.5% |
| 34 | 15:30 | 178.62 | 6.1% |
| 35 | 16:00 | 178.73 | 6.8% |
| 36 | 16:30 | 190.00 | 7.4% |
| 37 | 17:00 | 180.10 | 7.9% |
| 38 | 17:30 | 198.80 | 8.0% |
| 39 | 18:00 | 218.76 | 7.0% |
| 40 | 18:30 | 236.91 | 6.8% |
| 41 | 19:00 | 218.02 | 6.8% |
| 42 | 19:30 | 227.13 | 7.6% |
| 43 | 20:00 | 228.68 | 7.4% |
| 44 | 20:30 | 230.71 | 7.7% |
| 45 | 21:00 | 230.28 | 7.4% |
| 46 | 21:30 | 218.03 | 8.3% |
| 47 | 22:00 | 218.71 | 9.0% |
| 48 | 22:30 | 224.60 | 9.2% |
Compare your business electricity and gas rates in minutes with INIS Energy Brokers.
Compare rates