I-SEM Daily Briefing — 24 July 2026
Table of Contents
Market Snapshot
| Metric | Value |
|---|---|
| Mean DAM Price | €171.0/MWh |
| Median Price | €176.8/MWh |
| Std Dev | €30.3/MWh |
| Peak Price | €240.76/MWh (23:00) |
| Min Price | €127.17/MWh (15:30) |
| Price Range | €113.59/MWh |
| Periods above €150 | 33 of 48 (69%) |
| Periods above €200 | 9 of 48 (19%) |
| Peak Avg (07–22) | €161.48/MWh |
| Off-peak Avg (22–07) | €186.87/MWh |
| Peak/Off-Peak Spread | €-25.39/MWh |
| Wind % of Demand | 18.2% |
| Wind Range | 7.4%–30.3% |
| Mean Demand | 3749 MW |
Price Profile #
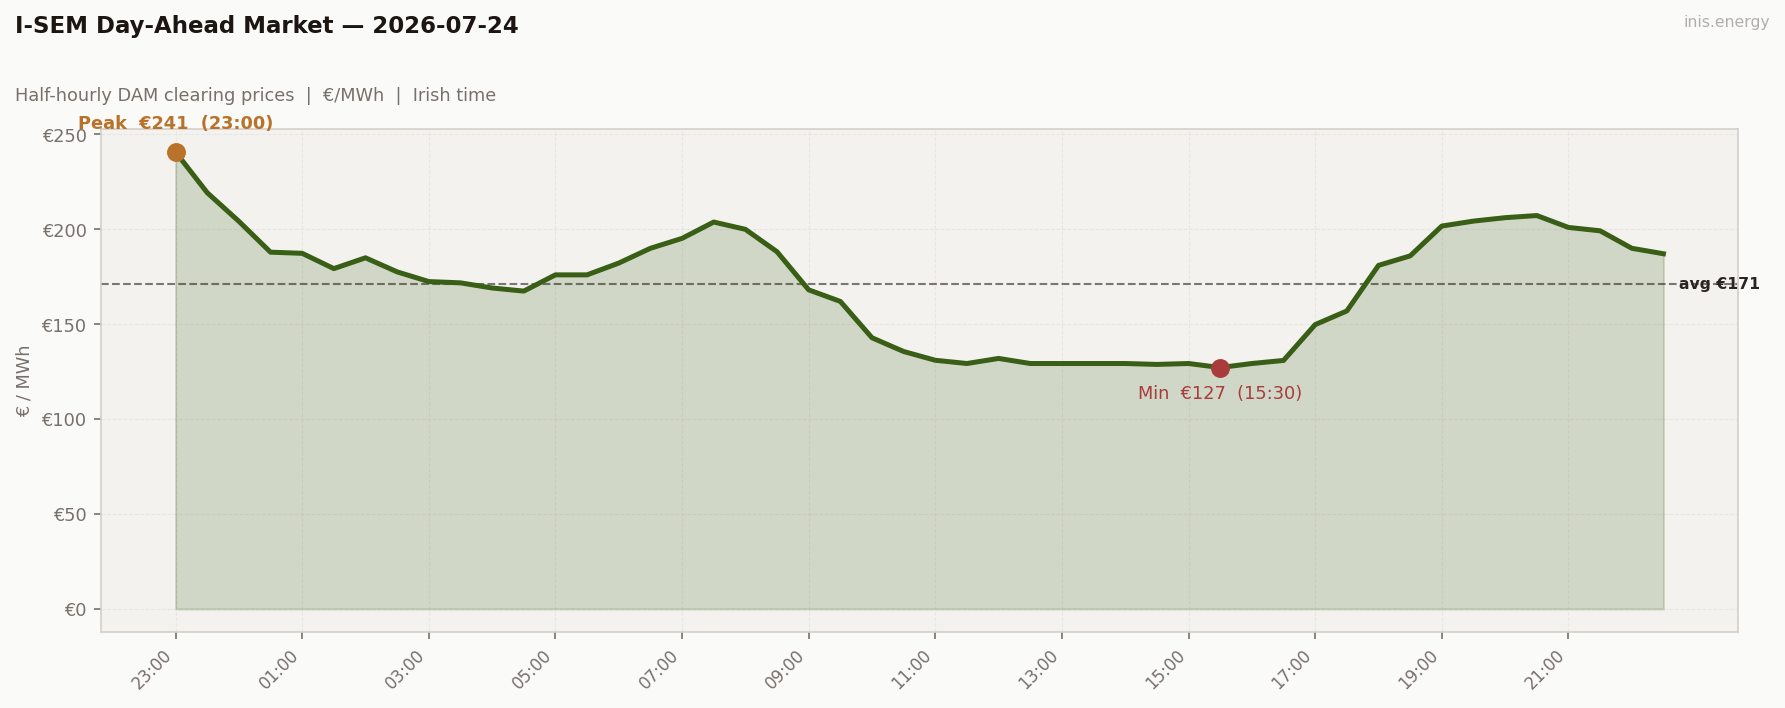
Std dev €30.3/MWh · Median €176.8/MWh · Periods above €150: 33 of 48 (69%)
Price vs Wind #
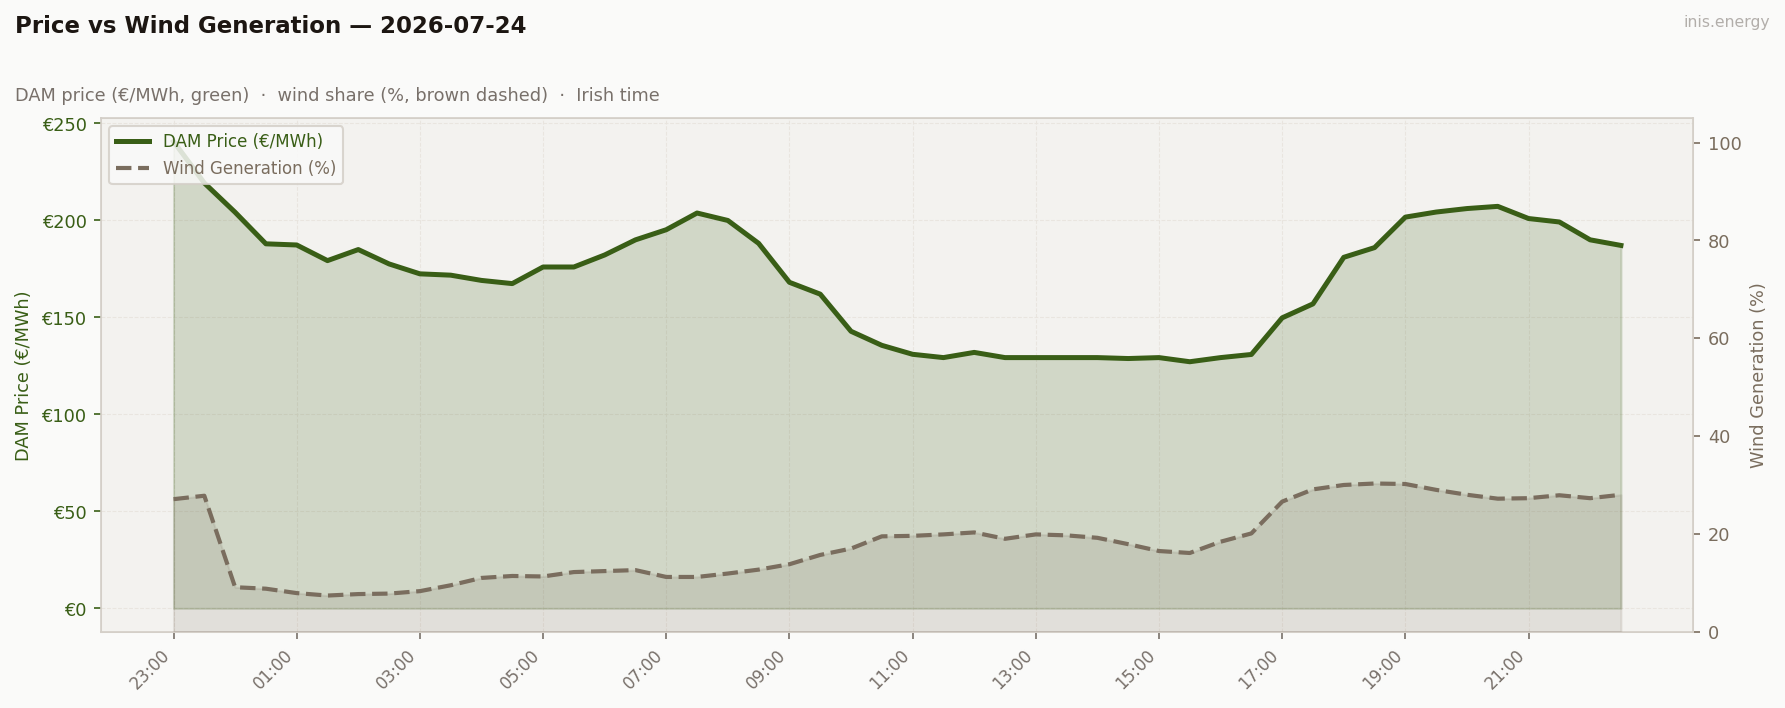
Mean wind: 18.2% · Range: 7.4%–30.3%
Week in Context #
Price Duration Curve #
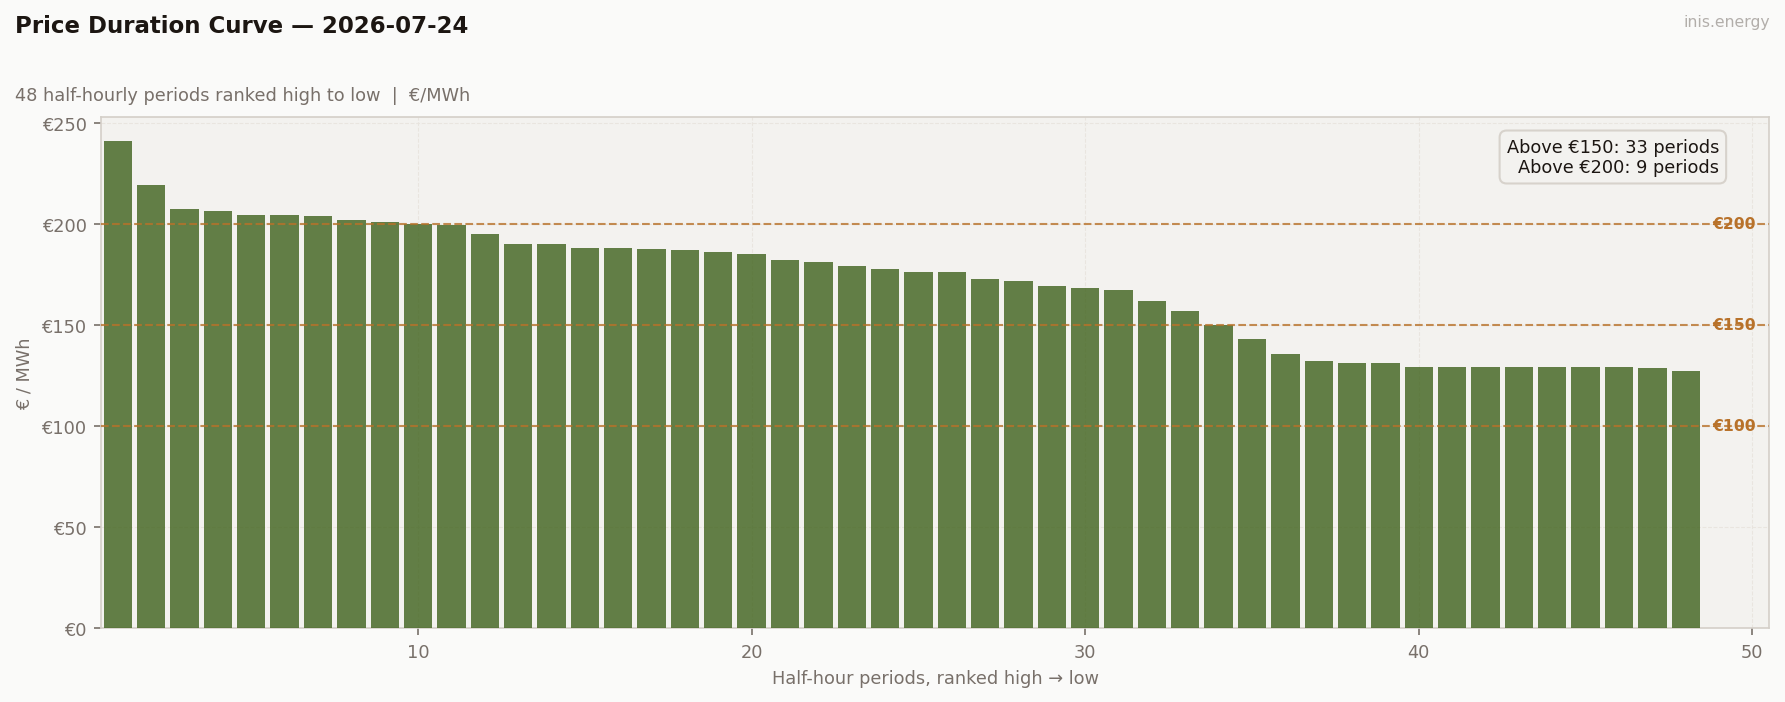
Periods above €150: 33 (69% of day) · Above €200: 9 (19% of day)
Peak / Off-Peak Spread #
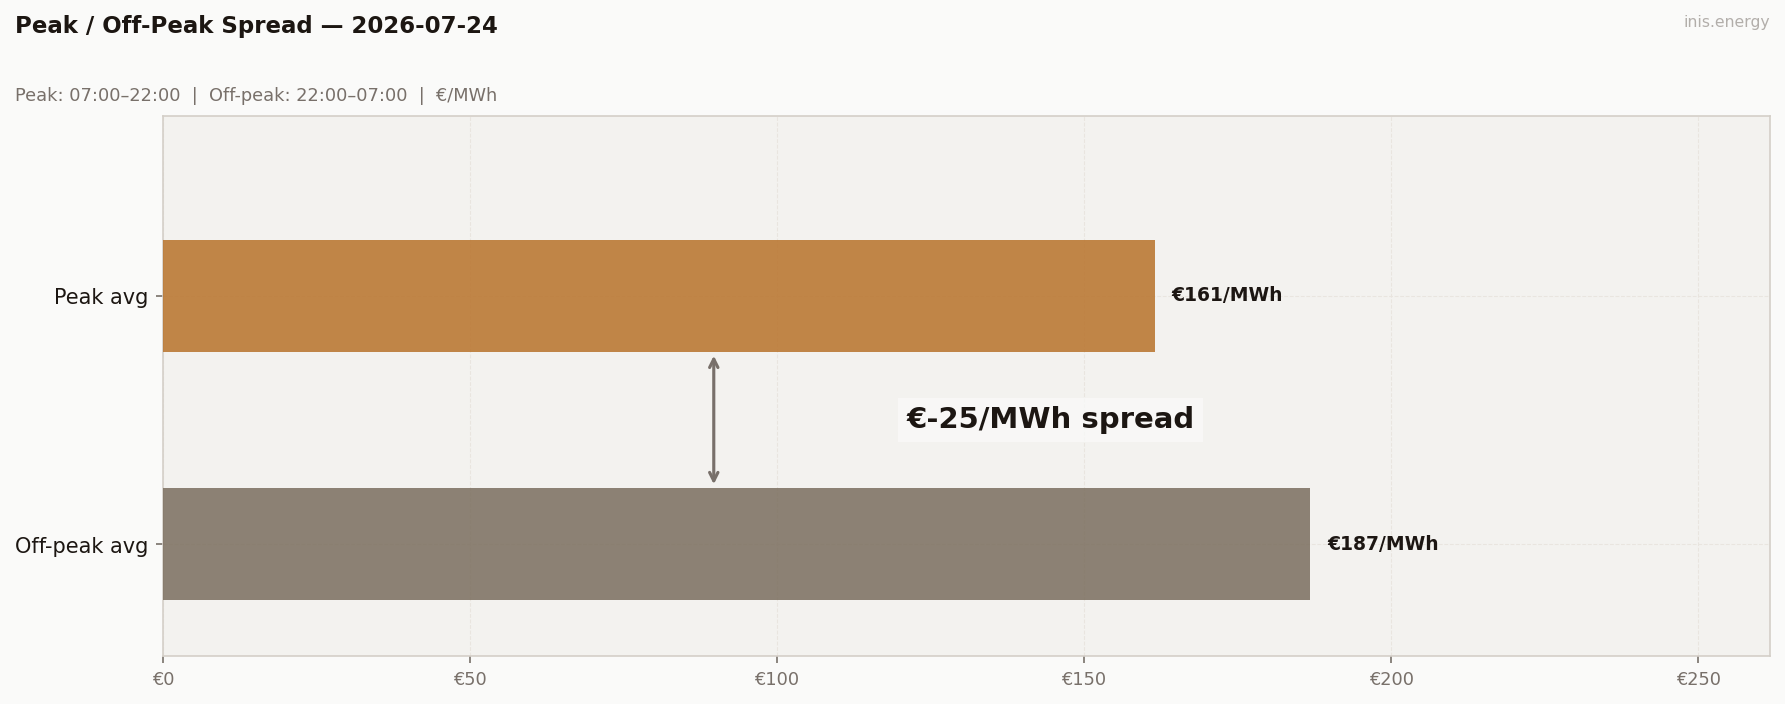
Peak avg (07:00–22:00): €161.48/MWh · Off-peak avg: €186.87/MWh · Spread: €-25.39/MWh
BESS Dispatch Signal #
| Price | Time | Energy | Value | |
|---|---|---|---|---|
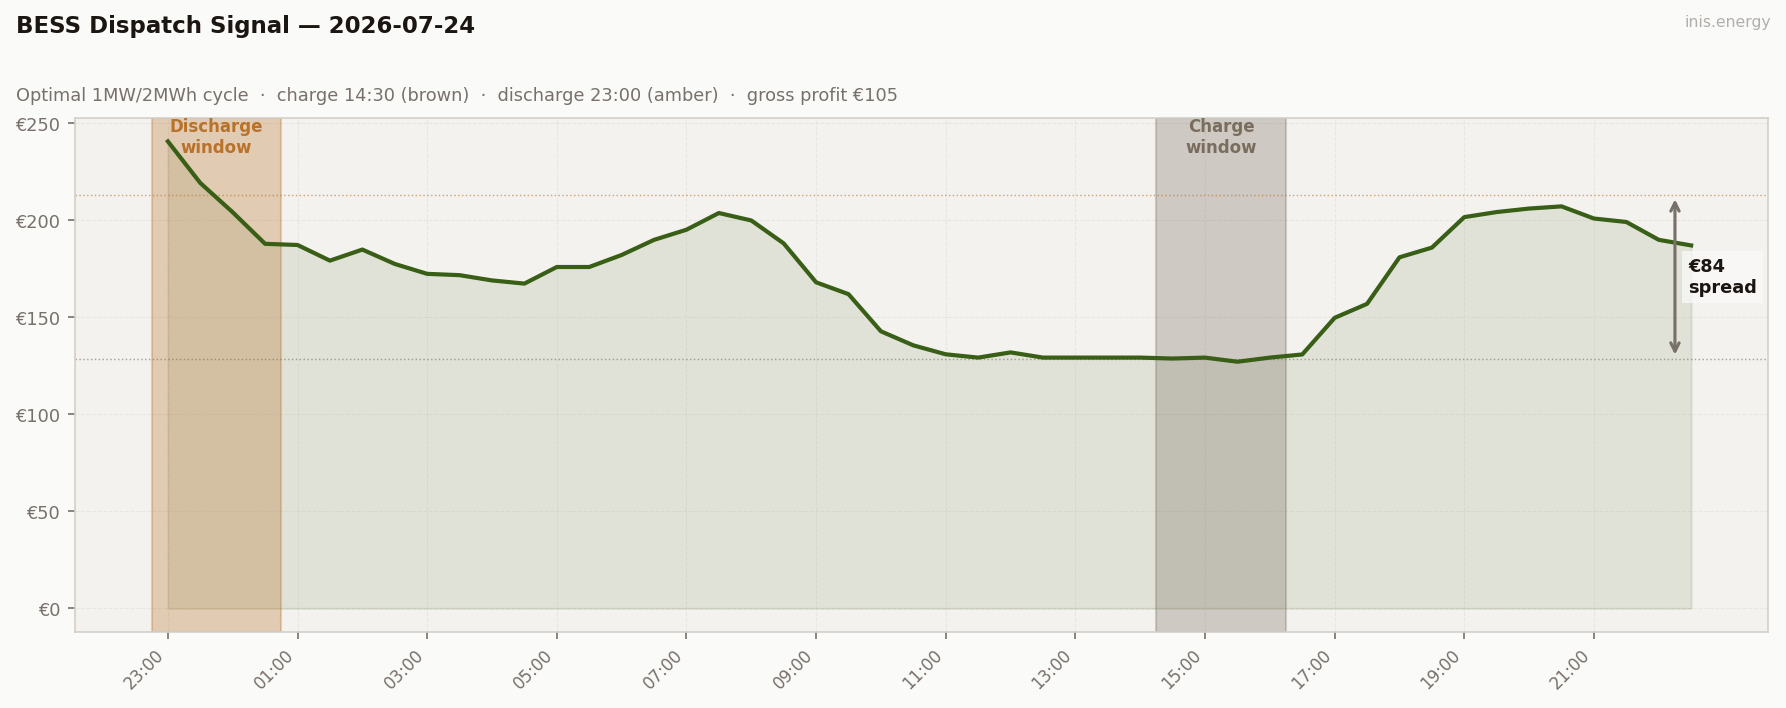
| Charge | €129/MWh | 14:30 | 2 MWh | −€257 |
| Discharge | €205/MWh | 19:00 | 1.7 MWh (85% RTE) | +€348 |
| Gross profit | €91 | |||
| Price spread | €76/MWh | ROI: 35.4% |
Simulated 1MW/2MWh battery, one optimal DAM cycle. Gross before network charges and capacity costs.
Updated 2026-08-25: the BESS simulation previously allowed the discharge window to occur before the charge window ended, which is physically impossible for a battery. This day’s figure was recalculated enforcing charge-before-discharge; gross profit corrected from €105 to €91.
Commentary #
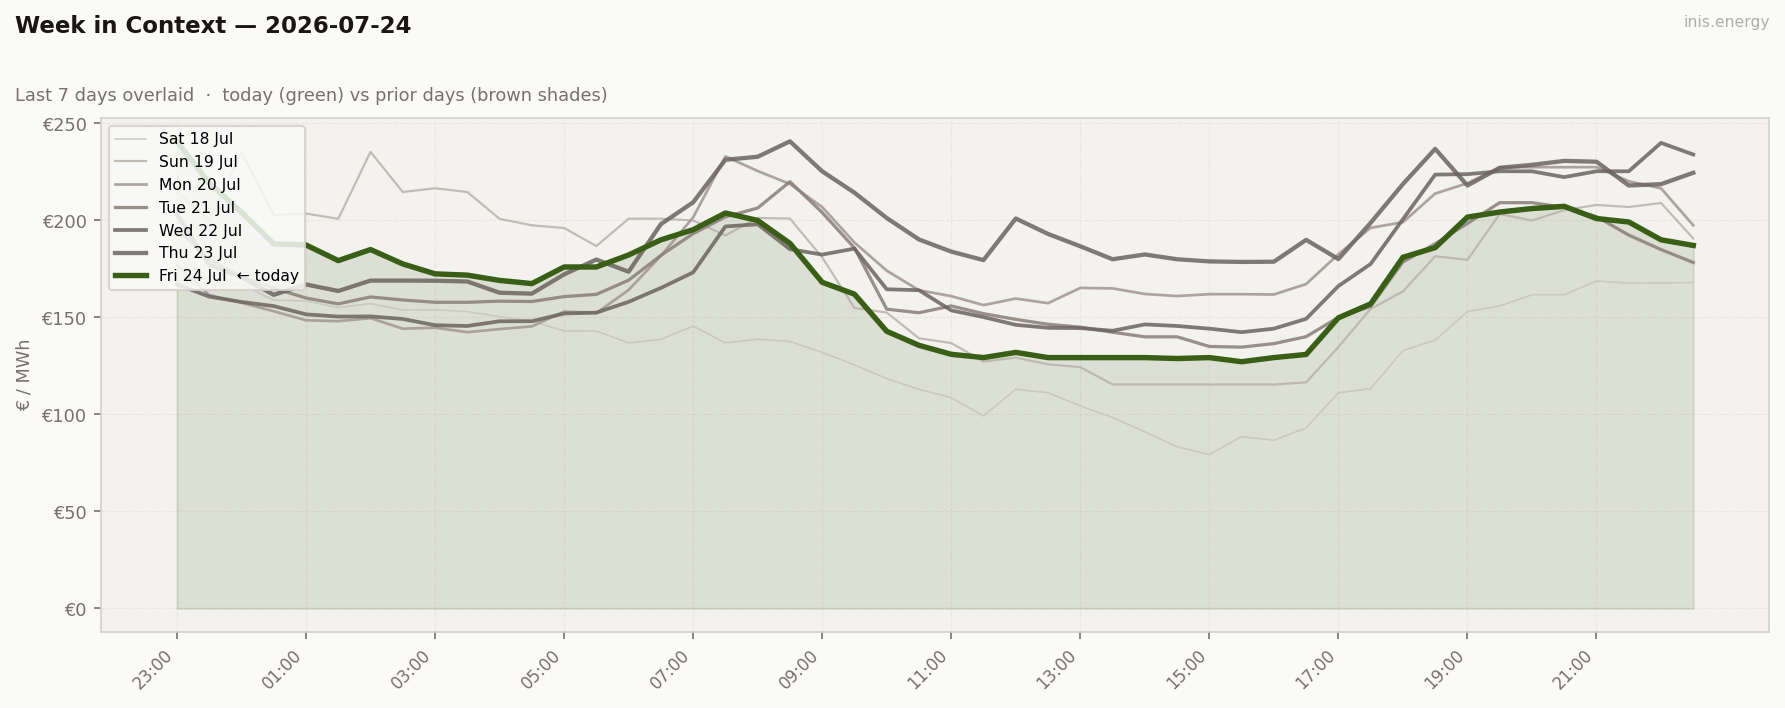
Wind nearly doubled on yesterday, averaging 18.2% and touching 30.3% through the evening, and the price shape responded by inverting. Peak/off-peak spread went negative (-€25.39) — the cheapest hours weren’t overnight, they were the early afternoon trough between 11:00 and 16:30, when wind held above 16% and prices sat pinned near €129, briefly touching €127.17. That’s the cannibalisation signature: wind supplying the middle of the day pushes clearing price down exactly when it’s generating most.
The two ends of the day tell the opposite story. Wind collapsed to single digits overnight and again in the first hour of trade, and price spiked to the day’s €240.76 peak at 23:00 as generation scrambled to cover the gap. Two-hundred-euro swings within the same 24 hours, driven almost entirely by wind moving between 7% and 30%.
Storage caught a modest slice of it: €91 gross, a 35.4% ROI, charging into the afternoon trough (€129, 14:30) and discharging into the evening peak (€205, 19:00). The lesson repeats — it’s the gap between the trough and the peak that pays, not the average price level.
Half-hourly data — 2026-07-24
| Period | Time | Price (€/MWh) | Wind % |
|---|---|---|---|
| 1 | 23:00 | 240.76 | 27.1% |
| 2 | 23:30 | 219.32 | 27.8% |
| 3 | 00:00 | 204.23 | 9.1% |
| 4 | 00:30 | 187.96 | 8.8% |
| 5 | 01:00 | 187.36 | 7.9% |
| 6 | 01:30 | 179.30 | 7.4% |
| 7 | 02:00 | 185.00 | 7.7% |
| 8 | 02:30 | 177.59 | 7.8% |
| 9 | 03:00 | 172.48 | 8.3% |
| 10 | 03:30 | 171.80 | 9.5% |
| 11 | 04:00 | 169.09 | 11.0% |
| 12 | 04:30 | 167.45 | 11.4% |
| 13 | 05:00 | 176.01 | 11.3% |
| 14 | 05:30 | 176.01 | 12.2% |
| 15 | 06:00 | 182.21 | 12.4% |
| 16 | 06:30 | 190.00 | 12.6% |
| 17 | 07:00 | 195.23 | 11.2% |
| 18 | 07:30 | 203.84 | 11.2% |
| 19 | 08:00 | 200.00 | 11.9% |
| 20 | 08:30 | 188.19 | 12.7% |
| 21 | 09:00 | 168.11 | 13.8% |
| 22 | 09:30 | 162.01 | 15.7% |
| 23 | 10:00 | 142.86 | 17.0% |
| 24 | 10:30 | 135.62 | 19.5% |
| 25 | 11:00 | 131.00 | 19.6% |
| 26 | 11:30 | 129.30 | 19.9% |
| 27 | 12:00 | 131.98 | 20.3% |
| 28 | 12:30 | 129.30 | 19.0% |
| 29 | 13:00 | 129.30 | 19.9% |
| 30 | 13:30 | 129.30 | 19.7% |
| 31 | 14:00 | 129.30 | 19.2% |
| 32 | 14:30 | 128.82 | 17.9% |
| 33 | 15:00 | 129.30 | 16.5% |
| 34 | 15:30 | 127.17 | 16.1% |
| 35 | 16:00 | 129.30 | 18.4% |
| 36 | 16:30 | 130.92 | 20.1% |
| 37 | 17:00 | 149.80 | 26.6% |
| 38 | 17:30 | 157.00 | 29.1% |
| 39 | 18:00 | 181.00 | 30.0% |
| 40 | 18:30 | 186.01 | 30.3% |
| 41 | 19:00 | 201.73 | 30.2% |
| 42 | 19:30 | 204.34 | 29.0% |
| 43 | 20:00 | 206.14 | 28.0% |
| 44 | 20:30 | 207.27 | 27.2% |
| 45 | 21:00 | 201.00 | 27.3% |
| 46 | 21:30 | 199.22 | 27.9% |
| 47 | 22:00 | 190.02 | 27.3% |
| 48 | 22:30 | 187.13 | 28.0% |
Compare your business electricity and gas rates in minutes with INIS Energy Brokers.
Compare rates