I-SEM Daily Briefing — 29 August 2026
Table of Contents
Market Snapshot
| Metric | Value |
|---|---|
| Mean DAM Price | €218.64/MWh |
| Median Price | €215.0/MWh |
| Std Dev | €39.74/MWh |
| Peak Price | €315.32/MWh (22:00) |
| Min Price | €160.2/MWh (06:00) |
| Price Range | €155.12/MWh |
| Periods above €150 | 48 of 48 (100%) |
| Periods above €200 | 30 of 48 (62%) |
| Peak Avg (07–22) | €228.55/MWh |
| Off-peak Avg (22–07) | €202.11/MWh |
| Peak/Off-Peak Spread | €26.44/MWh |
| Cheap/Dear Spread | €162.4/MWh → €284.49/MWh (€122.09) |
| Wind % of Demand | 10.5% |
| Wind Range | 0.9%–16.5% |
| Mean Demand | 3833 MW |
Price Profile #
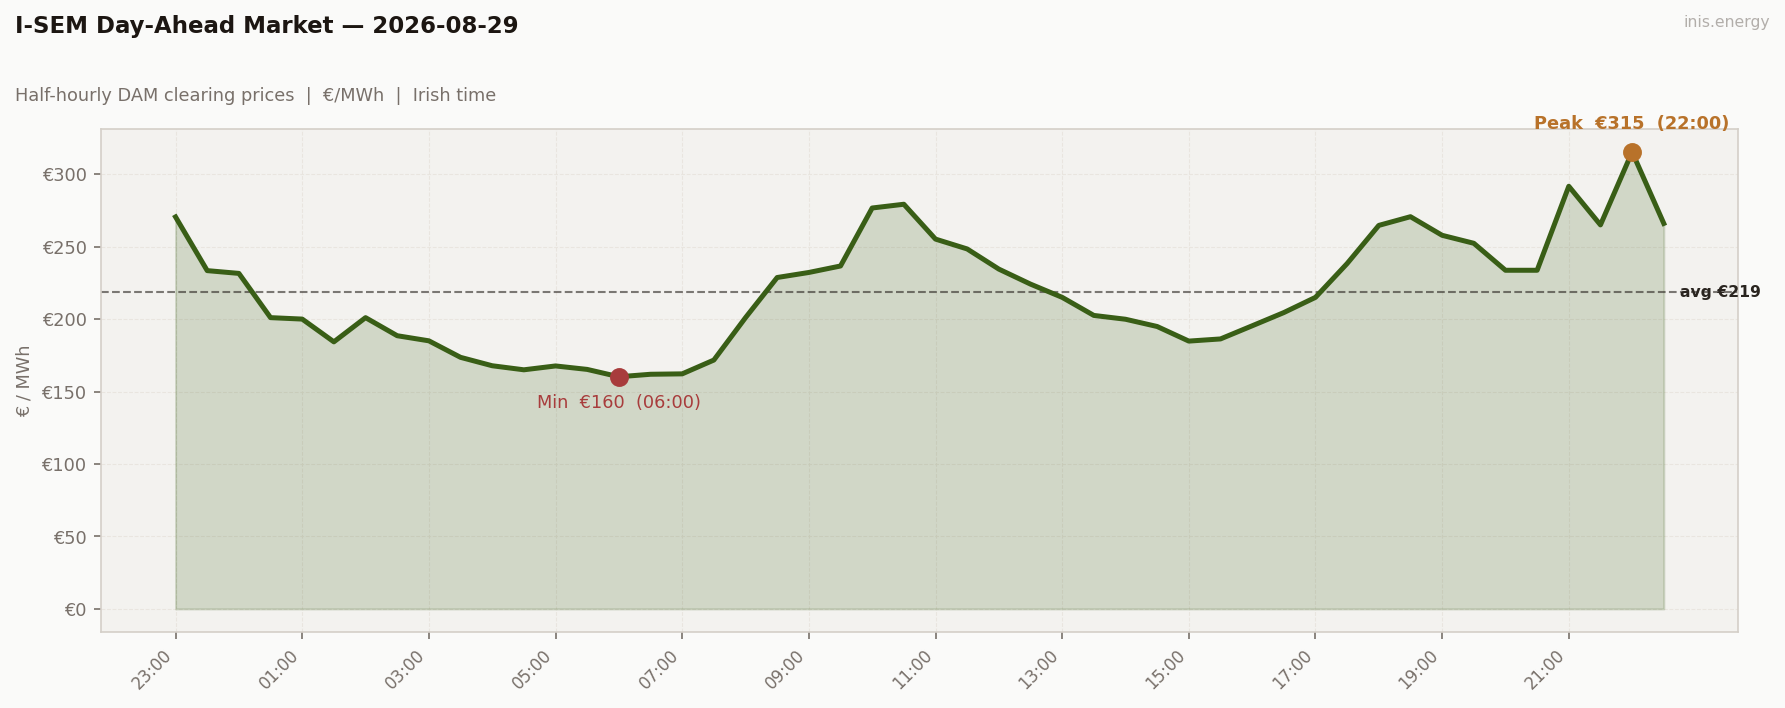
Std dev €39.74/MWh · Median €215.0/MWh · Periods above €150: 48 of 48 (100%)
Price vs Wind #
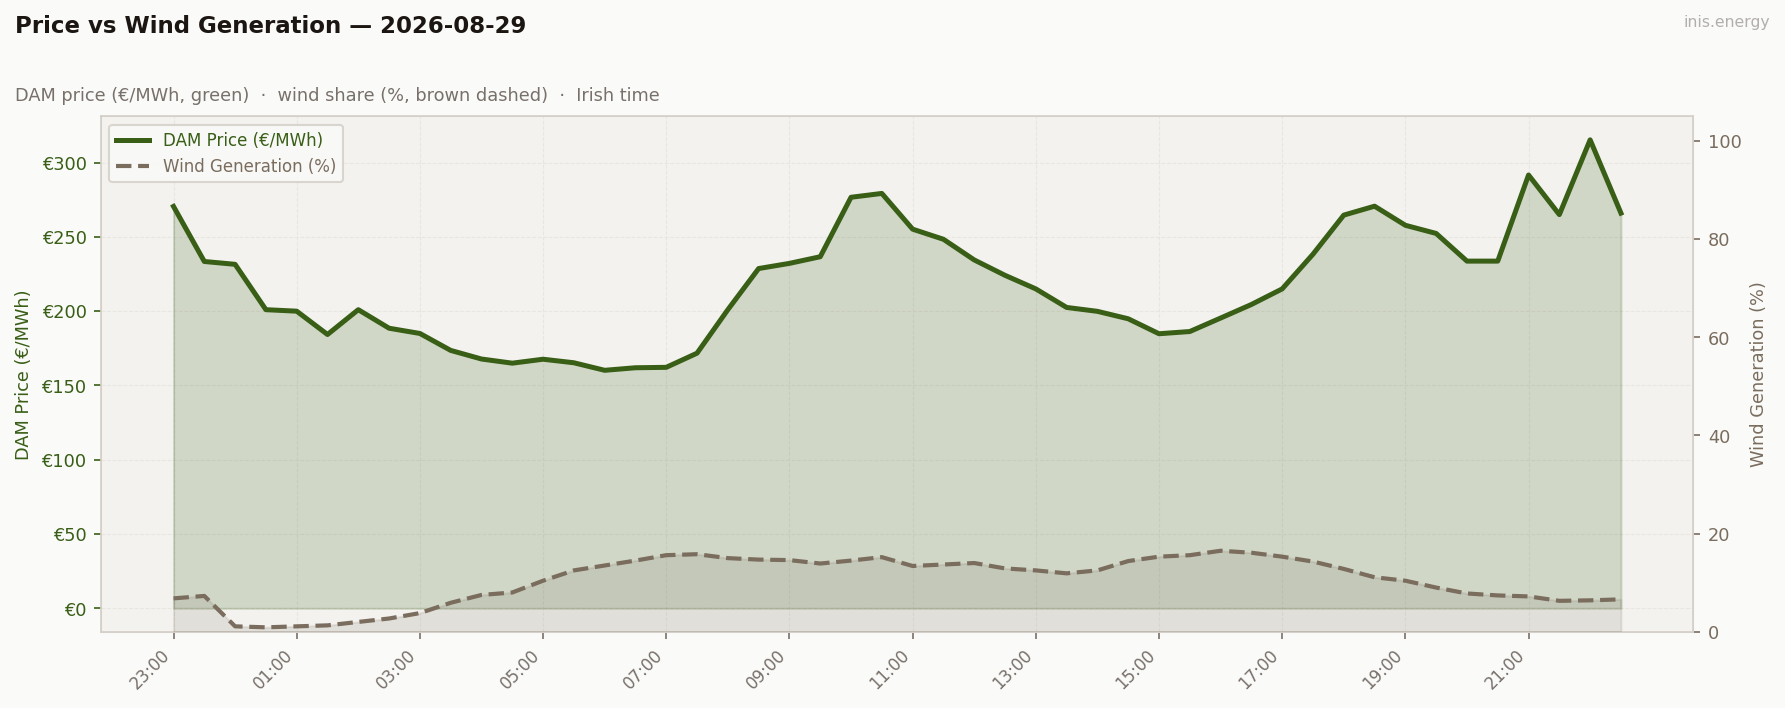
Mean wind: 10.5% · Range: 0.9%–16.5%
Week in Context #
Price Duration Curve #
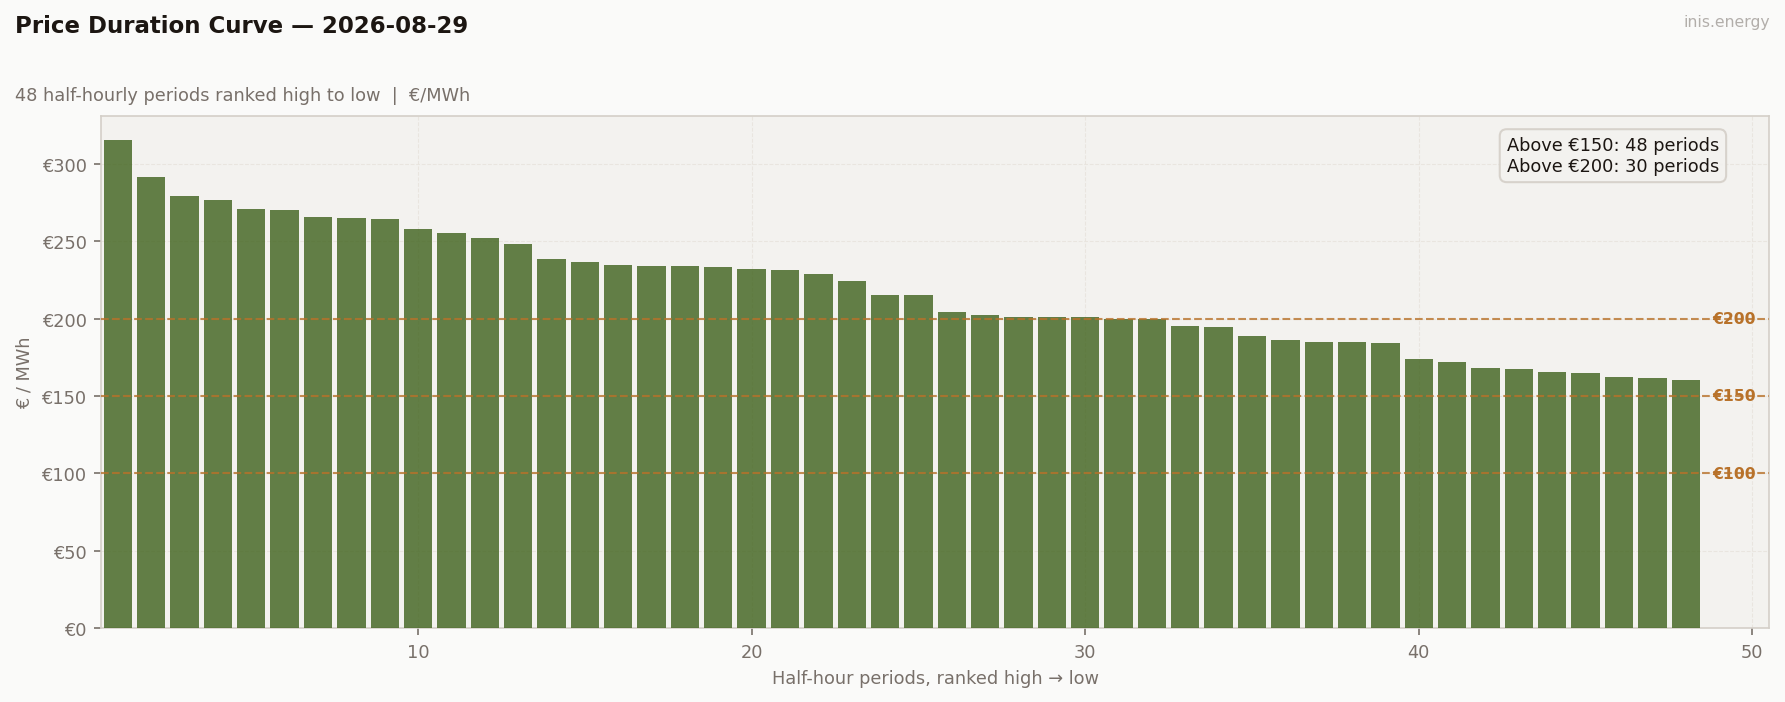
Periods above €150: 48 (100% of day) · Above €200: 30 (62% of day)
Peak / Off-Peak Spread #
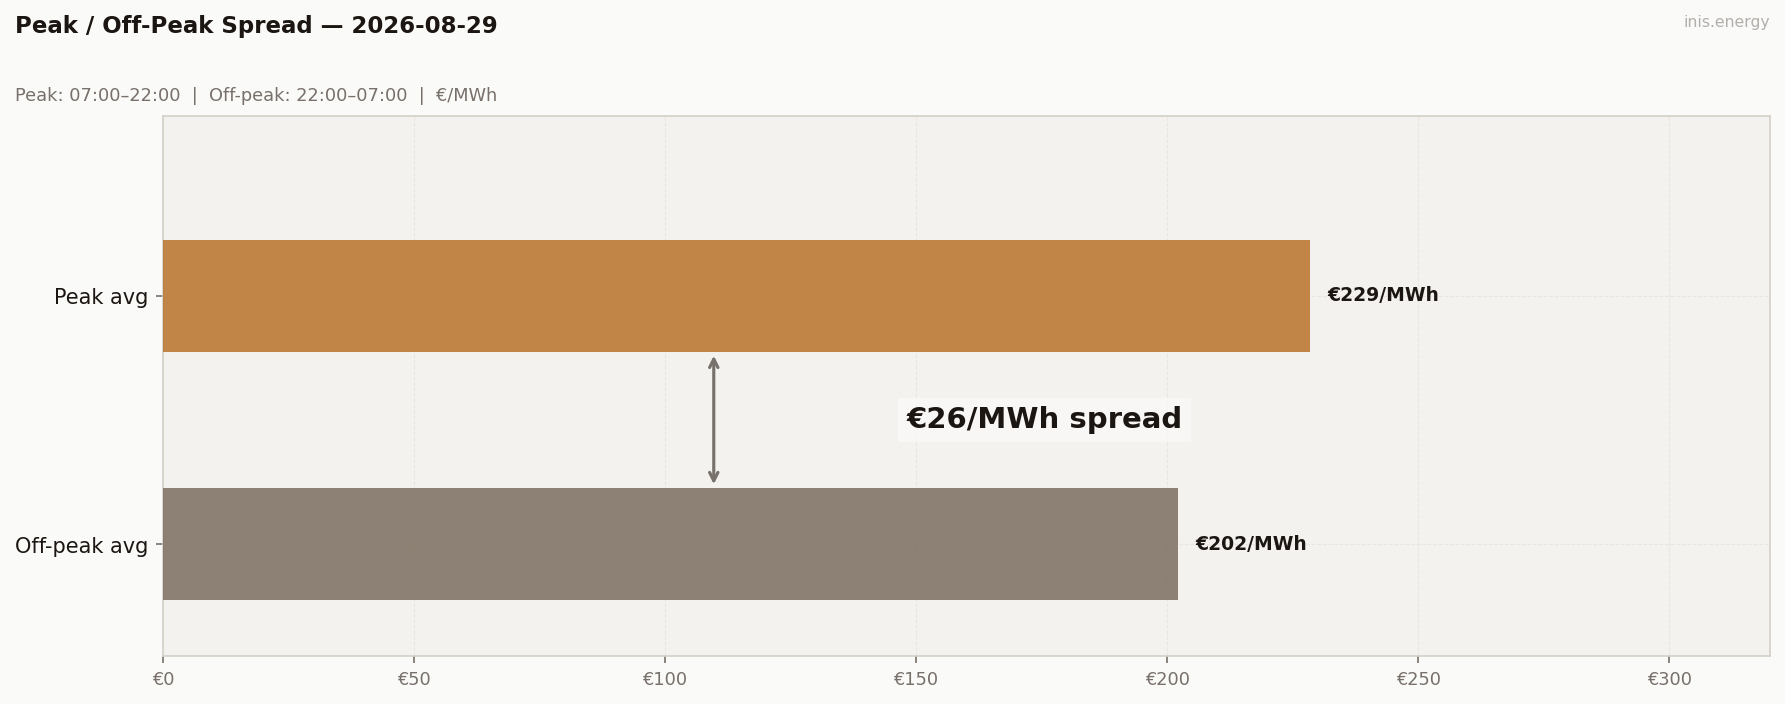
Peak avg (07:00–22:00): €228.55/MWh · Off-peak avg: €202.11/MWh · Spread: €26.44/MWh
Cheap window: €162.4/MWh · Dear window: €284.49/MWh · Spread: €122.09/MWh — the actual cheapest and dearest 2-hour blocks of the day, wherever they fall on the clock
Commentary #
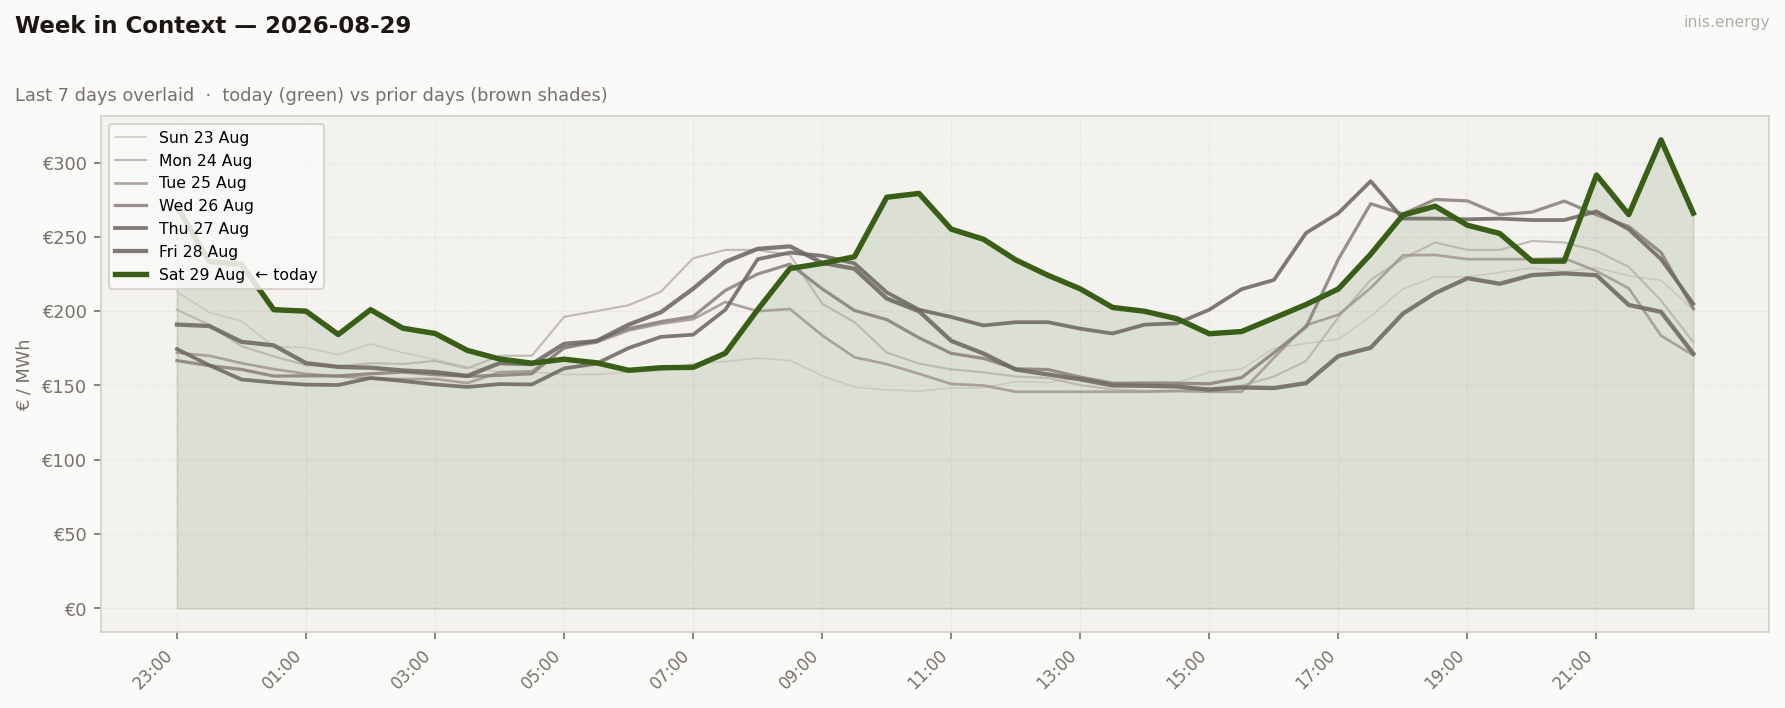
Wind never got out of single-to-low-double digits all day (0.9%–16.5%), and a lower-demand Saturday did nothing to calm the market down. Instead it went the other way: a morning ramp to €236 by 09:30, a second spike to €279.25 at 10:30, a brief afternoon lull in the mid-€180s–190s, and then a final surge to €315.32 at 22:00 — the highest and latest peak of the fortnight. Mean cleared at €218.64, also the fortnight’s high, with 30 of 48 periods (62%) above €200.
This is what a weekend looks like with nothing to lean on — lower demand doesn’t buy you a calmer market if wind isn’t there to fill the gap.
Half-hourly data — 2026-08-29
| Period | Time | Price (€/MWh) | Wind % |
|---|---|---|---|
| 1 | 23:00 | 270.50 | 6.8% |
| 2 | 23:30 | 233.44 | 7.3% |
| 3 | 00:00 | 231.53 | 1.1% |
| 4 | 00:30 | 201.00 | 0.9% |
| 5 | 01:00 | 200.00 | 1.1% |
| 6 | 01:30 | 184.30 | 1.3% |
| 7 | 02:00 | 201.00 | 2.0% |
| 8 | 02:30 | 188.52 | 2.7% |
| 9 | 03:00 | 185.00 | 3.8% |
| 10 | 03:30 | 173.60 | 5.9% |
| 11 | 04:00 | 167.80 | 7.5% |
| 12 | 04:30 | 165.00 | 8.0% |
| 13 | 05:00 | 167.66 | 10.4% |
| 14 | 05:30 | 165.27 | 12.5% |
| 15 | 06:00 | 160.20 | 13.5% |
| 16 | 06:30 | 161.92 | 14.5% |
| 17 | 07:00 | 162.20 | 15.6% |
| 18 | 07:30 | 171.73 | 15.8% |
| 19 | 08:00 | 201.00 | 15.0% |
| 20 | 08:30 | 228.69 | 14.7% |
| 21 | 09:00 | 232.17 | 14.6% |
| 22 | 09:30 | 236.64 | 13.9% |
| 23 | 10:00 | 276.66 | 14.5% |
| 24 | 10:30 | 279.25 | 15.2% |
| 25 | 11:00 | 255.20 | 13.4% |
| 26 | 11:30 | 248.40 | 13.7% |
| 27 | 12:00 | 234.49 | 14.0% |
| 28 | 12:30 | 224.13 | 12.9% |
| 29 | 13:00 | 215.00 | 12.5% |
| 30 | 13:30 | 202.52 | 11.9% |
| 31 | 14:00 | 199.89 | 12.5% |
| 32 | 14:30 | 194.88 | 14.4% |
| 33 | 15:00 | 184.81 | 15.3% |
| 34 | 15:30 | 186.30 | 15.6% |
| 35 | 16:00 | 195.36 | 16.5% |
| 36 | 16:30 | 204.49 | 16.1% |
| 37 | 17:00 | 215.00 | 15.3% |
| 38 | 17:30 | 238.34 | 14.3% |
| 39 | 18:00 | 264.65 | 12.8% |
| 40 | 18:30 | 270.66 | 11.1% |
| 41 | 19:00 | 257.81 | 10.4% |
| 42 | 19:30 | 252.31 | 9.0% |
| 43 | 20:00 | 233.69 | 7.8% |
| 44 | 20:30 | 233.69 | 7.4% |
| 45 | 21:00 | 291.65 | 7.2% |
| 46 | 21:30 | 265.00 | 6.3% |
| 47 | 22:00 | 315.32 | 6.4% |
| 48 | 22:30 | 266.00 | 6.6% |
Compare your business electricity and gas rates in minutes with INIS Energy Brokers.
Compare rates