I-SEM Daily Briefing — 4 September 2026
Table of Contents
Market Snapshot
| Metric | Value |
|---|---|
| Mean DAM Price | €119.43/MWh |
| Median Price | €136.22/MWh |
| Std Dev | €59.17/MWh |
| Peak Price | €213.79/MWh (23:00) |
| Min Price | €20.0/MWh (14:00) |
| Price Range | €193.79/MWh |
| Periods above €150 | 19 of 48 (40%) |
| Periods above €200 | 1 of 48 (2%) |
| Peak Avg (07–22) | €99.43/MWh |
| Off-peak Avg (22–07) | €152.77/MWh |
| Peak/Off-Peak Spread | €-53.34/MWh |
| Cheap/Dear Spread | €20.39/MWh → €188.25/MWh (€167.86) |
Price Profile #
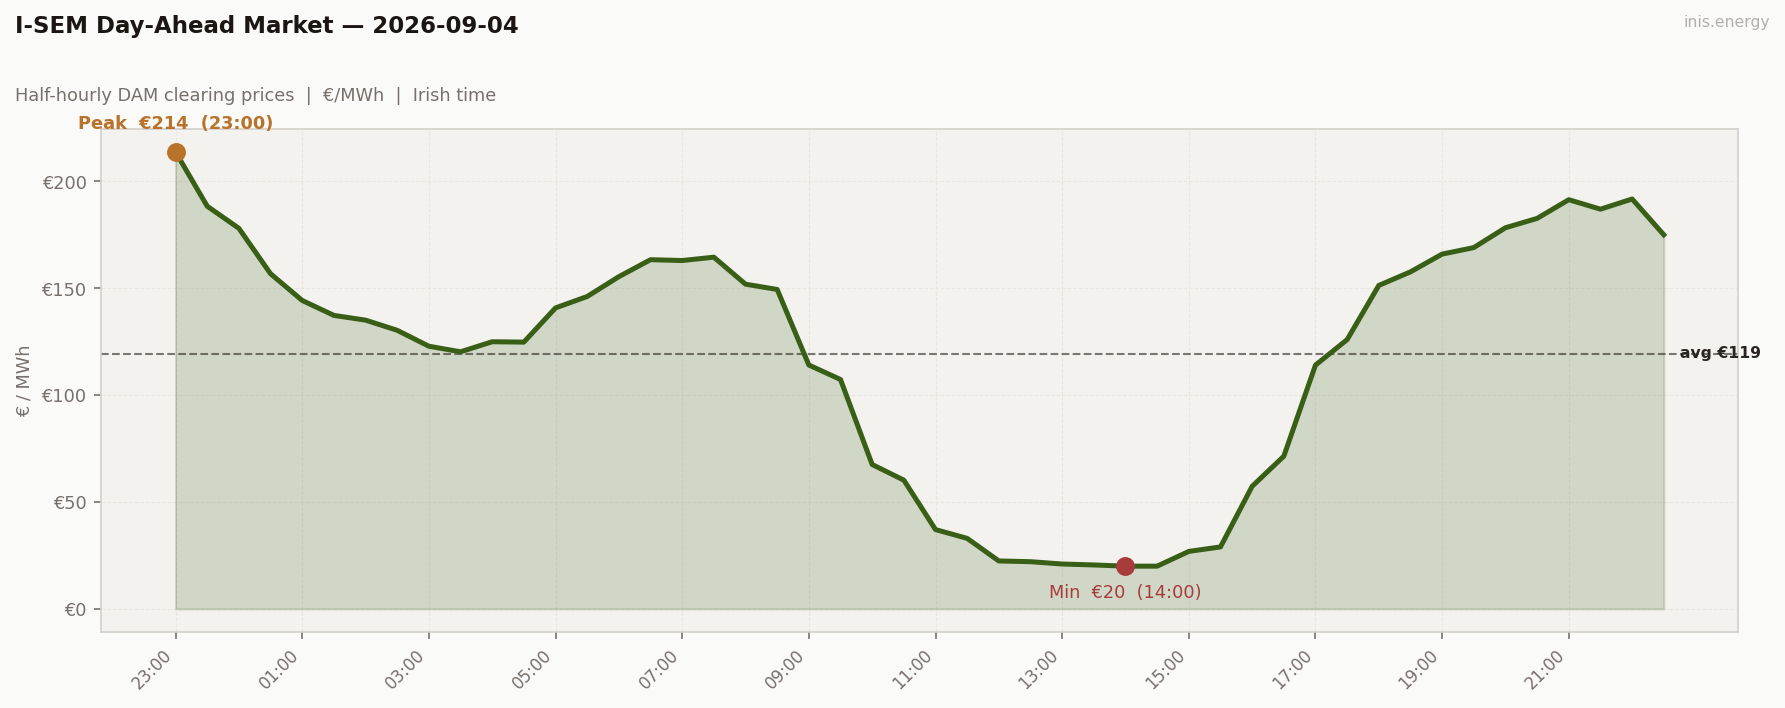
Std dev €59.17/MWh · Median €136.22/MWh · Periods above €150: 19 of 48 (40%)
Week in Context #
Price Duration Curve #
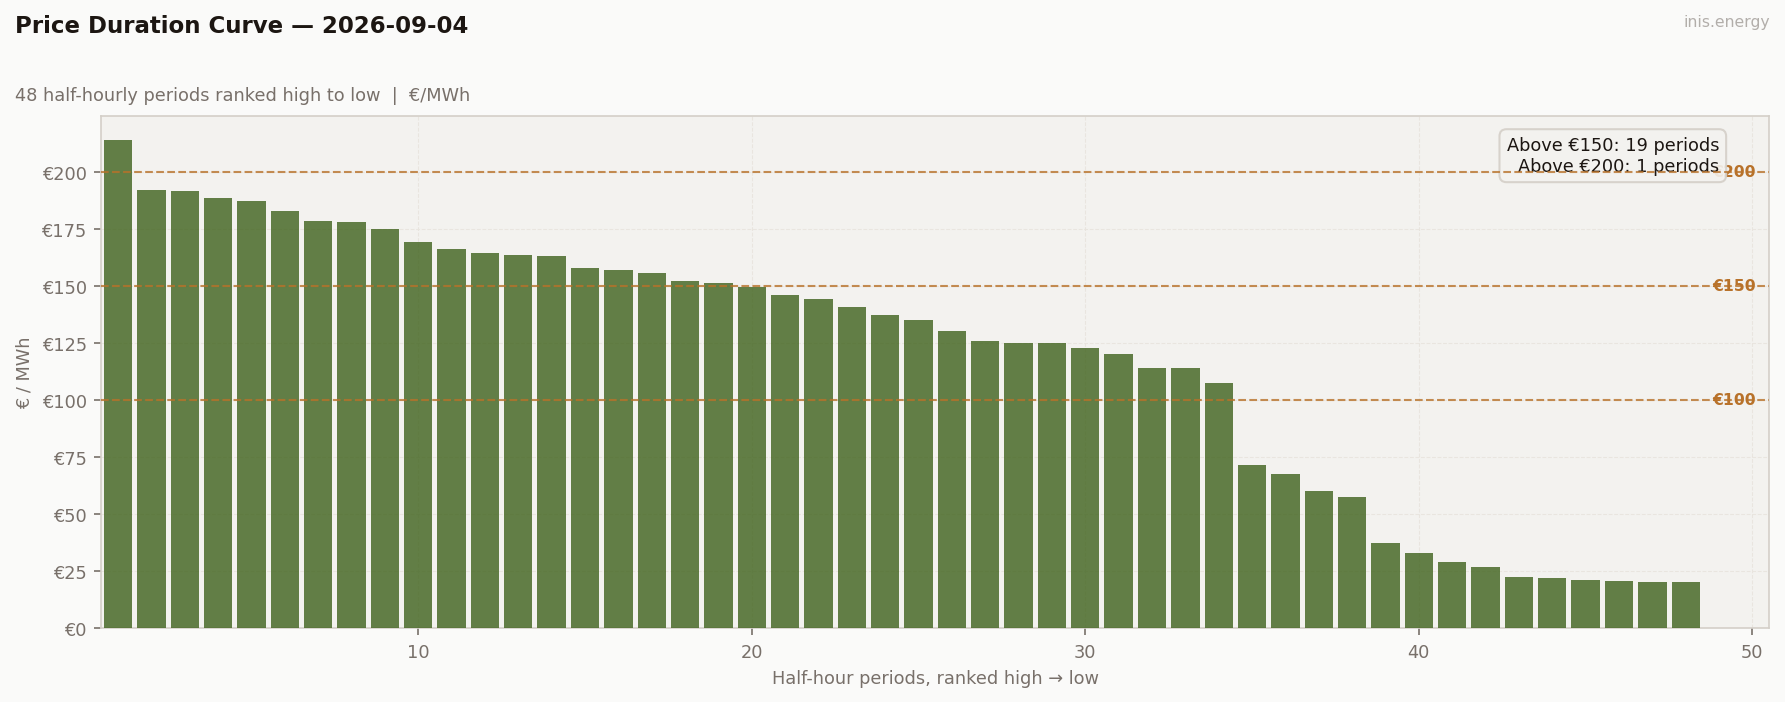
Periods above €150: 19 (40% of day) · Above €200: 1 (2% of day)
Peak / Off-Peak Spread #
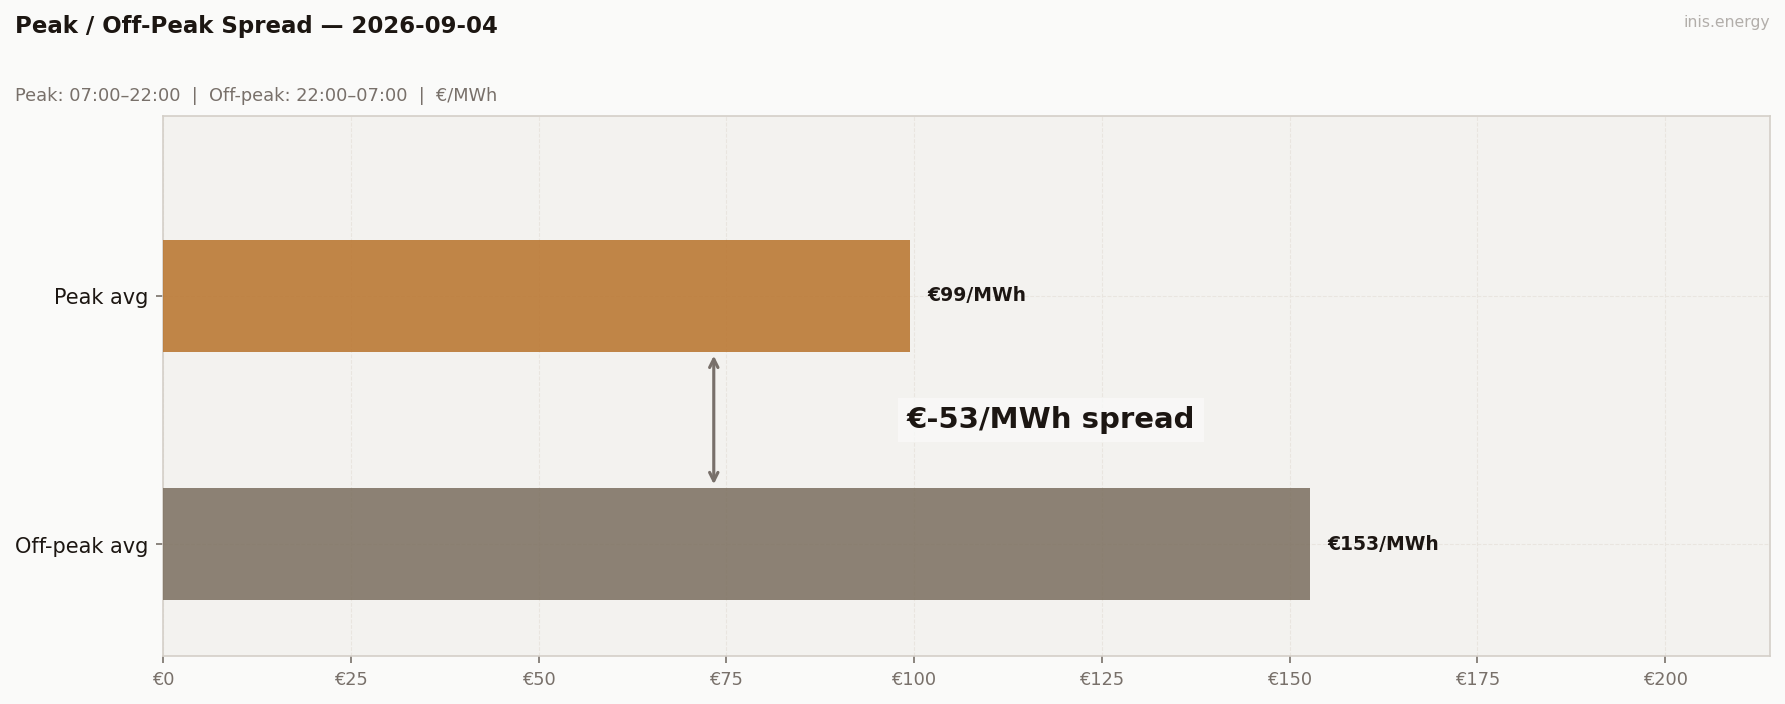
Peak avg (07:00–22:00): €99.43/MWh · Off-peak avg: €152.77/MWh · Spread: €-53.34/MWh
Cheap window: €20.39/MWh · Dear window: €188.25/MWh · Spread: €167.86/MWh — the actual cheapest and dearest 2-hour blocks of the day, wherever they fall on the clock
Commentary #
No generation-mix data today, but the price curve doesn’t need one to tell this story: it collapsed from €164.57 at 07:30 to a flat €20.00 through 13:30 and 14:00–14:30, then rocketed back to €213.79 by 23:00. That’s a textbook renewables-glut shape read straight off the curve — a deep, sustained midday floor, a near-empty afternoon, and all the value pushed to the evening and overnight edges.
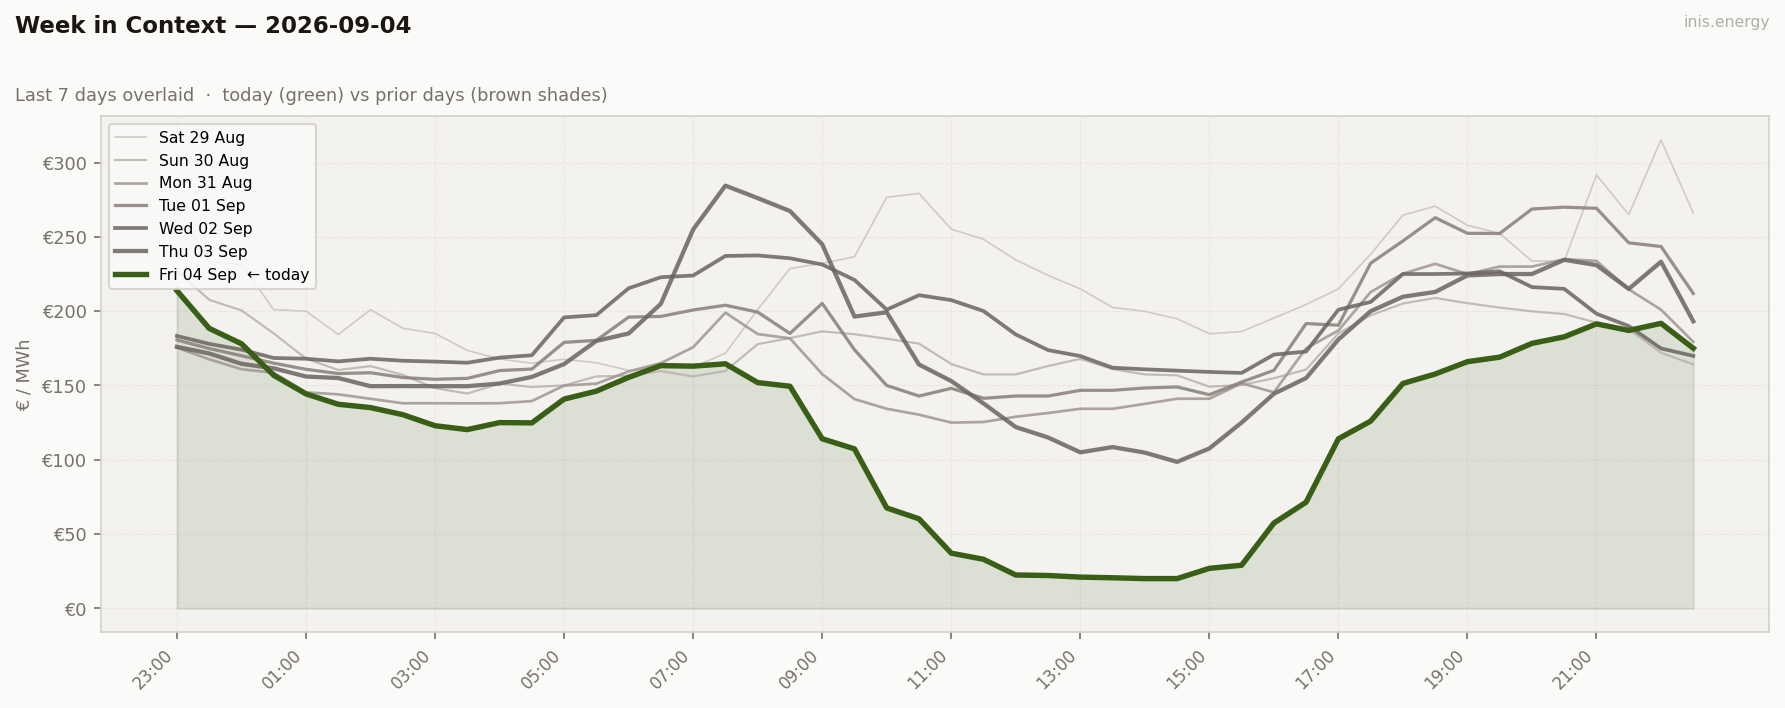
The knock-on effect: peak/off-peak spread went negative for the first time this fortnight (-€53.34) — the off-peak average (€152.77) actually beat the peak average (€99.43). Mean fell to €119.43, the lowest of the run, and only a single half-hour cleared €200 all day. When the floor falls out at midday, the whole day’s average follows it down.
Half-hourly data — 2026-09-04
| Period | Time | Price (€/MWh) |
|---|---|---|
| 1 | 23:00 | 213.79 |
| 2 | 23:30 | 188.42 |
| 3 | 00:00 | 178.06 |
| 4 | 00:30 | 156.82 |
| 5 | 01:00 | 144.31 |
| 6 | 01:30 | 137.33 |
| 7 | 02:00 | 135.10 |
| 8 | 02:30 | 130.35 |
| 9 | 03:00 | 122.90 |
| 10 | 03:30 | 120.30 |
| 11 | 04:00 | 125.00 |
| 12 | 04:30 | 124.83 |
| 13 | 05:00 | 140.83 |
| 14 | 05:30 | 146.17 |
| 15 | 06:00 | 155.45 |
| 16 | 06:30 | 163.39 |
| 17 | 07:00 | 163.00 |
| 18 | 07:30 | 164.57 |
| 19 | 08:00 | 151.93 |
| 20 | 08:30 | 149.47 |
| 21 | 09:00 | 114.11 |
| 22 | 09:30 | 107.33 |
| 23 | 10:00 | 67.56 |
| 24 | 10:30 | 60.24 |
| 25 | 11:00 | 37.12 |
| 26 | 11:30 | 33.00 |
| 27 | 12:00 | 22.43 |
| 28 | 12:30 | 22.09 |
| 29 | 13:00 | 21.00 |
| 30 | 13:30 | 20.56 |
| 31 | 14:00 | 20.00 |
| 32 | 14:30 | 20.00 |
| 33 | 15:00 | 26.90 |
| 34 | 15:30 | 29.00 |
| 35 | 16:00 | 57.36 |
| 36 | 16:30 | 71.45 |
| 37 | 17:00 | 114.07 |
| 38 | 17:30 | 126.00 |
| 39 | 18:00 | 151.35 |
| 40 | 18:30 | 157.70 |
| 41 | 19:00 | 166.01 |
| 42 | 19:30 | 169.05 |
| 43 | 20:00 | 178.34 |
| 44 | 20:30 | 182.72 |
| 45 | 21:00 | 191.46 |
| 46 | 21:30 | 187.02 |
| 47 | 22:00 | 191.79 |
| 48 | 22:30 | 175.04 |
Compare your business electricity and gas rates in minutes with INIS Energy Brokers.
Compare rates