I-SEM Daily Briefing — 17 September 2026
Table of Contents
Market Snapshot
| Metric | Value |
|---|---|
| Mean DAM Price | €147.56/MWh |
| Median Price | €156.84/MWh |
| Std Dev | €75.03/MWh |
| Peak Price | €280.0/MWh (21:00) |
| Min Price | €22.16/MWh (12:30) |
| Price Range | €257.84/MWh |
| Periods above €150 | 32 of 48 (67%) |
| Periods above €200 | 12 of 48 (25%) |
| Peak Avg (07–22) | €132.84/MWh |
| Off-peak Avg (22–07) | €172.11/MWh |
| Peak/Off-Peak Spread | €-39.27/MWh |
| Cheap/Dear Spread | €23.66/MWh → €265.66/MWh (€242.0) |
| Wind % of Demand | 48.2% |
| Wind Range | 34.5%–55.5% |
| Mean Demand | 3999 MW |
Price Profile #
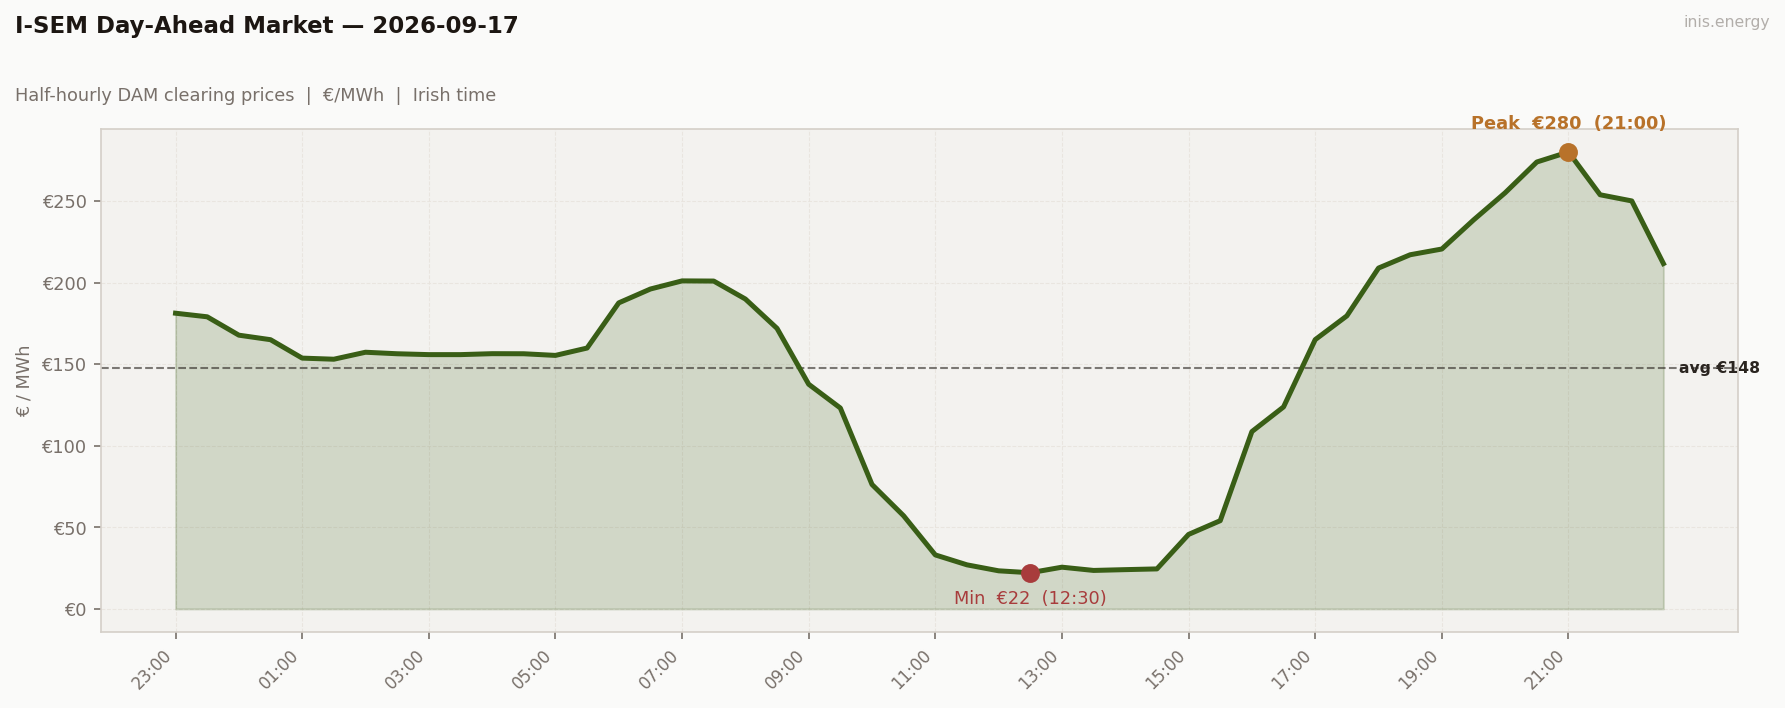
Std dev €75.03/MWh · Median €156.84/MWh · Periods above €150: 32 of 48 (67%)
Price vs Wind #
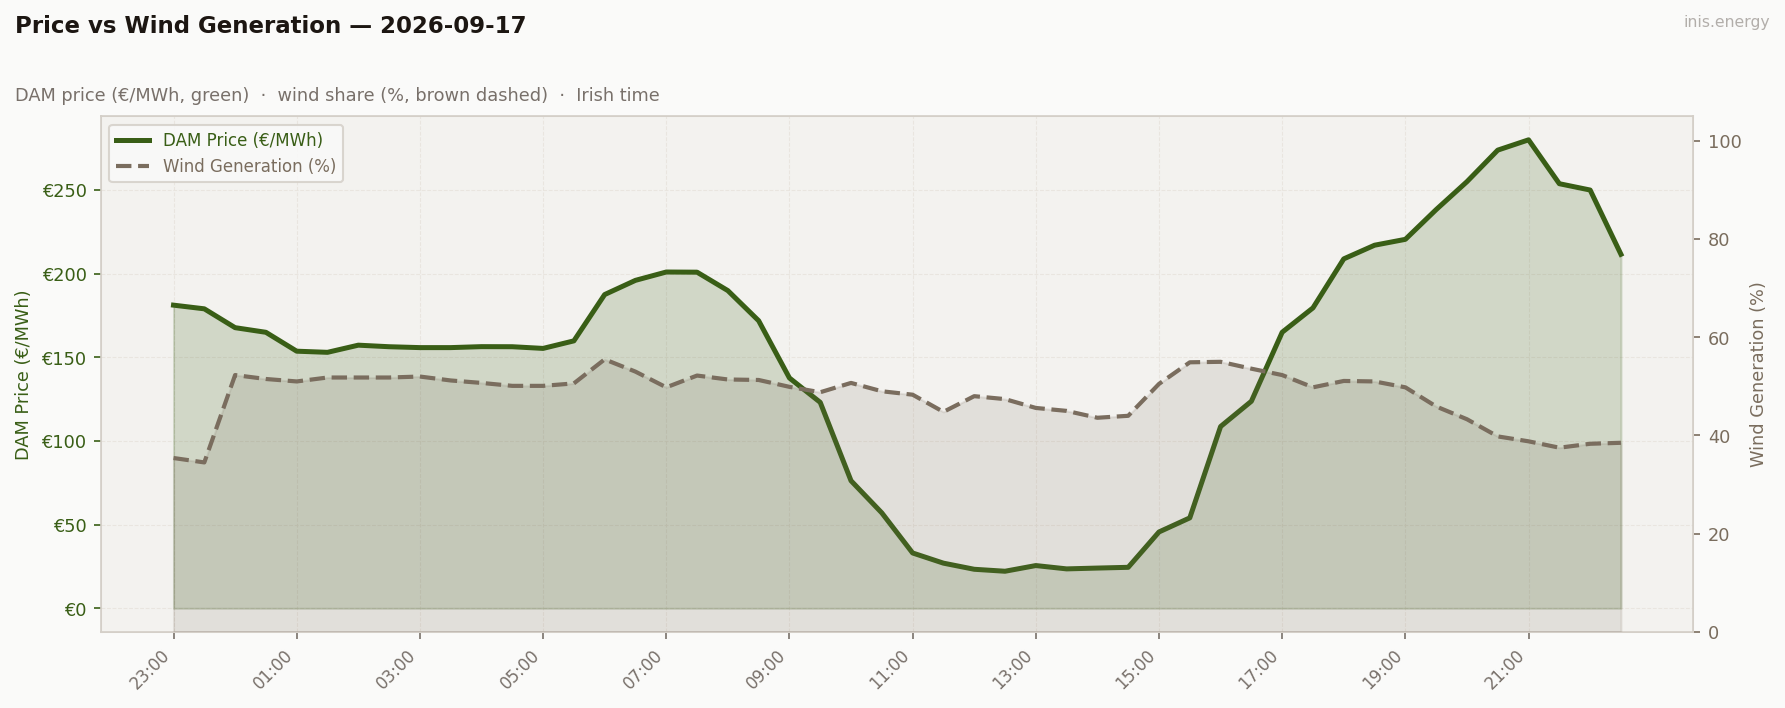
Mean wind: 48.2% · Range: 34.5%–55.5%
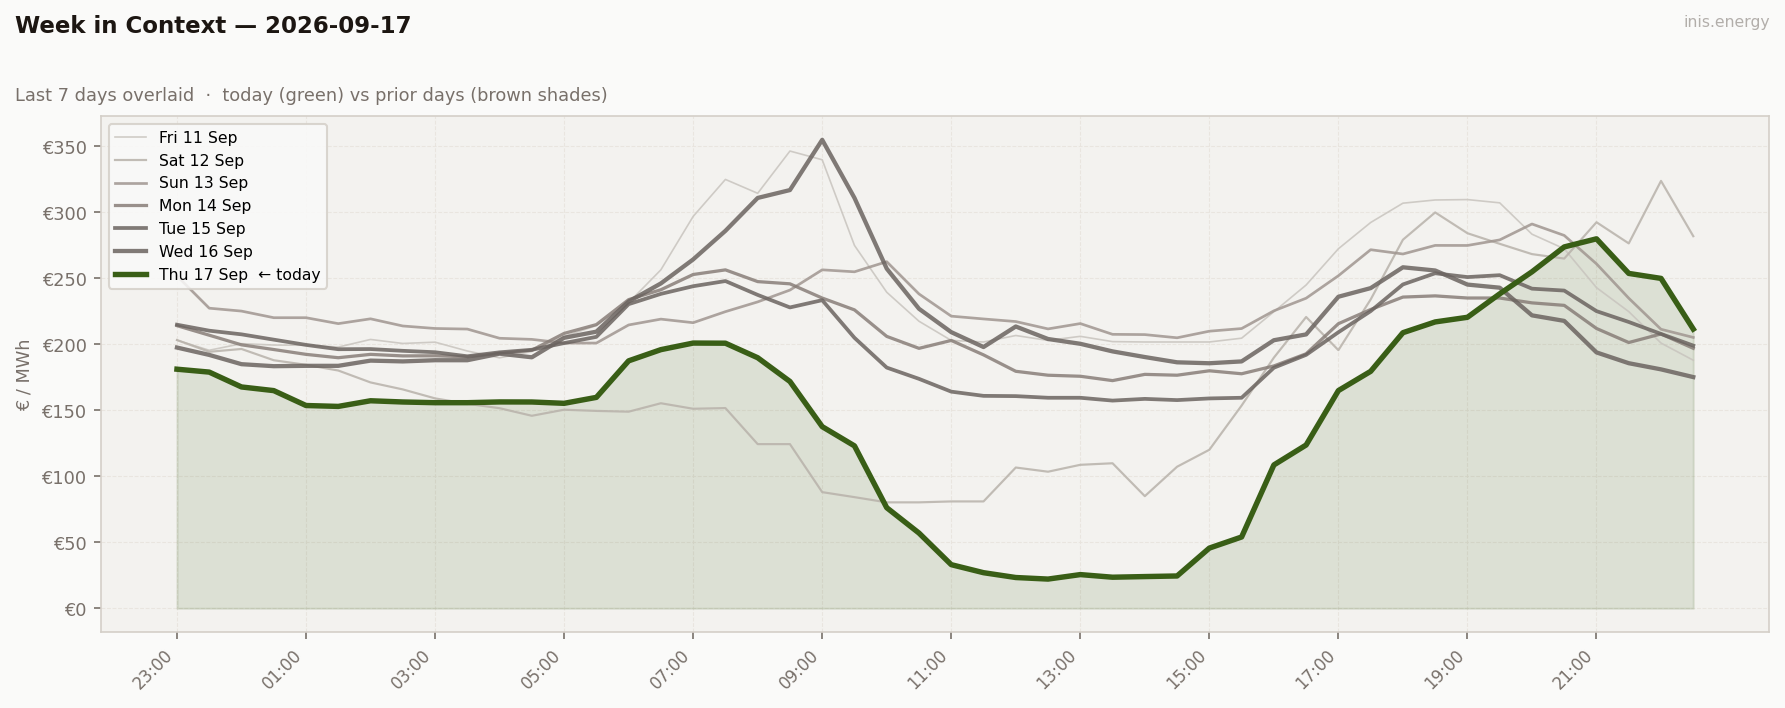
Week in Context #
Price Duration Curve #
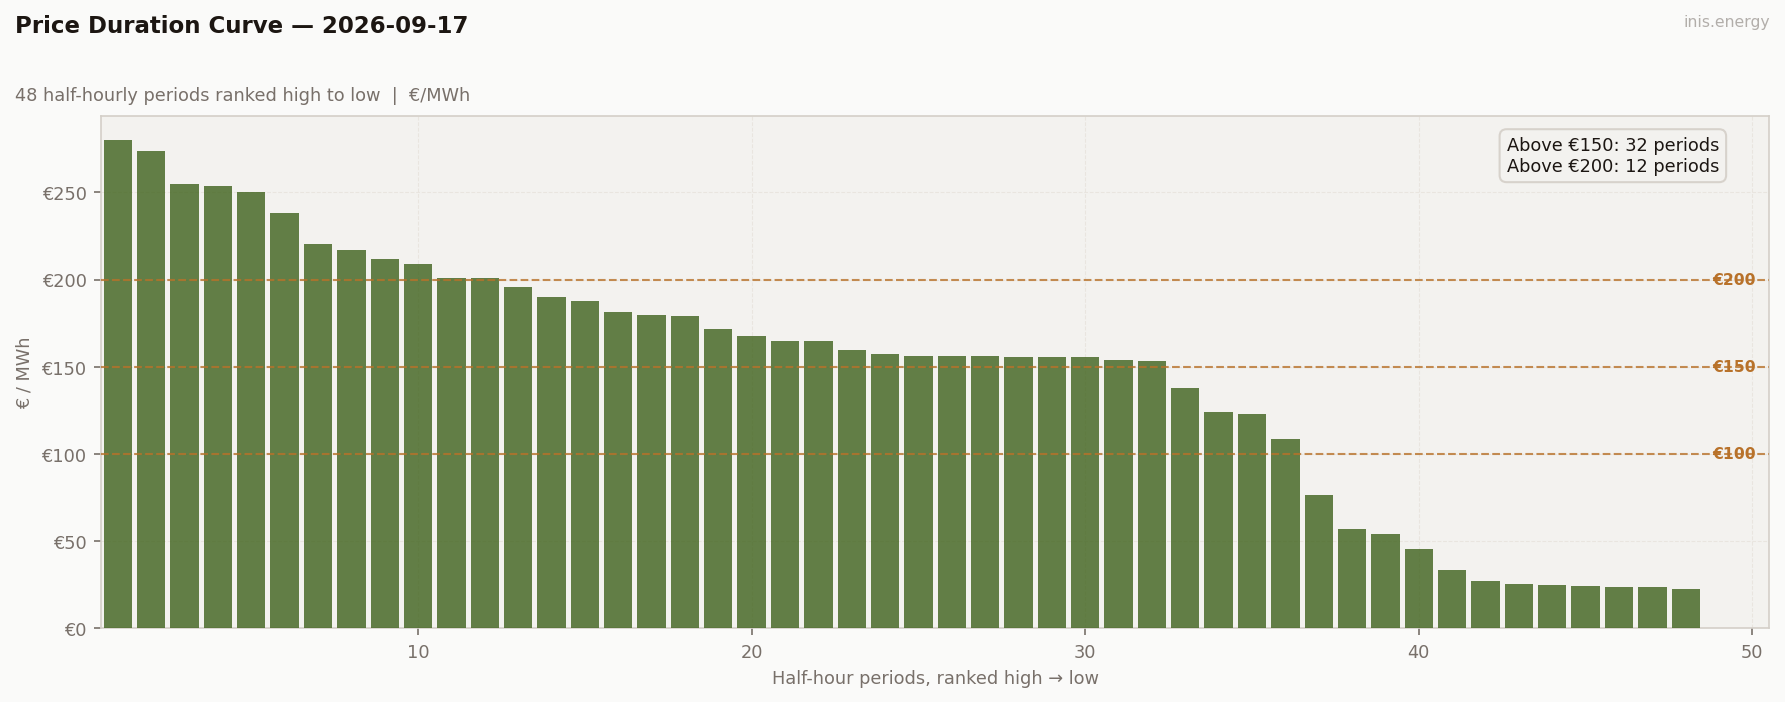
Periods above €150: 32 (67% of day) · Above €200: 12 (25% of day)
Peak / Off-Peak Spread #
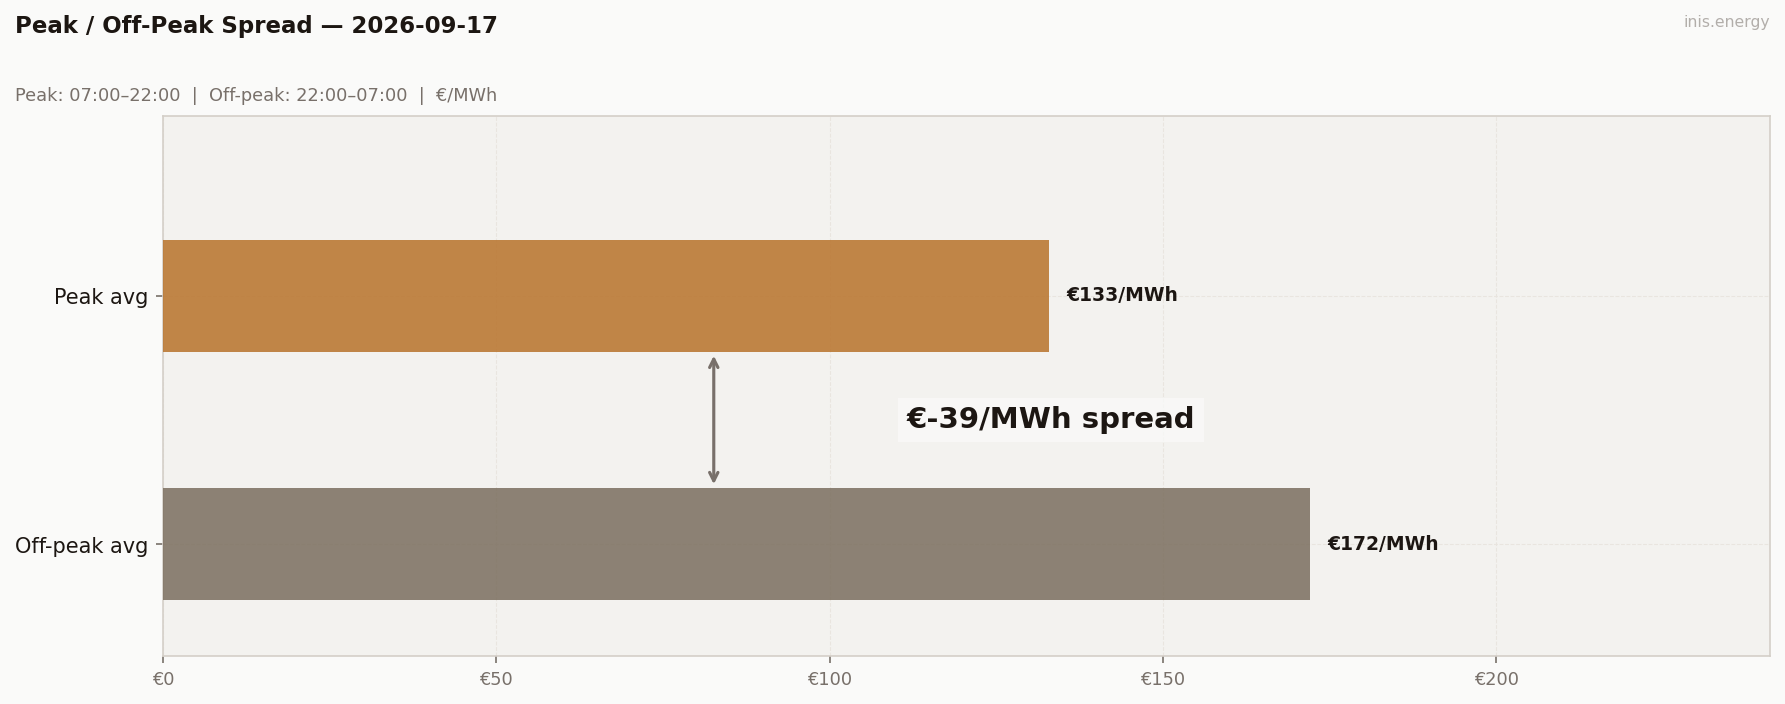
Peak avg (07:00–22:00): €132.84/MWh · Off-peak avg: €172.11/MWh · Spread: €-39.27/MWh
Cheap window: €23.66/MWh · Dear window: €265.66/MWh · Spread: €242.0/MWh — the actual cheapest and dearest 2-hour blocks of the day, wherever they fall on the clock
Commentary #
This is what cannibalisation looks like. Wind held 44-55% all day and the midday bottom fell out: €22.16 at 12:30, and sub-€30 from 11:30 through 14:30. Big wind + midday demand lull → the clearing price falls through the gas units and down into the renewable end of the merit order.
Overnight had the same wind but only got to €153. The evening came back hard once wind eased to 39%, peaking at €280 at 21:00. Mean of €147.56, but a cheap/dear spread of €242. Charge at €24, discharge at €266.
Best battery day of the fortnight by a distance. Give us another one Friday.
Half-hourly data — 2026-09-17
| Period | Time | Price (€/MWh) | Wind % |
|---|---|---|---|
| 1 | 23:00 | 181.20 | 35.4% |
| 2 | 23:30 | 179.00 | 34.5% |
| 3 | 00:00 | 167.74 | 52.3% |
| 4 | 00:30 | 164.97 | 51.5% |
| 5 | 01:00 | 153.68 | 51.0% |
| 6 | 01:30 | 153.00 | 51.8% |
| 7 | 02:00 | 157.28 | 51.8% |
| 8 | 02:30 | 156.35 | 51.8% |
| 9 | 03:00 | 155.82 | 52.0% |
| 10 | 03:30 | 155.82 | 51.2% |
| 11 | 04:00 | 156.40 | 50.7% |
| 12 | 04:30 | 156.35 | 50.1% |
| 13 | 05:00 | 155.34 | 50.1% |
| 14 | 05:30 | 159.85 | 50.6% |
| 15 | 06:00 | 187.53 | 55.5% |
| 16 | 06:30 | 196.02 | 53.0% |
| 17 | 07:00 | 201.00 | 49.8% |
| 18 | 07:30 | 200.90 | 52.2% |
| 19 | 08:00 | 189.89 | 51.4% |
| 20 | 08:30 | 171.90 | 51.3% |
| 21 | 09:00 | 137.67 | 49.9% |
| 22 | 09:30 | 123.10 | 48.8% |
| 23 | 10:00 | 76.25 | 50.7% |
| 24 | 10:30 | 57.03 | 49.0% |
| 25 | 11:00 | 33.08 | 48.3% |
| 26 | 11:30 | 27.00 | 44.8% |
| 27 | 12:00 | 23.34 | 48.0% |
| 28 | 12:30 | 22.16 | 47.4% |
| 29 | 13:00 | 25.56 | 45.6% |
| 30 | 13:30 | 23.57 | 45.0% |
| 31 | 14:00 | 24.06 | 43.6% |
| 32 | 14:30 | 24.51 | 44.0% |
| 33 | 15:00 | 45.64 | 50.5% |
| 34 | 15:30 | 54.06 | 54.9% |
| 35 | 16:00 | 108.65 | 55.0% |
| 36 | 16:30 | 123.77 | 53.6% |
| 37 | 17:00 | 165.00 | 52.3% |
| 38 | 17:30 | 179.57 | 49.8% |
| 39 | 18:00 | 208.86 | 51.1% |
| 40 | 18:30 | 217.02 | 51.0% |
| 41 | 19:00 | 220.53 | 49.8% |
| 42 | 19:30 | 238.30 | 45.9% |
| 43 | 20:00 | 255.00 | 43.3% |
| 44 | 20:30 | 273.85 | 39.8% |
| 45 | 21:00 | 280.00 | 38.8% |
| 46 | 21:30 | 253.78 | 37.5% |
| 47 | 22:00 | 250.00 | 38.3% |
| 48 | 22:30 | 211.60 | 38.5% |
Compare your business electricity and gas rates in minutes with INIS Energy Brokers.
Compare rates