I-SEM Daily Briefing — 27 September 2026
Table of Contents
Market Snapshot
| Metric | Value |
|---|---|
| Mean DAM Price | €163.94/MWh |
| Median Price | €164.69/MWh |
| Std Dev | €68.91/MWh |
| Peak Price | €290.0/MWh (21:00) |
| Min Price | €14.73/MWh (14:30) |
| Price Range | €275.27/MWh |
| Periods above €150 | 32 of 48 (67%) |
| Periods above €200 | 14 of 48 (29%) |
| Peak Avg (07–22) | €161.13/MWh |
| Off-peak Avg (22–07) | €168.63/MWh |
| Peak/Off-Peak Spread | €-7.5/MWh |
| Cheap/Dear Spread | €20.71/MWh → €261.11/MWh (€240.4) |
| Wind % of Demand | 40.0% |
| Wind Range | 18.3%–65.5% |
| Mean Demand | 3686 MW |
Price Profile #
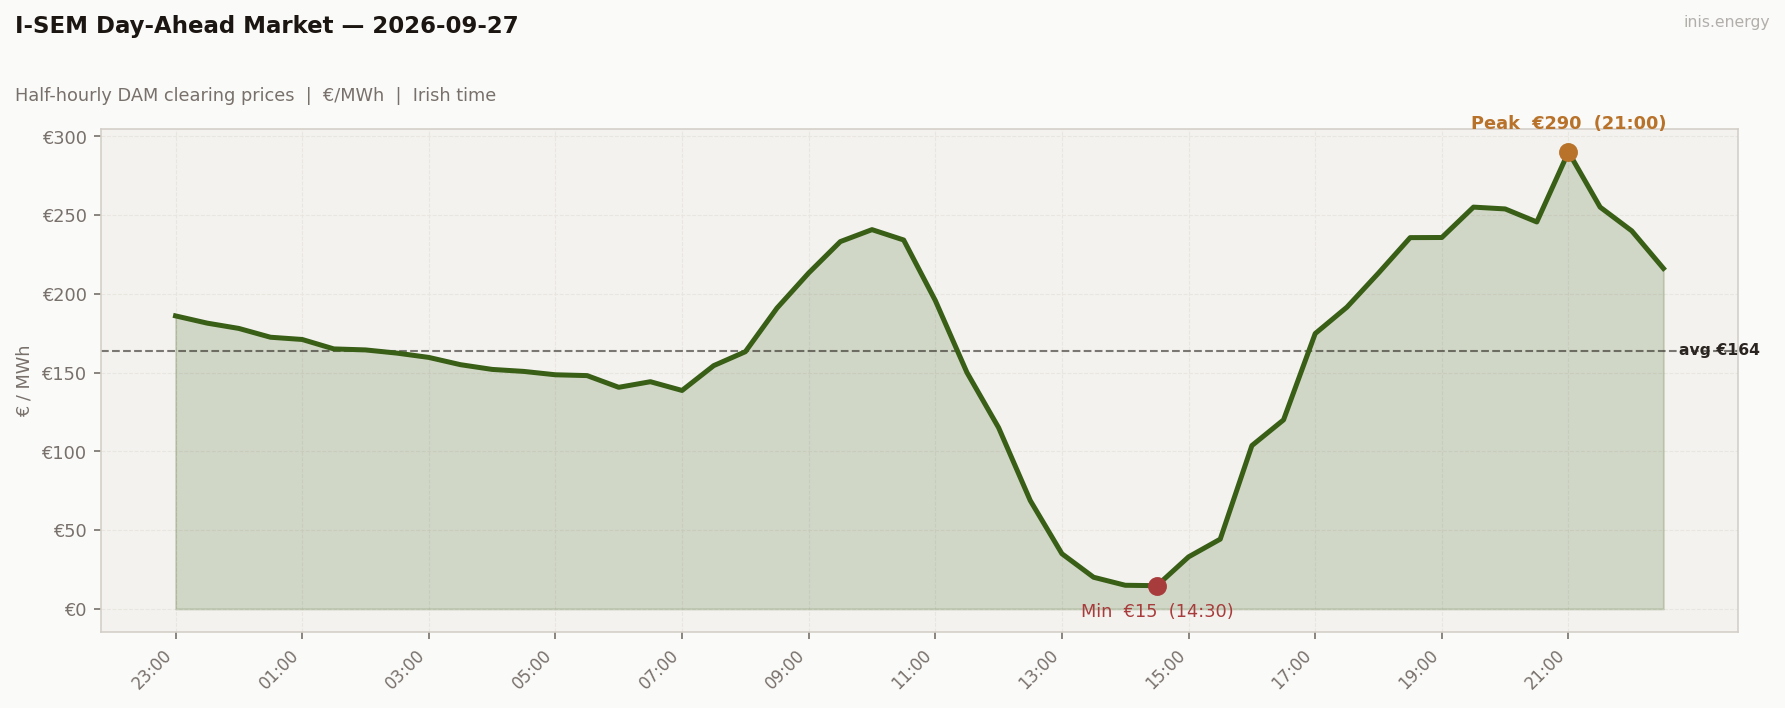
Std dev €68.91/MWh · Median €164.69/MWh · Periods above €150: 32 of 48 (67%)
Price vs Wind #
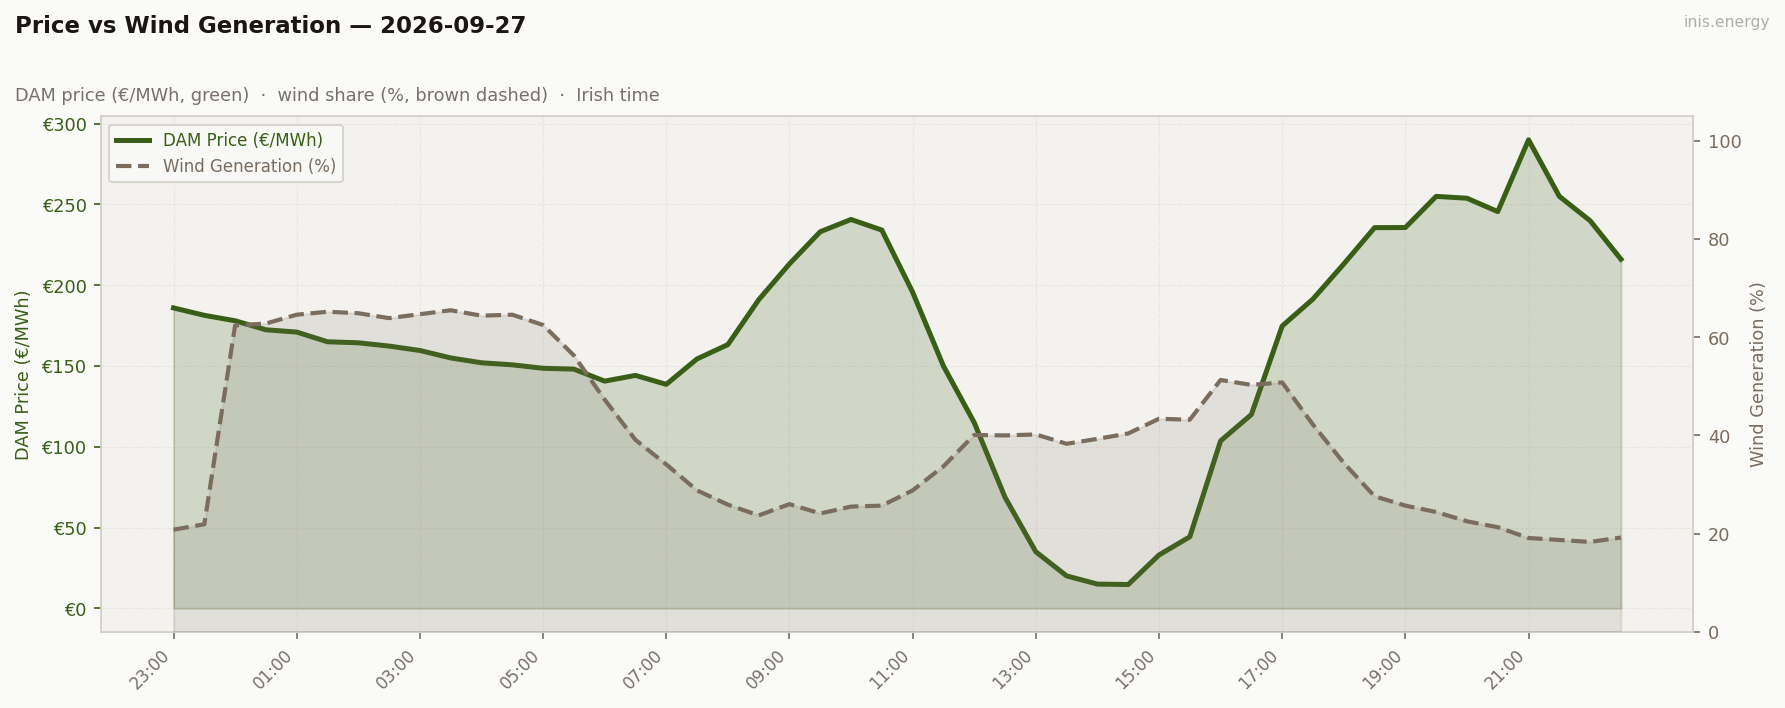
Mean wind: 40.0% · Range: 18.3%–65.5%
Week in Context #
Price Duration Curve #
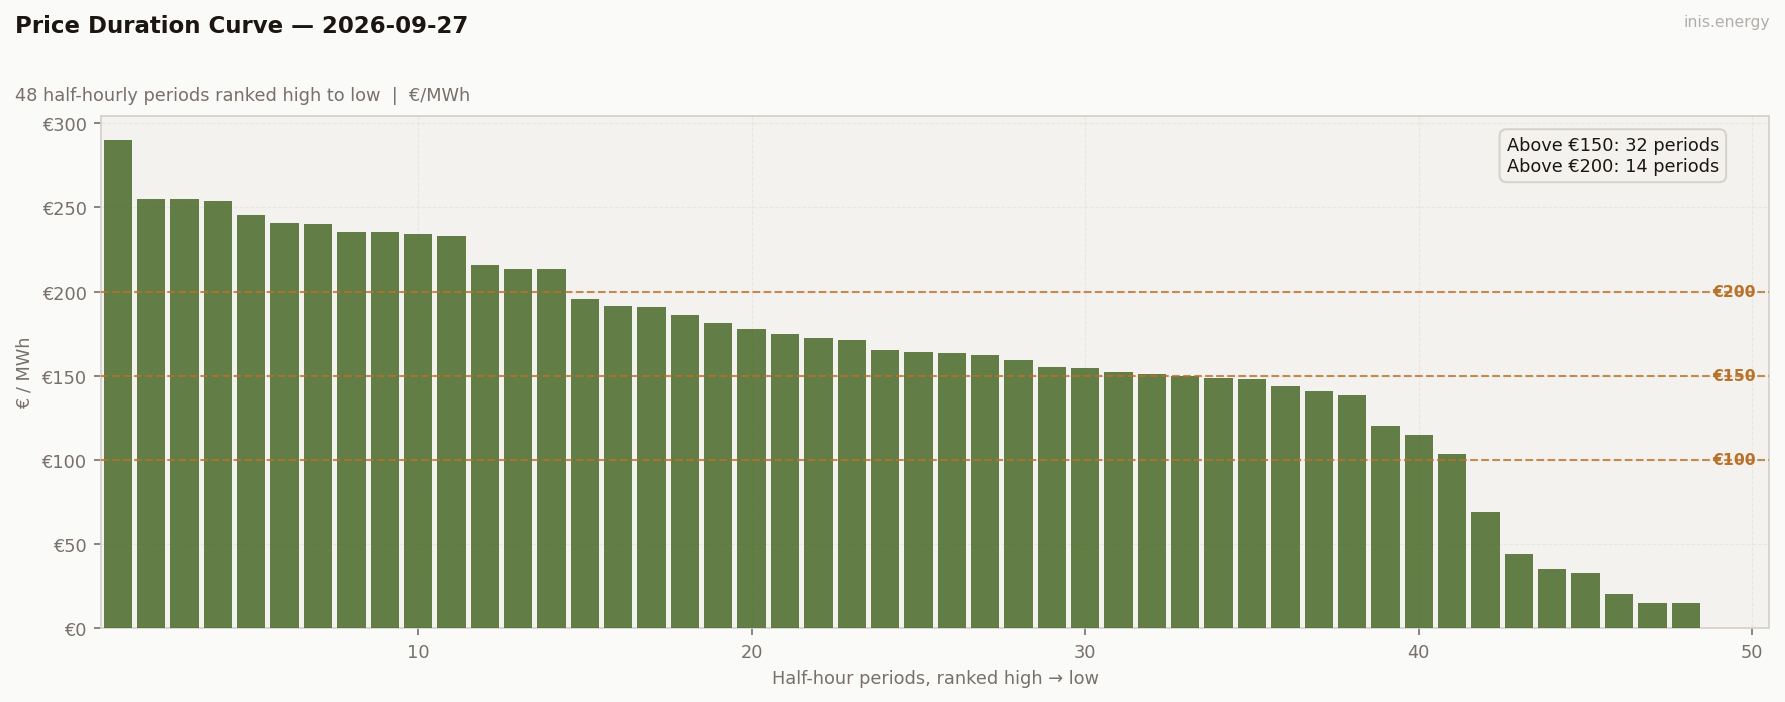
Periods above €150: 32 (67% of day) · Above €200: 14 (29% of day)
Peak / Off-Peak Spread #
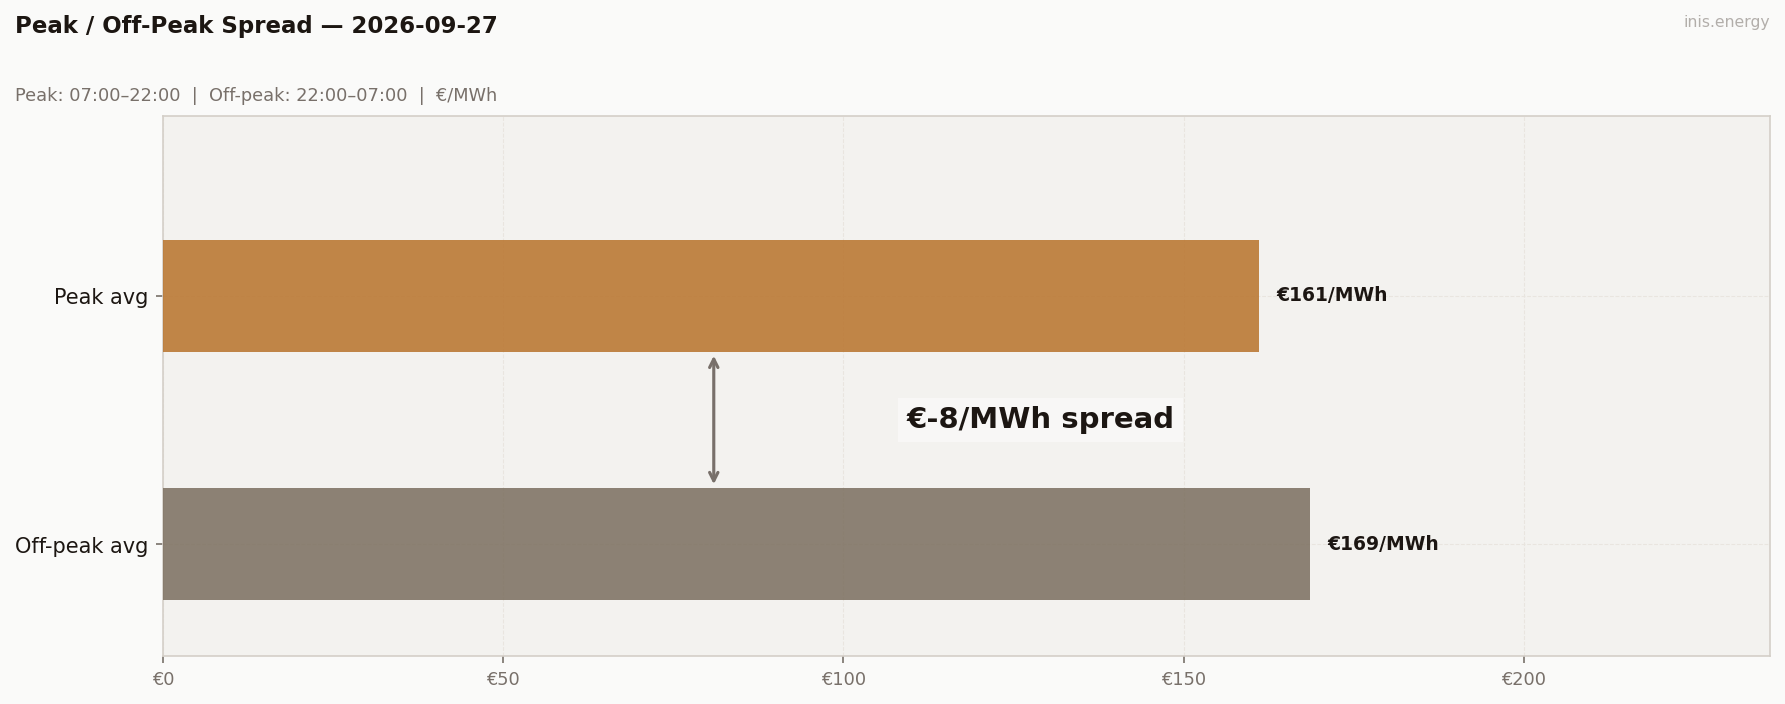
Peak avg (07:00–22:00): €161.13/MWh · Off-peak avg: €168.63/MWh · Spread: €-7.5/MWh
Cheap window: €20.71/MWh · Dear window: €261.11/MWh · Spread: €240.4/MWh — the actual cheapest and dearest 2-hour blocks of the day, wherever they fall on the clock
Commentary #
€14.73 at 14:30. Sunday demand was even lower than Saturday (3,686 MW), and with wind around 40% the midday floor almost disappeared: under €45 from 13:00 to 15:30.
Then the wind left. It dropped from 51% at 16:00 to 19% by 21:00, and the price went from €103 to €290 in the same window. The 21:00 spike is the day’s peak, late for a peak and well above the €245-€255 either side of it. The morning was a smaller version of the same story: wind down to 24%, price up to €240.71 at 10:00.
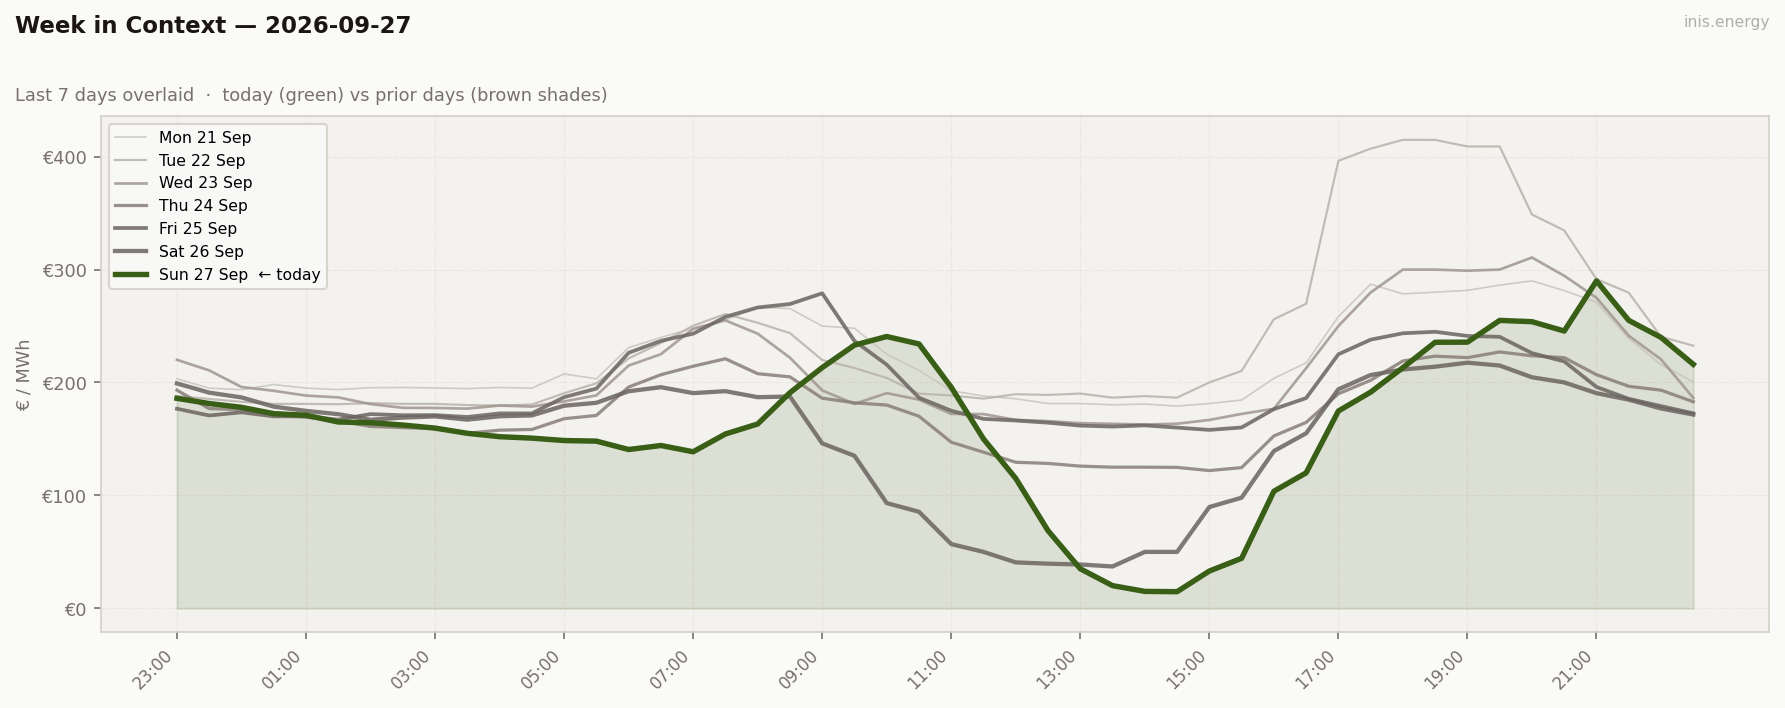
A €240.40 cheap/dear spread, second only to the €242 on the 17th. Wind is still low heading into Monday. That’s not a good sign.
Half-hourly data — 2026-09-27
| Period | Time | Price (€/MWh) | Wind % |
|---|---|---|---|
| 1 | 23:00 | 185.97 | 20.8% |
| 2 | 23:30 | 181.37 | 21.9% |
| 3 | 00:00 | 178.00 | 62.4% |
| 4 | 00:30 | 172.42 | 62.8% |
| 5 | 01:00 | 171.00 | 64.6% |
| 6 | 01:30 | 165.01 | 65.2% |
| 7 | 02:00 | 164.37 | 64.9% |
| 8 | 02:30 | 162.33 | 63.9% |
| 9 | 03:00 | 159.61 | 64.7% |
| 10 | 03:30 | 155.00 | 65.5% |
| 11 | 04:00 | 152.00 | 64.4% |
| 12 | 04:30 | 150.73 | 64.6% |
| 13 | 05:00 | 148.59 | 62.5% |
| 14 | 05:30 | 148.07 | 56.3% |
| 15 | 06:00 | 140.64 | 47.3% |
| 16 | 06:30 | 144.19 | 39.1% |
| 17 | 07:00 | 138.64 | 34.1% |
| 18 | 07:30 | 154.40 | 28.8% |
| 19 | 08:00 | 163.24 | 25.9% |
| 20 | 08:30 | 190.95 | 23.7% |
| 21 | 09:00 | 213.20 | 26.0% |
| 22 | 09:30 | 233.12 | 24.1% |
| 23 | 10:00 | 240.71 | 25.5% |
| 24 | 10:30 | 234.14 | 25.7% |
| 25 | 11:00 | 195.72 | 28.8% |
| 26 | 11:30 | 150.00 | 33.7% |
| 27 | 12:00 | 115.00 | 40.1% |
| 28 | 12:30 | 68.74 | 40.0% |
| 29 | 13:00 | 35.00 | 40.2% |
| 30 | 13:30 | 20.08 | 38.3% |
| 31 | 14:00 | 15.00 | 39.3% |
| 32 | 14:30 | 14.73 | 40.4% |
| 33 | 15:00 | 33.02 | 43.4% |
| 34 | 15:30 | 44.27 | 43.2% |
| 35 | 16:00 | 103.65 | 51.3% |
| 36 | 16:30 | 119.98 | 50.3% |
| 37 | 17:00 | 174.75 | 50.8% |
| 38 | 17:30 | 191.47 | 42.2% |
| 39 | 18:00 | 213.16 | 34.4% |
| 40 | 18:30 | 235.64 | 27.6% |
| 41 | 19:00 | 235.72 | 25.7% |
| 42 | 19:30 | 255.00 | 24.4% |
| 43 | 20:00 | 253.85 | 22.5% |
| 44 | 20:30 | 245.58 | 21.3% |
| 45 | 21:00 | 290.00 | 19.1% |
| 46 | 21:30 | 255.00 | 18.7% |
| 47 | 22:00 | 239.92 | 18.3% |
| 48 | 22:30 | 216.11 | 19.2% |
Compare your business electricity and gas rates in minutes with INIS Energy Brokers.
Compare rates